matlab导出fig文件数据
matlab处理数据的方法

matlab处理数据的方法标题:Matlab数据处理方法引言:Matlab是一种用于科学计算和数据处理的强大工具。
它具有丰富的函数库和简洁的语法,使得数据处理变得更加高效和便捷。
本文将介绍一些常用的Matlab数据处理方法,包括数据导入与导出、数据清洗与预处理、数据分析与可视化等方面的内容。
一、数据导入与导出1. 导入文本数据:使用`readtable`函数可以将文本文件导入为表格形式,方便后续的数据处理和分析。
2. 导入Excel数据:使用`readmatrix`函数可以直接从Excel文件中导入数值型数据,而`readcell`函数可以导入文本和混合型数据。
3. 导入数据文件夹:使用`dir`函数可以获取指定文件夹下的所有文件名,再结合相应的导入函数,可以批量导入多个文件的数据。
二、数据清洗与预处理1. 缺失值处理:使用`ismissing`函数可以判断数据中是否存在缺失值,使用`fillmissing`函数可以对缺失值进行填充或删除。
2. 重复值处理:使用`unique`函数可以找出数据中的唯一值,使用`duplicated`函数可以找出重复值所在的位置。
3. 数据类型转换:使用`str2double`函数可以将字符型数据转换为数值型数据,使用`char`函数可以将数值型数据转换为字符型数据。
4. 数据标准化:使用`zscore`函数可以对数据进行标准化处理,使得数据的均值为0,标准差为1。
5. 数据归一化:使用`normalize`函数可以对数据进行归一化处理,将数据缩放到指定的范围内,例如[0,1]或[-1,1]。
三、数据分析与可视化1. 描述性统计分析:使用`summary`函数可以生成数据的统计描述信息,包括均值、标准差、最大值、最小值等。
2. 相关性分析:使用`corrcoef`函数可以计算数据之间的相关系数矩阵,使用`heatmap`函数可以绘制相关系数热力图。
3. 数据聚类分析:使用`kmeans`函数可以进行k-means聚类分析,将数据分为指定数量的簇群。
(完整版)matlab保存图片的四种方法
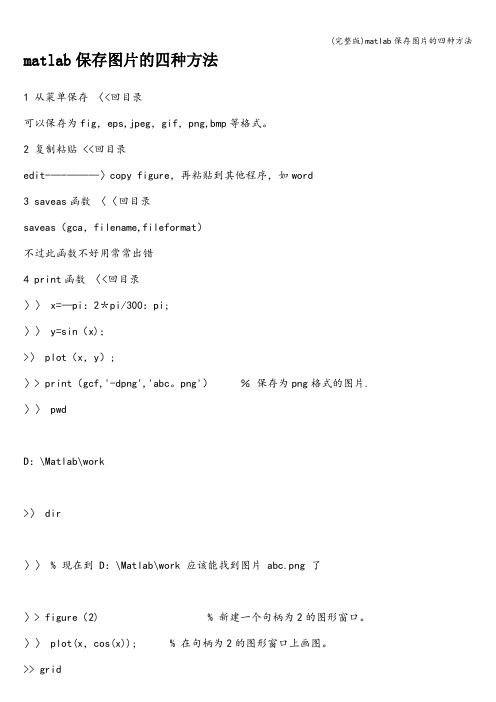
matlab保存图片的四种方法1 从菜单保存〈<回目录可以保存为fig,eps,jpeg,gif,png,bmp等格式。
2 复制粘贴 <<回目录edit-—-———〉copy figure,再粘贴到其他程序,如word3 saveas函数〈〈回目录saveas(gca,filename,fileformat)不过此函数不好用常常出错4 print函数〈<回目录〉〉 x=—pi:2*pi/300:pi;〉〉 y=sin(x);>〉 plot(x,y);〉> print(gcf,'-dpng','abc。
png')%保存为png格式的图片. 〉〉 pwdD:\Matlab\work>〉 dir〉〉 % 现在到 D:\Matlab\work 应该能找到图片 abc.png 了〉> figure(2) % 新建一个句柄为2的图形窗口。
〉〉 plot(x,cos(x)); % 在句柄为2的图形窗口上画图。
>> grid>> print(2,’—djpeg’,’D:\abc.jpeg’); %将句柄为2的图形保存为jpeg/jpg格式的图片,>> %文件名为'D:\abc。
jpeg’。
4。
2 用法:print(图形句柄,存储格式,文件名);〈<回目录图形句柄,如果图形窗口标题栏是“Figure 3”,则句柄就是3.用gcf可以获取当前窗口句柄. 指定存储格式。
常用的有:png格式:‚-dpng‘ (推荐这一种,与bmp格式一样清晰,文件也不大)jpeg: ‚-djpeg‘(文件小,较清晰)tiff: ‚—dtiff‘bmp: ‚—dbitmap‘(清晰,文件极大)gif: ‚-dgif‘(文件小但不清晰)文件名在matlab中自动保存plot图像的程序Step 1. 先使所画的图最大化,即占满整个屏幕scrsz = get(0,’ScreenSize');figure1=figure('Position',[0 30 scrsz(3) scrsz(4)-95]);或者(下面这种情况会把windows系统下面的任务栏也保存到图片中,不太好)scrsz = get(0,’ScreenSize’);figure1=figure(’Position’,[0 0 scrsz(3) scrsz(4)-66]);% Step 2. 生成数据并画图x=rand(100,1);plot(x);saveas(gcf,’filename’,'bmp’);saveas(gcf,'filename',’emf’);saveas(gcf,'filename’,’jpg');% Step 3. 清理现场clear all; clc; close all;下面的代码可以创建一个大小为整个屏幕的四分之一,位置在屏幕在左上角的一个figure对像,使用root对象的ScreenSize属性来取得屏幕的尺寸,ScreenSize是由四个元素组成的数据:[left,bottom,width,height])。
Matlab Figure坐标调节及文件保存

Matlab Figure图形保存以及Simulink中Scope窗口坐标标注(label)的设置1、我们使用M a t l a b绘制出数据的各种图形需要保存的时候,不少同学是直接用屏幕截图的办法来做的,但这样出来的图并不清晰,不便于后续应用和处理,并且往往不符合发表论文的要求,很多论文是要求用.eps格式的图片的。
实际上,我们可以有下面两种更好的处理方法:(1)在论文里插入图片在M a t l a b的Figure窗口,点击菜单栏的E d i t,选择Copy Figure,然后转到你的文档界面,把光标放到需要插入图片的位置,然后Ctrl+C,你就可以得到比较清晰的图片了。
需要注意的是,这时候的图片有相当一部分空白区域,你可以用w o r d图片工具栏的‘裁剪’功能把图片空白区域消除掉。
另外,如果需要对图片的大小进行拉伸,最好不要直接用鼠标拖拉,这样容易导致图中的点线分布变形,可以右键点击图片,选择‘设置图片格式’,在‘大小’标签的‘缩放’栏里,设置图片的大小。
(2)直接保存Figure为了便于后续处理和应用,建议大家形成一个良好习惯,即把绘制所得的Figure窗口直接保存为.fig文件,以后你就可以多次打开它,对图像进行修改处理,例如加注标签(label等,也可以打开.fig文件把所显示的图像转存为其它格式的文件,例如.eps、.jpg等。
2、在做Simulink仿真时,使用的S c o p e波形显示模块实际上也是一种Figure窗口,不过Matlab把Scope的菜单栏隐藏起来,只提供了几个有限的参数设置。
如果需要对Scope中的图加上坐标、更改界面背景色等,没有菜单栏就基本上无从下手了。
可以在打开你的mdl文件之后,在Matlab的命令行输入以下指令来恢复显示S c o p e的Figure菜单栏:>> set(0,'ShowHiddenHandles','on');>> set(gcf,'menubar','figure');Scope窗口就如下所示:然后点击菜单栏的Edit,可以选择CopyFigure来保持波形图,也可以选择FigureProperties来调整S c o p e的各种图形属性,包括添加x l a b e l、y l a b e l、title,更改背景颜色,调整波形曲线的线型、粗细等等:P.S.:除了上面说的那两行指令外,在网上还找到一段相似的程序,不过我使用时M a t l a b提示第4行代码出现E r r o r,不知是何原因,也贴在这里大家分析下吧,呵呵。
matlab提取表格

在MATLAB中提取表格数据通常涉及读取包含表格数据的文件,例如CSV或Excel 文件,然后解析这些数据以将其转换为MATLAB中的结构或数组。
以下是一些基本步骤和示例,说明如何在MATLAB中提取表格数据。
1.读取CSV文件matlab复制代码% 读取CSV文件data = csvread('filename.csv');% 或者使用textscanfileID = fopen('filename.csv','r');C = textscan(fileID, '%f', 'Delimiter', ',');fclose(fileID);data = cat(2, C{:});2.读取Excel文件matlab复制代码% 读取Excel文件filename = 'filename.xlsx';sheet = 1; % 如果你想从特定的工作表中读取数据data = xlsread(filename, sheet);3.解析表格数据如果你的数据是结构化的(例如,每行有相同数量的列),你可以直接将其转换为数组。
否则,你可能需要进一步解析数据以提取表格结构。
例如,对于CSV文件,如果每行有相同数量的列,你可以直接这样做:matlab复制代码% 假设数据是N行M列的,可以这样操作data = data(:,1:end-1)'; % 去掉最后一列(通常是标题或元数据)如果数据结构复杂,你可能需要使用其他工具或自定义函数来解析数据。
4. 处理缺失值如果你的数据包含缺失值(例如,某些字段为空或为'N/A'),你可能需要在提取数据后处理这些缺失值。
你可以使用MATLAB的ismissing函数来检查缺失值:matlab复制代码% 检查每行是否含有缺失值hasMissing = any(ismissing(data), 2);5.使用Pandas(适用于Python)如果你更喜欢使用Python和Pandas库来处理表格数据,你也可以在MATLAB中使用Pandas。
输出Matlab画的图的一个方法

输出Matlab画的图的一个方法输出Matlab 画的图的一个方法已有215 次阅读2012-5-7 08:58|系统分类:科研笔记|关键词:matlab 输出图形 figure exportfig经常看到有些人用 Matlab 画图后保存为 EPS 格式或者 PNG 格式的图时字体太小。
不太美观。
这里把我常用的比较好方法和大家分享一下,也给自己和学生留个印记。
附件的exportfig.m 程序可以很好地把Matlab 画的图输出为很多格式的文件,并且可以设置字体的大小,颜色等,使用方便灵活。
用法很简单,把这个文件放在Matlab 的搜索目录中(最简单就是当前的工作目录)。
然后:fig=figure(1); % 定义一个 fig 的图形句柄.... % 这里用 plot 等函数画图..exportfig(fig, 'fig2.eps', 'FontMode', 'fixed','FontSize', 10, 'color', 'cmyk' ); % 把上面画的图(句柄为 fig )保存为 fig2.eps, 字号为 10,彩色。
运行以后就可以在当前目录看到一个名为 fig2.eps 的文件了。
这个 exportfig() 函数含有很多选项可以灵活设置,详看下面的说明:%EXPORTFIG Export a figure to Encapsulated Postscript.% EXPORTFIG(H, FILENAME) writes the figure H to FILENAME.H is% a figure handle and FILENAME is a string that specifies the % name of the output file.%% EXPORTFIG(...,PARAM1,VAL1,PARAM2,VAL2,...) specifies% parameters that control various characteristics of the output% file.%% Format Paramter:% 'Format' one of the strings 'eps','eps2','jpeg','png','preview' % specifies the output format. Defaults to 'eps'.% The output format 'preview' does not generate an output % file but instead creates a new figure window with a% preview of the exported figure. In this case the% FILENAME parameter is ignored.%% 'Preview' one of the strings 'none', 'tiff'% specifies a preview for EPS files. Defaults to 'none'.%% Size Parameters:% 'Width' a positive scalar% specifies the width in the figure's PaperUnits% 'Height' a positive scalar% specifies the height in the figure's PaperUnits%% Specifying only one dimension sets the other dimension % so that the exported aspect ratio is the same as the% figure's current aspect ratio.% If neither dimension is specified the size defaults to% the width and height from the figure's PaperPosition.%% Rendering Parameters:% 'Color' one of the strings 'bw', 'gray', 'cmyk'% 'bw' specifies that lines and text are exported in% black and all other objects in grayscale% 'gray' specifies that all objects are exported in grayscale % 'cmyk' specifies that all objects are exported in color% using the CMYK color space% 'Renderer' one of the strings 'painters', 'zbuffer', 'opengl' % specifies the renderer to use% 'Resolution' a positive scalar% specifies the resolution in dots-per-inch.%% The default color setting is 'bw'.%% Font Parameters:% 'FontMode' one of the strings 'scaled', 'fixed'% 'FontSize' a positive scalar% in 'scaled' mode multiplies with the font size of each% text object to obtain the exported font size% in 'fixed' mode specifies the font size of all text% objects in points% 'FontEncoding' one of the strings 'latin1', 'adobe'% specifies the character encoding of the font%% If FontMode is 'scaled' but FontSize is not specified then a % scaling factor is computed from the ratio of the size of the % exported figure to the size of the actual figure. The minimum% font size allowed after scaling is 5 points.% If FontMode is 'fixed' but FontSize is not specified thenthe % exported font sizes of all text objects is 7 points.%% The default 'FontMode' setting is 'scaled'.%% Line Width Parameters:% 'LineMode' one of the strings 'scaled', 'fixed'% 'LineWidth' a positive scalar% the semantics of LineMode and LineWidth are exactly the % same as FontMode and FontSize, except that they apply % to line widths instead of font sizes. The minumum line% width allowed after scaling is 0.5 points.% If LineMode is 'fixed' but LineWidth is not specified% then the exported line width of all line objects is 1% point.%% Examples:% exportfig(gcf,'fig1.eps','height',3);% Exports the current figure to the file named 'fig1.eps' with % a height of 3 inches (assuming the figure's PaperUnits is % inches) and an aspect ratio the same as the figure's aspect % ratio on screen.%% exportfig(gcf, 'fig2.eps', 'FontMode', 'fixed',...% 'FontSize', 10, 'color', 'cmyk' );% Exports the current figure to 'fig2.eps' in color with all % text in 10 point fonts. The size of the exported figure is % the figure's PaperPostion width and height.。
matlab图片数据读取总结
如:
x = 0 : pi / 100 : 2 * pi;
y = sin( x );
save( 'test.txt', 'x', 'y', '-ASCII' )
也可以直接导出到excel。
如:
d = {'Time', 'Temp'; 12 98; 13 99; 14 97};
%结果显示
xc %x轴数据矩阵
yc %y轴数据矩阵
解释:
gcf 返回当前Figure对象的句柄值
gca返回当前axes对象的句柄值
gco返回当前鼠标单击的句柄值,该对象可以是除root对象外的 任意图形对象,并且Matlab会把当前图形对象的句柄值存放在Figure的CurrentObject属性中。
axis([0 8 0 4]);
set(gcf,'outerposition',get(0,'screensize'));
②
请教各位大虫,我用Matlab计算然后用Plot命令画了一个图,但是我想把图上的数据导出来到origin处理,但是自己对M不太了解,请问最简单的方法怎么把数据导出来,txt, worksheet, Xls, csv等等都可以。
%四个角点对应的坐标为(0,0) (0,4),(8,4),(8,0)
x1 = (x1-min(x0))*8.0/(max(x0)-min(x0));
y1 = (y1-max(y1))*4.0/(min(y0)-max(y0));
plot(x1,y1,'r-','Markersize',5);%修改线的属性设置
Matlab数据导入导出方法
image
csvwrite('D:\matlab.txt',I_matlab);
% write the data into a text
file
sub_MATLAB= csvread('D:\matlab.txt',100,100);% read in part of the
data
sub_MATLAB= uint8(sub_matlab);
下面详细介绍这些函数。
1. csvread、csvwrite
csvread 函数的调用格式如下:
● M = csvread('filename'),将文件 filename 中的数据读入,并且保存为 M,
filename 中只能包含数字,并且数字之间以逗号分隔。M 是一个数组,行数与
filename 的行数相同,列数为 filename 列的最大值,对于元素不足的行,以 0
以逗号分隔。
● csvwrite('filename',M,row,col),将数组 M 中的指定数据保存在文件中,
数据由参数 row 和 col 指定,保存 row 和 col 右下角的数据。
● csvwrite 写入数据时每一行以换行符结束。另外,该函数不返回任何值。
这两个函数的应用见下面的例子。
用格式如下:
● M = dlmread('filename')
● M = dlmread('filename', delimiter)
● M = dlmread('filename', delimiter, R, C)
● M = dlmread('filename', delimiter, range)
Matlab自编myfigure函数,快速输出figure图形曲线数据(原创)
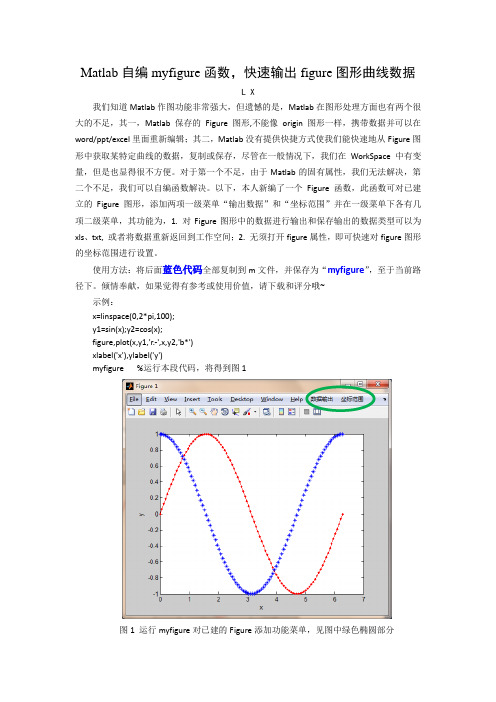
Matlab自编myfigure函数,快速输出figure图形曲线数据L X我们知道Matlab作图功能非常强大,但遗憾的是,Matlab在图形处理方面也有两个很大的不足,其一,Matlab保存的Figure图形,不能像origin图形一样,携带数据并可以在word/ppt/excel里面重新编辑;其二,Matlab没有提供快捷方式使我们能快速地从Figure图形中获取某特定曲线的数据,复制或保存,尽管在一般情况下,我们在WorkSpace中有变量,但是也显得很不方便。
对于第一个不足,由于Matlab的固有属性,我们无法解决,第二个不足,我们可以自编函数解决。
以下,本人新编了一个Figure函数,此函数可对已建立的Figure图形,添加两项一级菜单“输出数据”和“坐标范围”并在一级菜单下各有几项二级菜单,其功能为,1. 对Figure图形中的数据进行输出和保存输出的数据类型可以为xls、txt, 或者将数据重新返回到工作空间;2. 无须打开figure属性,即可快速对figure图形的坐标范围进行设置。
使用方法:将后面蓝色代码全部复制到m文件,并保存为“myfigure”,至于当前路径下。
倾情奉献,如果觉得有参考或使用价值,请下载和评分哦~示例:x=linspace(0,2*pi,100);y1=sin(x);y2=cos(x);figure,plot(x,y1,'r.-',x,y2,'b*')xlabel('x'),ylabel('y')myfigure %运行本段代码,将得到图1图1 运行myfigure对已建的Figure添加功能菜单,见图中绿色椭圆部分1 坐标范围设置,如图2图2 通过单击“坐标范围”菜单下的坐标设置对坐标范围快速设置2 数据输出(至excel或txt或workspace),如图3输出的数据格式,为若干列,一条曲线占两列,分别为x,y,多条则为x,y,x,y。