管理经济学ManagerialEconomics12
管理经济学ManagerialEconomics
Q
例:谁支付了奢侈品税?
一些国家对那些只有富人才买得起的奢侈品征收消 费税(如中国对购买轿车征收名目繁多的各种税费), 理由 是调节社会分配。这一类型的税真的是由富人来承担吗?
买者支付的价格 无税收的价格 税 收
价格上限只有低于均衡 价格才有意义。
P0
价格上限通常会导致市
PC
场短缺。
Q
价格下限(Price floor)
价格下限也称为支持价格 P (support price), 主要用于对某些在竞争中 pf 处于劣势的产业进行支持, p0
如农业、衰退中的产业
Q
2. 间接干预——征税与补贴
P
S2
S0
S1 p2
不会发生变动,只有需求量变动 ——如果商品自身价格以外的因素发生 变动,将
会导致需求发生变动
例:电力需求
P
P
p1
P0
p2
Da Da’
Qa1’
Qa1 Qa0 Q
Db’
Db
Qb0 Qb0’ Qb2
Q
第二节 供给
一. 供给量 在一定时期内、一定条件下,生产者愿
意并且能够向市场提供的商品或劳务的数量。
影响供给量的主要因素: 1. 商品自身的价格(P); 2. 成本(C); 3. 对未来的预期(E);
确定方案。决策意味着选择。必须围绕问题形成两个 以上的合理方案。
选择方案。在考虑各种制约因素的限制下,对每个方 案进行评估,选择其中最优方案。
方案实施。决策只有实施才能取得效果。
目标
行为准则
假设:生产者追求利润最大化
利润最大化与价值(财富)最大化
A 利润最大化是一种短期目标;
管理经济学(全林版本)(推荐PPT185)-文档资料

3
4
5
衣服产量(万件)
二、经济学的定义和研究对象
1、经济学的定义:经济学研究人们如何进 行选择,以便使用稀缺的或有限的生产性 资源来生产商品,并把它们分配给不同的 社会成员。
二、经济学的定义和研究对象
2、基本经济问题:
• 生产什么:确定需生产的产品及其产量。 • 如何生产:使用何种生产资源以及生产方式来
第一节 市场机制
一、需求 1.需求的定义:在其他因素不变条件下,某商品
或劳务的买者在某一时间以任何可能的价格愿 意并且能够购买的该种商品或劳务的数量 2.需求的表示方法 ①函数式:Qd = f (P), Qd —Quantity Demanded, P — Price ②需求表(Demand Schedule) ③需求曲线(Demand Curve)
产量 总成本 边际成本
(万元) (万元)
1
1
1
2
3
2
3
6
3
4 10
4
5 15
5
结果……
• 当两个分厂的边际成本彼此相等时,企 业的总成本最小。
• A分厂生产2单位,B分厂生产4单位,共 6单位。
Module 2 市场机制与需求分析
• 第一节 市场机制 • 第二节 消费者行为与市场需求 • 第三节 市场需求与预测
传统经济学 (理论与方法)
企业管理 (决策问题)
管理经济学 (运用经济理论与方法解
决企业问题)
企业问题的最佳答案)
需要的其他学科知识或工具
• 数学 • 统计学 • 运筹学 • 会计学 • 市场学
2、管理经济学的研究范围
管理经济学研究如何对可供选择的方案进 行比较分析,从中找出最优方案。
美国著名经济学家埃德温曼斯菲尔德领衔宾夕法尼亚州...

美国著名经济学家埃德温·曼斯菲尔德领衔宾夕法尼亚州大学沃顿商学院三位顶级经济学教授联袂写作哈佛大学、斯坦福大学、麻省理工大学和沃顿商学院等世界一流大学采用中山大学管理学院毛韵诗教授亲自翻译最畅销的管理经济学领域教科书书名:阿伦&曼斯菲尔德管理经济学(Managerial Economics)书系:湛庐教材—BE0302-1书号:978-7-300-11173-5著译者:[美]布鲁斯·阿伦(W.Bruce Allen)尼尔·多赫提(Neil Doherty )基思·韦格尔特(Keith Weigelt) 埃德温·曼斯菲尔德(Edwin Mansfield) 著毛蕴诗译责任编辑:李季开本:大16开页数:450页纸张:轻型纸预计出版时间:2008年11月定价:69.00出版社:中国人民大学出版社◎作者简介埃德温·曼斯菲尔德(Edwin Mansfield)埃德温·曼斯菲尔德是宾夕法尼亚大学的经济学教授,他参与出版了几百本有关管理经济学、经济学等书籍,同时他的书籍也被翻译成多种语言,在世界各地出版发行。
他也是第一位受邀来到中国访问的美国管理领域的学者。
◎内容简介本书是有关管理经济学领域的领军教材,书中运用了丰富的真实事件与案例,从国际视野的角度阐述了管理经济学理论,并向读者展示了如何将所学到的基本概念运用到现实管理工作中去。
通过借助决策科学、数理统计学等学科的各种方法和工具,本书可以指导企业决策者高效率地配置稀缺资源,以及制定和实施能使企业目标得以实现的经济决策。
◎本书特点本书的作者团队都是在沃顿商学院教管理经济学。
大多数MBA学生在第一个学期都必须学习这门课。
开设这门课的目的就是为了帮助学生们把经济学原理用到商业实践中。
为此,作者设定了四个目标以帮助学生达成学习目标:第一个目标是使经济学成为决策模型。
因此,要让学生理解书中的等式和图形,并且明白作为管理者的他们为什么需要遵循经济学的一般规律,如边际分析或逆向归纳规律。
管理经济学-第一章(1)-绪论
管理经济学绪论 (managerial Economics)
1
经 济 学(Economics): 一定制度下研究资源的稀缺性
资源的稀缺性有两层含义 一、是指任何资源的取得都是有成 本的 二、是指相对于人的需要和欲望而 言任何资源都是有限的
2
经 济 学(Economics)的分类
理论经济学
• 2、企业的特征:生产规模化、分工合作、 生产组织严密、大量采用高新技术、所有 权与经营权分离、产品标准化、重视研究 开发与市场营销。 18
企业的性质
• 3、企业的起源与发展历史 • 手工作坊、工场手工业、工厂、公司、现 代企业、跨国公司 • 4、企业功能 • 资源转换、分配资源、创新 • 5、企业的运行机制 • 企业、市场与社会
19
企业的性质
• • • • • • • 6、现代企业理论 分为两大类:生产实体观与合同关系观 生产实体观企业理论 (1)新古典企业理论 (2)管理主义理论 (3)X效率理论 (4)两权分离理论
20
企业的性质
• • • • (5)企业创新理论 (6)企业知识理论 合同关系观企业理论 (1)交易费用理论:是一系列制度成本, 包括信息成本、谈判成本、拟订和实施契 约的成本、界定和控制产权的成本、监督 管理的成本和制度结构变化的成本。简言 之,包括一切不直接发生在物质生产过程 21 中的成本。
26
内容不同 微观经济学 (microeconomics) 宏观经济学 (macroeconomics) 方法不同 实证经济学(positive) 规范经济学(normative)
应用经济学
专业不同 管理经济学 产业经济 学 资源经济学 环境经济学 政策经济 学 制度经济学 信息 经济学等 部门不同 农业经济学 工业经济学
管理经济学麦圭根第12版,机械工业出版社
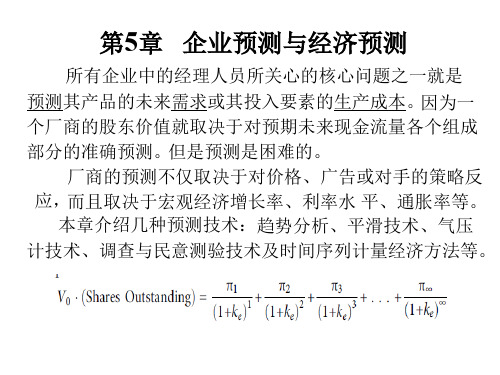
然后是单个厂商的销售预测。 简单的方法是将产业销售估计值与单个厂商的 预期市场份额联系起来,就可以得到关于单个厂商 销售预测值。 未来市场份额可以基于过去数据进行估计,还 要考虑营销策略等因素。
最后,厂商内部也存在预测的层级。经理人员要 估计全公司或地区的销售额;生产经理用这些预测 来规划原材料的订货量、雇工需要等决策;营销经 理使用销售预测来确定销售人员的安排、规划促销 活动等;财务经理也需要根据销售预测进行现金需 要的预测。
例如取线性方程、一期滞后以及白噪声随机扰动项 ( t =t)的模型将是一个1阶自回归过程
白噪声的定义除了要求均值为零外并没有对其应当服从 哪种概率分布作出任何假设,因此强调它的随机性。
对于此类问题之所以采用随机时间序列模型是由于: 前述最小二乘法的回归分析预测,对于一个时间序列Xt 的变动进行解释或预测,不论是单方程回归模型还是联 立方程回归模型,他们都是以因果关系为基础的,且具 有一定的模型结构,所以也称为结构式模型。
预测的层级
国民经济预测
产业销售预测 产业销售预测 产业销售预测
厂商 厂商 销售 销售 预测 预测
生产 营销 财务 预测 预测 预测
2.选择预测技术的准则
1. costs of the forecasting method compared with its gains plexity of the relationships among variables 3. time period involved 4. lead time between receiving information and the
4.可供选择的预测技术 确定性趋势分析; 平滑技术; 气压计技术; 调查与民意测验技术; 宏观计量经济模型 随机性时间序列分析
管理经济学-提纲彩色版
B.收入不变,价格变化
4
PX1=20, PX2=10
5
10 X
2。最佳化决策的图形 3。最佳决策化的数学公式 4。犄角解法(Corner solution) 5。应用:价格补助,实物补助, 还是货币补助?
五、消费者最佳决策点的变化
1。收入消费曲线与恩格尔曲线 收入消费曲线 从收入消费曲线引致恩格尔曲线
Y 收入消费曲线
I X1 X2 X3 I3 I2 I1
U3 U2 U1
恩格尔曲线 X
X1 X2 X3
X
三种恩格尔曲线 恩格尔曲线与恩格尔支出曲线
2。价格消费曲线 一般的价格消费曲线 吉芬商品的价格消费曲线 价格变化的效应分析 (1)收入效应 (2)替代效应
正常商品、一般低等品和吉芬商品三种 情况分析
减少Y而失去的效用 = 增加x而得到的效用
⊿Y
U3 U2 U1 ⊿X
(2)不能相交
Y
.a
.
b
. .c
X
5000
等高线
4000 3000
2000 1000
(3)密布性 (4)离开原点越远,效用水平越高 (5)凸向原点
⊿X
⊿Y
替代相同数量的Y要用 越来越多的X, 说明替
代越来越困难
⊿Y
⊿X
X
⊿X
二、基数效用分析
1。全部效用(Total Utility,TU) 概念 举例
消费商品数量 (W) 0 1 2 3 4 5 6
得到效用的数量 (Utils)nal Utility,MU)
消费商品数量 (W)
0 1 2 3 4 5 6
任常务副校长
1993年至今上海财经大学公共经济与管理 学院教授、博士生导师,曾到英国、美国、 罗马尼亚进修讲学
管理经济学第十二章012——具有市场力企业的管理决策课件PPT

Any firm that faces downward sloping demand has market power面临向下倾斜的需 求曲线的企业都具有市场力
是价格与边际成本之差占产品价格的比例。 其范围在0与1之间。nomics
勒纳指数
Also equals –1/E, which shows that the index (&
market power), vary inversely with elasticity The lower the elasticity of demand (absolute value),
5
Managerial Economics
需求价格弹性
运用需求价格弹性可以判断企业市场势力的大 小;
当其它条件相同时,如果需求价格弹性越小, 企业对价格的控制能力越强;
6
Managerial Economics
12.1.3勒纳指数( Lerner index )
Lerner index measures proportionate amount by which price exceeds marginal cost:
10
Managerial Economics
需求交叉价格弹性
需求交叉弹性可以用来判断竞争产品所 产生的替代程度大小。 当其他条件相同时,需求交叉弹性越大, 表明两种产品之间的竞争关系越激烈。 反之,则竞争关系越弱。 如果两种产品是可替代的,那么需求交叉 弹性为正。产品的交叉价格越高,替代 性越强,生产这两种产品的公司拥有的 市场力越弱。
《管理经济学讲稿

Manag e rial Economics《管理经济学》讲稿专业班级:信息管理与信息系统大类任课教师:吴如雪教材:《Managerial Economics》7th EditionS.Charles MauriceChristopher R.Tomas机械工业出版社CHAP14.Strategic Decision Making in Oligopoly Markets14.1Characteristics of oligopoly●Oligopoly is a market structure in which only a few sellers offer similar or identical products.It consists of a few relatively large firms,each with a substantial share of the market and all recognize their mutual interdependence.Mutual interdependence means that the actions of any one firm in the market will have an effect on the sales and revenues of other firms.Each firm knows that its actions or changes will have such an effect and that the other firms will,in response,take actions or make changes that will affect its sales.But no firm is really sure how the other firms will react—there is an uncertainty about the reaction of rivals to a price change.Common characteristics:(1)The number of firms in an oljgopoly market is small enough that each firm recognizes its mutual interdependence with the other firms.(2)All oligopolies have a certain amount of market power.If an oligopolist raises its price,it generally won’t lose all its sales;if it lowers its price,it won’t gain the entire market.(3)Oligopoly markets are characterized by some barriers to entry,ranging frommoderate to high.Differing characteristics:(1)Oligopolies can be classified by the type of product produced.In some oligopoly markets the products are homogeneous.Other oligopolymarkets are characterized by differentiated products.(2)Oligopolies can be Cooperativeor noncooperative:Cooperative oligopolists tend to follow changes made by rival firms.Noncooperative oligopolists,on the other hand,do not accommodate such changes.(3)Some oligopolistic market are characterized by a great deal of price competition.Inothers,firms don’t compete extensively by price changes but instead compete with theiradvertising,product quality,and marketing strategies.Four general oligopolistic market structures:(1)A few noncooperative firms producinga homogeneous product,(2)A few noncooperative firms producing related butdifferentiated products,(3)A few cooperative firms producing a homogeneous product,(4)A few cooperative firms producing related but differentiated products.Becauseoligopoly markets differ so greatly in their behavior patterns and in their overallcharacteristic,economists have not been able to develop a single general theory ofoligopoly,unlike the case for the other three market structures we have analyzed.●The problem with oligopoly demand:In spite of the uncertainty of rivals to a price change,managers of oligopolies should use the marginal revenue—marginal cost rule when making decisions.This is one of the most important rules of decision making,even when the market is characterized by uncertainty about the reaction of rivals.The problem for an oligopolist is accurately forecasting its demand and marginal revenue if it changes its price.Any change in price and output has a noticeable effect on the sales of other firms.These rivals may react by changing their prices and output,or they may not react at all.In our discussion of oligopoly markets,we will emphasize that the price and output decisions depend critically upon the assumptions made about the behavioral reactions of rival managers.Since many different assumptions can and have been made,many different solutions can and have been reached. 14.2Decision making when rivals make simultaneous decisionsOligopolists are mutual interdependence.Mutual interdependence requires strategic behavior.We can’t give a set of rules to follow.The art of making strategic decisions is learned from experience.We can,however,introduce a tool for thinking about strategic decision making.●Game theory provides a useful guideline on how to behave in strategic situations involvinginterdependence.This theory was developed approximately50years ago in order to provide a systematic approach to strategic decision making.A game is any decision-making situation where people compete with each other for thepurpose of gaining the greatest individual payoff,rather than group payoff,from playingthe game.In the game of oligopoly,the people in the game,often called“players”,aremanagers of the oligopoly firm.Payoffs in the oligopoly game are the individual profitsearned by each firm.Simultaneous decision games occur in oligopoly markets when managers must make their individual decisions without knowing the decisions of their rivals.Decisions don’thave to take place at the same time in order to be“simultaneous”.●The prisoner’s dilemma—a widely known game of simultaneous decision makingThe story(page533)Payoff table is a table showing,for every possible combination of decisions players canPayoff table:Bill Don’t confess Confess Common knowledge is a situation in which all decision makers know the payoff table,Payoff table:Palace’s price High($10) Low ($6) Pizza Palace has a dominant strategy: price low at $6. Pizza Castle does not have a dominant make, the outcomes or “payoffs” for each of the players in each decision combination.Jones Don’t confessConfess and they believe all other decision makers also know the payoff table. This common knowledge of the payoff table plays a crucial role in determining the outcome of a simultaneous decision game.A dominant strategy in a game theory is a strategy or action that always provides thebest outcome no matter what decisions rivals make. The prisoner’s dilemma illustrates a way of predicting the likely outcome of a strategic game using the concept of a dominant strategy. In the prisoner’s dilemma, confessing is a dominant strategy for each suspect.When a dominant strategy exists, a rational decision maker always chooses to follow its own dominant strategy and predicts that if its rivals have dominant strategy, they also will choose to follow their dominant strategy.The outcome of a game in which both players have dominant strategies and play them iscalled a dominant-strategy equilibrium. When all decision makers have dominant strategies (and know their dominant strategies), managers will be able to predict the actions of their rivals with a great deal of certainty.Most strategic situations, in contrast to the prisoner’s dilemma game, do not have a dominant-strategy equilibrium.● Decisions with one dominant strategyAn example of Pizza Castle and Pizza PalaceCastle’s price High($10)Low ($6) strategyWhen a firm does not have a dominant strategy, but at least one of its rivals does have adominant strategy,the firm’s manager can predict with confidence that its rivals willfollow their dominant strategies.Then,the manager can choose its own best strategy,knowing the actions that will almost certainly be taken by those rivals possessingdominant strategies.Knowing that Palace’s manager will rationally choose to set price low at$6,Castle’s manager will likely decided to price high at$10(and give away soft drinks).●Successive elimination of dominated strategies:When deciding what to do in a simultaneousdecision situation,managers should eliminate from consideration dominated strategies.Dominated strategies are strategies that would never be chosen because at least one other strategy provides a higher payoff no matter what rivals choose to do.Successive elimination of dominated strategies is an iterative decision-making process in which managers first eliminate all dominated strategies in the original payoff table.Eliminating dominated strategies always simplifies a decision-making problem.In a simultaneous decision having no dominant strategy equilibrium,managers can simplify their decisions by eliminating all dominated strategies that may exist.The process of elimination should be repeated until no more dominated strategies turn up.Strategically astute managers always search first for dominant strategies,and,if no dominant strategies can be discovered,they next look for dominated strategies.Unfortunately, simultaneous decision frequently fail to provide managers with either dominant or dominated strategies.●Nash equilibrium:Making mutually best decisions(will be introduced in OR)In the absence of any form of strategic dominance,managers must use a different,but related, guiding concept for making simultaneous decisions.This concept,known as Nash equilibrium, can sometimes,but not always,guide managers in making simultaneous decisions.In order for all firms in an oligopoly market to be predicting correctly each other’s decision,all firms must to be choosing individually best actions given the predictedactions of their rivals.It follows,then,that strategically astute managers will search thepayoff table for mutually best decisions:cells in the payoff table in which all managersare doing the best they can given their beliefs about the other managers’actions.Nash equilibrium is a set of actions for which all managers are choosing their bestPepsi’s budgetLow Medium High (Payoffs in millions of dollars of semiannual profit)actions given the actions chosen by their rivals.Strategic stability: Since all decisions are mutually best decisions in Nash equilibrium,no single firm can unilaterally make a different decision and do better. This property or condition of Nash equilibrium is known as strategic stability , and it provides thefundamental reason for believing that strategic decision makers will likely decide on a Nash pair of decisions.An example of Nash equilibrium: Super Bowl Advertising (P543-545)LowCoke’s budget MediumHigh Neither Pepsi nor Coke has a dominant strategy or dominated strategy. The only Nash equilibrium is (High , High).When managers face a simultaneous decision-making situation possessing a unique Nash equilibrium set of decisions, rivals can be expected to make the decisions leading to the Nash equilibrium. If there are multiple Nash equilibria, there is generally no way to predict the likely outcome.● Best-response curves and continuous decision choicesIn many decisions, actions or strategies are continuous decision variables. Whenmanagers make pricing decisions, they seldom view the choices as being either ”low” or “high” prices. In stead they choose the best price from a continuous range of prices. Best-response curves is a tool to analyze and explain simultaneous decisions when decision choices are continuous rather discrete. Best-response curves give managers the profit-maximizing price to set given the price they anticipate their rival will set.An example: P548-552. The following demand curves is common knowledge:Q A = 4000 - 25 p A + 12 p B , Q B = 3000 - 20 p B + 10 p AThus, p A = 160 - 0.04Q A + 0.48 p B , p B = 150 - 0.05Q B + 0.5 p AMR A = 160 - 0.08Q A + 0.48 p B , MR B = 150 - 0.1Q B + 0.5 p A,212=A p 218=B pLet MR A = MC A = 160 and MR B = MC B = 180 , then we have two best-response curves:p A = 160 + 0.24 p B , p B = 165 + 0.25 p AA Nash equilibrium occurs at the price pair where the firms’ best-response curves intersect:* * 14.3 Strategy when rivals make sequential decisions● Sequential decisions —decisions in which one firm makes its decision first, then a rival firmmakes its decision. Even though they are made at different times, sequential decisions involve strategic interdependence. Strategically astute managers must think ahead to anticipate their rival’s future decisions. Current decisions are based on what manager believes rivals will likely do in the future.● Making sequential decisions: we use game trees to analyze sequential decisions.A game tree is a diagram showing the structure and payoff of a sequential decisionsituation. It has decision nodes with branches extending from the nodes.✧ Decision nodes —points in a game tree, represented by boxes, where decisions aremade.✧ A game tree usually proceeds from left to right along branches until final payoffsassociated with each decision path are reached.(Figure 14.3: a game tree —Castle go first)Roll-back method (backward induction)—method of finding a Nash solution to asequential decision by looking ahead to future decisions to reason back to the best current decision. When firms making sequential decisions, managers make best decisions for themselves using roll-back method. The roll-back method results in a unique path that is a Nash decision path: each firm does the best for itself given the best decisions made by its rivals.● First-mover and second-mover advantageThe outcomes of some sequential decisions depend on which firm makes its decision first and which firm goes second.First-mover advantage —Sometimes a firm can increase its payoff by making itsdecision first.Second-mover advantage—Sometimes a firm can increase its payoff by letting its rivals make the decision first.How can we tell whether a sequential decision has a first-mover advantage or a second-mover advantage,or neither type of advantage?The simplest way,and frequently theonly way,is to find the roll-back solution for both sequences.If the payoff increases bybeing the first(second)to move,then a first-mover(second-mover)advantage exists.Ifthe payoffs are identical,then order of play confers no advantage.It is difficult to determine which firm goes first(second)when both firms recognize that going first(second)confers a first-mover(second-mover)advantage.●Strategic moves:commitments,threats,and promisesThere are three kinds of actions that firm might employ to alter the structure of a game to their advantage:commitments,threats,and promises.Commitments—Unconditional strategic moves taken for the purpose of increasing payoffs to the committing firm.Managers make commitments by announcing,ordemonstrating to rivals in some other way,that they will bind themselves to take aparticular action or make a specific decision no matter what action or decision istaken by its rivals.An example:P557Figure14.4.Motorola seizes the first–mover advantage an ensure its outcome in cell A by building a facility in Brazil specifically designed for manufacturing and serving only analog phones.Threats—Conditional strategic moves that take the form:”If you do A,I will do B, which is costly to you.”The purpose of making threats is to manipulate rivals’beliefsabout the likely behavior of the threatening firms in a way that increases payoffs to thethreatening firms.Promises—Conditional strategic moves that take the form:”If you do A,I will do B, which is desirable to you.”These three strategic moves must be made before rivals have made their decisions.They may be utilized separately or in combination with each other.Strategic moves will achieve their desired effects only if rivals think the firms making the moves will actually carry out their commitments, threats,or promises.Only credible strategic moves matter.Rivals will ignore strategic moves thatare not credible.14.4Strategic entry deterrence●Strategic entry deterrence:Managers of firms in oligopoly markets sometimes use differenttypes of strategic behavior to prevent new rival firms from competing with them.Strategic entry deterrence occurs when an established firm(or firms)makes strategic moves designed to discourage or even prevent the entry of a new firm or firms into a market.Limit pricing:Under certain circumstance an oligopolist,or possibly a monopolist,may charge a price lower than the short-run profit-maximizing price in order to prevent ordiscourage new firms from entering the market.Such a strategy is called entry limitpricing.In order to practice ertry limit pricing,an established firm must have a costadvantage over potential entrants into the market.Capacity expansion as a barrier to entry:Under certain circumstance,it is possible for an established firm to discourage the entry of new firms into the market without actuallydecreasing the price it charges and consequently finding its profits reduced.The firmcan maintain excess capacity,above the capacity it would normally build.The excesscapacity signals to potential entrants that the established firm is prepared to increase itsoutput by reducing its price if new firms prepare to enter the market.●Strategic entry deterrence differs somewhat from the structural barriers to entry discussed inChapter13.Those barriers block entry of new firms by altering a market’s underlying cost or revenue conditions so that a new firm cannot be profitable.Strategic entry deterrence is the result of actions taken by established firms to alter the beliefs potential entrants hold about the behavior of established firms—primarily pricing and output behavior—after they enter.。
- 1、下载文档前请自行甄别文档内容的完整性,平台不提供额外的编辑、内容补充、找答案等附加服务。
- 2、"仅部分预览"的文档,不可在线预览部分如存在完整性等问题,可反馈申请退款(可完整预览的文档不适用该条件!)。
- 3、如文档侵犯您的权益,请联系客服反馈,我们会尽快为您处理(人工客服工作时间:9:00-18:30)。
一、企业生产
生产投入
生产转换
产出
二、企业生产要素 1 劳动 2 土地 3 资本 4 企业家才能
三、生产函数
【生产函数】 表明在生产过程中,在一定 的技术条件下,各种投入要素组合所能产生的 最大产量。可表示为:
Q=f(X1,X2,X3,…) 1 短期生产函数:既有不变投入,又有固 定投入。
二、影响规模收益的因素
1 规模经济:促使规模收益递增的因素, 包括:内在经济与外在经济 (1)内在经济:工人的专业化生产、专门 化的设备和先进的技术、大设备的制造和 运转费用比小设备要低、生产要素的不可 分割性、其他因素。
(2)外在经济:行业规模扩大和产量增加 给个别厂商带来的利益,如:行业内部 的分工、专门化的辅助性服务、投资环 境的改善等等。
(1)当MP〉AP,AP必然上升; 当MP〈AP,AP必然下降; MP=AP,AP达到最大值。
(2)当MP〉0,TP必然上升; 当MP〈0,TP必然下降; MP=0,TP达到最大值。
二、边际实物递减法则
如果技术不变,增加生产要素中某个要素 的投入量,而其他要素的投入量不变,增加的 投入量起初会使该要素的边际产量增加,增加 到一定点之后,再增加投入量就会使边际产量 递减。
解:MP男=10件 P男=4元 MP男/ P男=2.5件
MP女=8件, P女=2元,MP女/ P女=4
所以,男工与女工的比例不是最优 的,应增加女工,减少男工。
例:假设等产量曲线的方程为:Q K a LB
其中K为资本数量,L为劳力数量,假定 K的价格为PK,L的价格为PL,求这两种 投入要素的最优组合比例。
注意两点:
1)其他生产要素的投入固定不变,只变动 一种生产要素的投入;
2)技术水平保持不变。
三、生产三阶段
Q TP
Ⅰ Q
MP
Ⅱ
Ⅲ
L
AP
L1 L2
L
四、单一可变投入要素最优投入量的确定 1 边际产量收入:增加一个可变投入要素所 增加的收入 MRPy=ΔTR/Δy =ΔTR/ΔQ•ΔQ/ΔY =MR •MPY 2 边际支出:增加一个可变投入要素所增加 的总成本ME:MEy= ΔTC/Δy 3 单一可变投入要素最优投入量
2 长期生产函数 :只有不变投入。 3 不同的生产函数形式代表不同的技术水平
第一节单一可变投入要素的最优利用
一、总产量、平均产量和边际产量的相互关系
1.总产量:一定投入要素下所能生产的全部产
量。
TP=Q=f(L)
2.平均产量 AP=TP/L
平均产量等于总产量曲线上各点到原点连接 线的斜率
3.边际产量 MP=ΔTP/ΔL=dTP/dL
ΔY·MPY=ΔX·MPX
MRTS=MPX/MPY
( 2 )边际技术替代率递减法则 在保持产量不变的情况下,随着X的增加,
增加1单位X所能替代的Y的数量越来越少 (3)等产量线凸向原点
二、等成本线及其性质:
E代表总成本,PY代表资本价格, PX代表劳动的价格,则:
E=PX·X+PY·Y
Y
Y=E/PY-PX/PY·X
3 促使规模收益不变的因素:促使规模收益 递增的因素不再起作用,规模经济因素与 规模不经济因素相互抵消。
4 最优规模:处于规模经济不变的规模
第二节 多种投入要素的最优组合
一、等产量线 的性质和类型
〖等产量线〗
K
1)性质:处于较高
K1
位置的等 产量线总是
K2
代表较大的产量.
L1 L2 L
2)等产量线的三种类型:完全可以替代、完 全Βιβλιοθήκη 能替代、不完全替代YY
投入要素 X 完全替代
投入要素
X
完全不替代
3)边际技术替代 (1)边际技术替代
MRTS=-(Y2-Y1)/(X2-X1) =-ΔY/ΔX=-dY/dX
X
三、最优投入要素组合的确定 1 图解法 1) 在一定的成本下产量最大的投入组合 2) 在一定的产量下成本最小的投入组合
K
K
L
L
最优投入要素组合的条件
MPX = MPY
PX
PY
例 某车间男工和女工各占一半,男工和 女工可互相替代。假定男工每增加一人可 增加产量10件,女工增加一人可增加产量 8件。男工工资为每人4元,女工工资每人 2元。问男工女工组合比例是否最优,如 果不是,应怎样变动?
L
五、生产扩大路线
【生产扩大路线】在投入要素价格不变时, 随着生产规模的扩大,投入要素最优组合比例 发生变化的轨迹。
K Q2
长期扩张线
K2
K1
Q1
L1
短期扩大路线
L2
L
第三节 规模与收益的关系
一、 规模收益的三种类型
Q=f(L,K,D,…) bQ=f(aL,aK,aD,…)
(1) b 〉a, 规模收益递增 (2) b = a ,规模收益不变 (3) b〈 a ,规模收益递减
解:先求两种投入要素的边际产量:
MPL
(K a Lb ) K
K abLb1
MPK
(K L a b ) L
Lb aK a1
MPL MPK
PL
PK
K bL a b1 Lb aK a1
pL
PK
bK aL PL PK
K aPL L bPK
四、价格变动对投入要素最优组合的影响
K
KB
B A
KA
LB LA
2 规模不经济:促使规模收益递减的因 素,包括内在不经济与外在不经济
(1)内在不经济:导致规模收益递减的 内部因素主要是管理问题,规模过大, 层次过多而使管理效率降低,官僚主义 产生,内部通讯费用增加等等。
(2)外部不经济:行业扩大加剧行业内部 的竞争,广告费、宣传费增加,同时, 引起资源紧张,价格上涨,环境污染, 使规模收益递减。
边际产量等于总产量曲线上各点切线的斜率。
工人人数 0 1 2 3 4 5 6 7
总产量 0 13 30 60 104 134 156 168
平均产量 0 13 15 20 26 26.8 26 24
边际产量 13 17 30 44 30 22 12 8
Q
Q
AP
TP
L
MP
L
4 总产量、平均产量与边际产量之间的 关系:
MRPy=MEy
例:工人人数与产量之间的关系如下:
Q 98L 3L2
假定产品的单价20元,工人每天的工资 均为40元,而且工人是唯一可变的投入要素, 问为谋求利润最大,每天应雇佣多少工人? 解: MPL=dQ/dL=98-6L
MRPL=MR·MPL=20×(98-6L) MEL=40
20×(98-6L)=40 L=16