Asymptote作图指南
SAS作图详细教程11

BLACK RED GREEN BLUE YELLOW CYAN MAGENTA PINK ORANGE BROWN GREY
黑色(缺省方式) 红色 绿色 蓝色 黄色 青色 洋红 粉红 橙色 棕色 灰色
HEIGHT | H = n<单位>:设置图中点的大小。
CELL
单元,SAS默认单位
CM
厘米
PCT
轴或纵坐标轴。
例6:对于例1中的数据集,绘制如下连线图:
goptions reset=all; symbol1 v=triangle h=1.5 i=join c=green w=2 ; title c=blue 'New York Suspended Particle Average'; title2 c=blue h=1.2 '2002'; axis1 label=(f=complex c=blue h=3pct) c=magenta width=3
3.4 PLOT语句中的选项
PLOT 语句的一般形式: PLOT 纵坐标变量*横坐标变量 / 选项;
选项 :
FRAME | NOFRAME:设置图中是否显示边框。 AUTOHREF | AUTOVREF:自动在图中添加经过主刻度的
水平/垂直参考线。 NOAXIS:取消坐标轴以及与坐标轴相关的图形元素。 CAXIS = 颜色:设置坐标轴的颜色。 CTEXT = 颜色:设置坐标轴旁字符的颜色。 HAXIS | VAXIS = AXIS<n> | 值列举:设置图中的横坐标
1)设置点
VALUE | V = 符号:设置图中点的表示符号
符号名称 PLUS X STAR SQUARE DIAMOND
符号表示
pegas Haplotype Networks绘图工具用户指南说明书

Plotting Haplotype Networks with pegas Emmanuel ParadisDecember13,2023Contents1Introduction1 2The Function plot.haploNet12.1Node Layout (2)2.2Options (5)3New Features in pegas1.0103.1Improved`Replotting' (10)3.2Haplotype Symbol Shapes (11)3.3The Function mutations (13)3.4Getting and Setting Options (15)1IntroductionHaplotype networks are powerful tools to explore the relationships among individuals char-acterised with genotypic or sequence data[3,5].pegas has had tools to infer and plot haplotype networks since its rst version(0.1,released in May2009).These tools have im-proved over the years and are appreciated in the community working on population genetics and genomics(see John Bhorne's blog1).This document covers some aspects of drawing haplotype networks with pegas with an emphasis on recent improvements.Not all details and options are covered here:see the respective help pages(?plot.haploNet and?mutations)for full details.The function plotNetMDS,which o ers an alternative approach to plotting networks,is not considered in this document.2The Function plot.haploNetThe current version of pegas includes ve methods to reconstruct haplotype networks as listed in the table below.Method Acronym Input data Function Ref.Parsimony network TCS distances haploNet[6]Minimum spanning tree MST"mst[4]Minimum spanning network MSN"msn[1]Randomized minimum spanning tree RMST"rmst[5]Median-joining network MJN sequences mjn[1]1https:///2016/09/15/still-making-haplotype-networks-the-old-way-how-to-do-it-in-r/All these functions output an object of class"haploNet"so that they are plotted with the same plot method(plot.haploNet).2.1Node LayoutThe coordinates of the nodes(or vertices)representing the haplotypes are computed in two steps: rst,an equal-angle algorithm borrowed from Felsenstein[2]is used;second,the spacing between nodes is optimised.The second step is ignored if the option fast=TRUE is used when calling plot.These two steps are detailed a bit in the next paragraphs.In the rst step,the haplotype with the largest number of links is placed at the centre of the plot(i.e.,its coordinates are x=y=0),then the haplotypes connected to this rst haplotype are arranged around it and given equal angles.This is then applied recursively until all haplotypes are plotted.To perform this layout,an initial`backbone'network based on an MST is used,so there is no reticulation and the equal-angle algorithm makes sure that there is no segment-crossing.In practice,it is likely that this backbone MST is arbitrary with respect to the rest of the network.The other segments are then drawn on this MST.In the second step,a`global energy'is calculated based on the spaces between the nodes of the network(closer nodes imply higher energies).The nodes are then moved repeatedly, while keeping the initial structure of the backbone MST,until the global energy is not improved(decreased).We illustrate the procedure with the woodmouse data,a set of sequences of cytochrome b from15woodmice(Apodemus sylvaticus):>library(pegas)#loads also ape>data(woodmouse)In order,to simulate some population genetic data,we sample,with replacement,80se-quences,and create two hierarchical groupings:region with two levels each containing40 haplotypes,and pop with four levels each containing20haplotypes:>set.seed(10)>x<-woodmouse[sample.int(nrow(woodmouse),80,TRUE),]>region<-rep(c("regA","regB"),each=40)>pop<-rep(paste0("pop",1:4),each=20)>table(region,pop)popregion pop1pop2pop3pop4regA202000regB002020We extract the haplotypes which are used to reconstruct the RMST after computing the pairwise Hamming distances:>h<-haplotype(x)>hHaplotypes extracted from:xNumber of haplotypes:15Sequence length:965Haplotype labels and frequencies:I II III IV V VI VII VIII IX X XI XII XIII XIV XV569377463776352>d<-dist.dna(h,"N")>nt<-rmst(d,quiet=TRUE)>ntHaplotype network with:15haplotypes22linkslink lengths between7and7step(s)Use print.default()to display all elements. We now plot the network with the default arguments: plot(nt)>We compare the layout obtained with fast=TRUE: >plot(nt,fast=TRUE)By default,not all links are drawn.This is controlled with the option threshold which takes two values in order to set the lower and upper bounds of the number of mutations for a link to be drawn:>plot(nt,threshold=c(1,14))The visual aspect of the links is arbitrary:the links of the backbone MST are shown with continuous segments,while alternative links are shown with dashed segments.2.2Optionsplot.haploNet has a relatively large number of options:>args(pegas:::plot.haploNet)function(x,size=1,col,bg,col.link,lwd,lty,shape="circles", pie=NULL,labels,font,cex,b,scale.ratio,asp=1,legend=FALSE,fast=FALSE,show.mutation,threshold=c(1,2),xy=NULL,...)NULLLike for most plot methods,the rst argument(x)is the object to be plotted.Until pegas0.14,all other arguments were de ned with default values.In recent versions,as shown above,only size and shape are de ned with default values;the other options,if not modi ed in the call to plot,are taken from a set of parameters which can be modi ed as explained in Section3.4.The motivation for this new function de nition is that in most cases users need to modifysize and shape with their own data,such as haplotype frequencies or else,and these might be changed repeatedly(e.g.,with di erent data sets or subsets).On the other hand,the other options are more likely to be used to modify the visual aspect of the graph,so it could be more useful to change them once during a session as explained later in this document.The size of the haplotype symbols can be used to display haplotype frequencies.The function summary can extract these frequencies from the"haplotype"object:>(sz<-summary(h))I II III IV V VI VII VIII IX X XI XII XIII XIV XV569377463776352It is likely that these values are not ordered in the same way than haplotypes are ordered in the network:>(bs<-attr(nt,"labels")) [1]"I""II""III""IV""V""VI""VII""VIII""IX""X" [11]"XI""XII""XIII""XIV""XV"It is simple to reorder the frequencies before using them into plot:>sz<-sz[bs]>plot(nt,size=sz)A similar mechanism can be used to show variables such as region or pop.The function haploFreq is useful here because it computes the frequencies of haplotypes for each region or population:>(R<-haploFreq(x,fac=region,haplo=h))regA regBI23II24III54IV21V61VI43VII31VIII42IX12X34XI43XII15XIII21XIV14XV02>(P<-haploFreq(x,fac=pop,haplo=h))pop1pop2pop3pop4I1130II1113III3231IV1110V3301VI3112VII1210VIII4011IX1011X1231XI1312XII0123XIII0201XIV0113XV0011Like with size,we have to reorder these matrices so that their rows are in the same order than in the network:>R<-R[bs,]>P<-P[bs,]We may now plot the network with either information on haplotype frequencies by just changing the argument pie:>plot(nt,size=sz,pie=R,legend=c(-25,30))259regA>plot(nt,size=sz,pie=P,legend=c(-25,30))259pop1The option legend can be:FALSE (the default):no legend is shown;TRUE :the user is asked to click where the legend should be printed;a vector of two values with the coordinates where the print the legend (for non-interactive use like in this vignette).3New Features in pegas 1.0This section details some of the improvements made to haplotype network drawing afterpegas 0.14.3.1Improved `Replotting'The graphical display of networks is a notoriously di cult problem,especially when there is an unde ned number of links (or edges).The occurrence of reticulations makes line crossings almost inevitable.The packages igraph and network have algorithms to optimise the layouts of nodes and edges when plotting such networks.The function replot(introduced in pegas0.7,March2015)lets the user modify the layout of nodes interactively by clicking on the graphical window where a network has been plotted beforehand.replot which cannot be used in this non-interactive vignette has been improved substantially:The explanations printed when the function is called are more detailed and the node to be moved is visually identi ed after clicking.The nal coordinates,for instance saved with xy<-replot(),can be used directly into plot(nt,xy=xy).This also makes possible to input coordinates calculated with another software.In previous versions,the limits of the plot tended to drift when increasing the number of node moves.This has been xed,and the network is correctly displayed whatever the number of moves done.3.2Haplotype Symbol ShapesHaplotypes can be represented with three di erent shapes:circles,squares,or diamonds. The argument shape of plot.haploNet is used in the same way than size as explained above(including the evental need to reorder the values).Some details are given below about how these symbols are scaled.There are two ways to display a quantitative variable using the size of a circle:either with its radius(r)or with the area of the disc de ned by the circle.This area isπr2,so if we want the area of the symbols to be proportional to size,we should square-root these last values.However,in practice this masks variation if most values in size are not very di erent(see below).In pegas,the diameters of the circles(2r)are equal to the values given by size.If these are very heterogeneous,they could be transformed with size= sqrt(....keeping in mind that the legend will be relative to this new scale.The next gure shows both ways of scaling the size of the circles:the top one is the scaling used in pegas.>par(xpd=TRUE)>size<-c(1,3,5,10)>x<-c(0,5,10,20)>plot(0,0,type="n",xlim=c(-2,30),asp=1,bty="n",ann=FALSE)>other.args<-list(y=-5,inches=FALSE,add=TRUE,+bg=rgb(1,1,0,.3))>o<-mapply(symbols,x=x,circles=sqrt(size/pi),+MoreArgs=other.args)>other.args$y<-5>o<-mapply(symbols,x=x,circles=size/2,+MoreArgs=other.args)>text(x,-1,paste("size=",size),font=2,col="blue")>text(30,-5,expression("circles="*sqrt(size/pi)))>text(30,5,"circles=size/2")051015202530−15−10−551015size = 1size = 3size = 5size = 10circles = size πcircles = size / 2For squares and diamonds (shape ="s"and shape ="d",respectively),they are scaled so that their areas are equal to the disc areas for the same values given to size .The gure below shows these three symbol shapes superposed for several values of this parameter.Note that a diamond is a square rotated 45°around its center.>x <-c(0,6,13,25)>plot(0,0,type="n",xlim=c(-2,30),asp=1,bty="n",ann=FALSE)>other.args$y <-0>o <-mapply(symbols,x =x,circles =size/2,MoreArgs =other.args)>other.args$col <-"black">other.args$add <-other.args$inches <-NULL>o <-mapply(pegas:::square,x =x,size =size,MoreArgs =other.args)>o <-mapply(pegas:::diamond,x =x,size =size,MoreArgs =other.args)>text(x,-7,paste("size =",size),font =2,col ="blue")051015202530−15−10−5051015size = 1size = 3size = 53.3The Function mutationsmutations()is a low-level plotting function which displays information about the mutations related to a particular link of the network.This function can be used interactively.For instance,the following is copied from an interactive R session:>mutations(nt)Link is missing:select one below 1:VII-I 2:VII-VIII 3:V-XI 4:III-VI 5:IX-X 6:IX-II 7:III-IX 8:VII-III 9:XV-V10:XIII-IX 11:IX-V 12:IX-XII13:III-XIV14:III-IV15:IX-XI16:XV-XI17:IX-IV18:I-VIII19:I-III20:XIV-IV21:II-XI22:II-VEnter a link number:18Coordinates are missing:click where you want to place the annotations: The coordinates x=-8.880335,y=16.313are usedThe values entered interactively can be written in a script to reproduce the gure:>plot(nt)>mutations(nt,18,x=-8.9,y=16.3,data=h)Like any low-level plotting function,mutations()can be called as many times as neededto display similar information on other links.The option style takes the value"table" (the default)or"sequence".In the second,the positions of the mutations are drawn on a horizontal segment representing the sequence:>plot(nt)>mutations(nt,18,x=-8.9,y=16.3,data=h)>mutations(nt,18,x=10,y=17,data=h,style="s")The visual aspect of these annotations is controlled by parameters as explained in the next section.3.4Getting and Setting OptionsThe new version of pegas has two ways to change some of the parameters of the plot: either by changing the appropriate option(s)in one of the above functions,or by set-ting these values with the function setHaploNetOptions,in which case all subsequent plots will be a ected.2The list of the option values currently in use can be printed with getHaploNetOptions.There is a relatively large number of options that a ect ei-ther plot.haploNet()or mutations().Their names are quite explicit so that the user 2See?par for a similar mechanism with basic R graphical functions.should nd which one(s)to modify easily:>names(getHaploNetOptions())[1]"labels""labels.cex"[3]"labels.font""labels.color"[5]"link.color""link.type"[7]"link.type.alt""link.width"[9]"link.width.alt""haplotype.inner.color" [11]"haplotype.outer.color""mutations.cex"[13]"mutations.font""mutations.frame.background" [15]"mutations.frame.border""mutations.text.color" [17]"mutations.arrow.color""mutations.arrow.type" [19]"mutations.sequence.color""mutations.sequence.end" [21]"mutations.sequence.length""mutations.sequence.width" [23]"pie.inner.segments.color""pie.colors.function"[25]"scale.ratio""show.mutation"We see here several examples with the command plot(nt,size=2)which is repeated after calling setHaploNetOptions:>plot(nt,size=2)>setHaploNetOptions(haplotype.inner.color="#CCCC4D", +haplotype.outer.color="#CCCC4D", +show.mutation=3,labels=FALSE)>plot(nt,size=2)>setHaploNetOptions(haplotype.inner.color="blue", +haplotype.outer.color="blue", +show.mutation=1)>par(bg="yellow3")>plot(nt,size=2)>setHaploNetOptions(haplotype.inner.color="navy", +haplotype.outer.color="navy") >par(bg="lightblue")>plot(nt,size=2)References[1]H.J.Bandelt,P.Forster,and A.Röhl.Median-joining networks for inferring intraspeci cphylogenies.Molecular Biology and Evolution,16(1):37 48,1999.[2]J.Felsenstein.Inferring Phylogenies.Sinauer Associates,Sunderland,MA,2004.[3]D.H.Huson and D.Bryant.Application of phylogenetic networks in evolutionary studies.Molecular Biology and Evolution,23(2):254 267,2006.[4]J.B.Kruskal,Jr.On the shortest spanning subtree of a graph and the traveling salesmanproblem.Proceedings of the American Mathematical Society,7(1):48 50,1956.[5]E.Paradis.Analysis of haplotype networks:the randomized minimum spanning treemethod.Methods in Ecology and Evolution,9(5):1308 1317,2018.[6]A.R.Templeton,K.A.Crandall,and C.F.Sing.A cladistic analysis of phenotypicassociation with haplotypes inferred from restriction endonuclease mapping and DNAsequence data.III.Cladogram estimation.Genetics,132:619 635,1992.。
photoshop中图片扭曲教程

photoshop中图片扭曲教程photoshop中图片扭曲教程Distort(扭曲)滤镜通过对图像应用扭曲变形实现各种效果。
1、Wave(波浪滤镜)作用:使图像产生波浪扭曲效果。
调节参数:生成器数:控制产生波的数量,范围是1到999、波长:其最大值与最小值决定相邻波峰之间的距离,两值相互制约,最大值必须大于或等于最小值。
波幅:其最大值与最小值决定波的高度,两值相互制约,最大值必须大于或等于最小值。
比例:控制图像在水平或垂直方向上的变形程度。
类型:有三种类型可供选择,分别是正弦,三角形和正方形。
随机化:每单击一下此按钮都可以为波浪指定一种随机效果。
折回:将变形后超出图像边缘的部分反卷到图像的对边。
重复边缘像素:将图像中因为弯曲变形超出图像的部分分布到图像的边界上。
图解效果:原图像正弦模式三角形模式正方形模式2、Ripple(波纹滤镜)作用:可以使图像产生类似水波纹的.效果。
调节参数:数量:控制波纹的变形幅度,范围是-999%到999%。
大小:有大,中和小三种波纹可供选择。
图解效果:原图像小波纹效果中波纹效果大波纹效果3、Glass(玻璃滤镜)作用:使图像看上去如同隔着玻璃观看一样,此滤镜不能应用于CMYK和Lab模式的图像。
调节参数:扭曲度:控制图像的扭曲程度,范围是0到20。
平滑度:平滑图像的扭曲效果,范围四1到15、纹理:可以指定纹理效果,可以选择现成的结霜,块,画布和小镜头纹理,也可以载入别的纹理。
缩放:控制纹理的缩放比例。
反相:使图像的暗区和亮区相互转换。
图解效果:原图像块纹理效果画布纹理效果结霜纹理效果小镜头纹理效果4、Ocean Ripple(海洋波纹滤镜)作用:使图像产生普通的海洋波纹效果,此滤镜不能应用于CMYK和Lab模式的图像。
调节参数:波纹大小:调节波纹的尺寸。
波纹幅度:控制波纹振动的幅度。
图解效果:原图像海洋波纹效果下载全文。
例谈二次曲线渐近线的几种求法

目录摘要 (1)关键词 (1)Abstract (1)Keywords (1)1 引言 (1)2 求二次曲线渐近线的几种方法 (2)2.1 欧氏定义法 (3)2.2 极线法 (3)2.3 自共轭直径法 (5)2.4 中心法 (6)2.5 不变量法 (7)参考文献: (9)致谢................................................................................................ 错误!未定义书签。
例谈二次曲线渐近线的几种求法摘要:本文从二次曲线渐近线的欧式定义和射影定义出发,阐述了二次曲线渐近的两种定义虽然在形式上有所不同,但两种定义是一致的,并且结合实例总结出了求解二次曲线渐近线方程的五种方法,从而从不同的角度来理解二次曲线渐近线本质特征,并且通过对这些实例的解答,对这些方法在解题时的优缺点进行了小结.同时用射影的观点阐明了二次曲线渐近线的本质特征,加强了射影几何中常用无穷远点、极点、极线的直观理解,从而感受高等几何对初等几何的指导作用.关键词:二次曲线;渐近线;射影Asymptotic line of the second curve Few SolutionsAbstract:This article from the conic ou definition and projective relation, expounds the definition of conic asymptotic of two kinds of different in formally defined though, but the two definition is consistent, and examples for solving quadratic curves summarized relation, and five methods from different view of quadratic curves, and relation nature of these examples by the answer of these methods in when the problem solving the advantages and disadvantages of summary. Meanwhile allusive view illustrates with the essential characteristics of conic relation, strengthen the projective geometry infinity points, commonly used in the poles, extremely line, thus verstehende feel higher geometry to elementary geometry guidance.Keywords:conic; asymptote; projective1 引言二次曲线的渐近线是研究二次曲线性质和作图时常用的重要曲线,用初等的方法求解一般二次曲线的渐近线,不但求解方法繁杂,而且对渐近线与二次曲线位置关系的理解仅局限于表面。
asymptote用法

asymptote用法
asymptote是一个强大的矢量图形语言和绘图工具,主要用于生成高质量的技术图形、三维图形和动画。
它类似于TikZ和PGFPlots,但更加强大和灵活。
asymptote的用法可以从以下几个方面来介绍:
1. 绘制基本图形,asymptote可以用来绘制各种基本的几何图形,包括直线、圆、椭圆、曲线等。
通过简单的命令和参数设置,可以轻松地绘制出所需的图形。
2. 三维图形,asymptote支持绘制高质量的三维图形,包括曲面、立体图形和复杂的几何体。
用户可以通过指定坐标和参数来创建各种复杂的三维图形。
3. 技术图形,asymptote广泛应用于科学和工程领域,可以用来绘制各种技术图形,如函数图像、数据图表、流程图等。
它提供了丰富的绘图命令和选项,可以满足不同领域的绘图需求。
4. 动画,asymptote还支持生成动画,用户可以通过设定时间参数和动画效果来创建各种动态图形,用于展示变化过程和模拟效
果。
总的来说,asymptote是一个功能强大、灵活多样的绘图工具,可以满足各种绘图需求。
通过学习其详细的语法和用法,用户可以
轻松地创建出精美的技术图形和动态图形。
希望以上内容能够全面
地介绍asymptote的用法。
微积分双语常用词汇
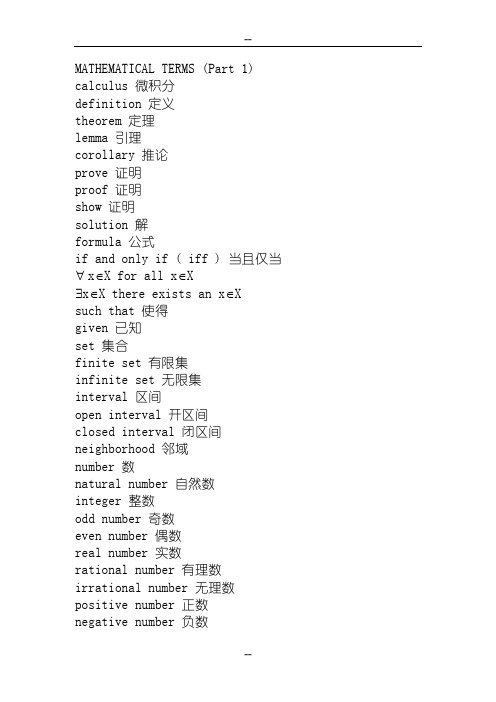
MATHEMATICAL TERMS (Part 1) calculus 微积分definition 定义theorem 定理lemma 引理corollary 推论prove 证明proof 证明show 证明solution 解formula 公式if and only if ( iff ) 当且仅当∀ x∈X for all x∈X∃x∈X there exists an x∈Xsuch that 使得given 已知set 集合finite set 有限集infinite set 无限集interval 区间open interval 开区间closed interval 闭区间neighborhood 邻域number 数natural number 自然数integer 整数odd number 奇数even number 偶数real number 实数rational number 有理数irrational number 无理数positive number 正数negative number 负数mapping 映射function 函数monotone function 单调函数increasing function 增函数decreasing function 减函数bounded function 有界函数odd function 奇函数even function 偶函数periodic function 周期函数composite function 复合函数inverse function 反函数domain 定义域range 值域variable 变量independent variable 自变量dependent variable 因变量sequence 数列convergent sequence 收敛数列divergent sequence 发散数列bounded sequence 有界数列decreasing sequence 递减数列increasing sequence 递增数列limit 极限one-sided limit 单侧极限left-hand limit 左极限right-hand limit 右极限The Squeeze Theorem 夹挤定理infinity 无穷大infinitesimal 无穷小equivalent infinitesimal 等价无穷小infinitesimal of higher order 高阶无穷小order of infinitesimal 无穷小的阶infinitesimals of the same order 同阶无穷小increment 增量continuous function 连续函数continuity 连续性f(x) is continuous at x 在x 连续f(x) is discontinuous at x 在x 间断discontinuity 间断点discontinuity of the first (second) kind 第一(二)类间断点removable discontinuity 可去间断点jump discontinuity 跳跃间断点infinite discontinuity 无穷间断点intermediate value 介值The Intermediate Value Theorem 介值定理zero point 零点The Zero Point Theorem 零点定理root 根equation 方程uniform continuity 一致连续derivative 导数rate of change 变化率velocity 速度instantaneous velocity 瞬时速度tangent (line) 切线normal (line) 法线slope 斜率left-hand derivative 左导数right-hand derivative 右导数f(x) is differentiable at x f(x) 在x 处可导(可微) differentiation 求导The Chain Rule 链式法则differentiation formulas 求导公式implicit function 隐函数explicit function 显函数implicit differentiation 隐函数求导logarithm 对数Logarithmic differentiation 对数求导法parameter 参数parametric equation 参数方程parametric curve 参数曲线hyperbolic function 双曲函数hyperbolic sine 双曲正弦hyperbolic cosine 双曲余弦hyperbolic tangent 双曲正切hyperbolic cotangent 双曲余切MATHEMATICAL TERMS (Part 2)differential 微分differential quotient 微商approximate value 近似值error 误差relative error 相对误差absolute error 绝对误差invariance of differential form 微分形式不变性higher derivative 高阶导数first derivative 一阶导数second derivative 二阶导数third derivative 三阶导数nth derivative n 阶导数twice differentiable 二阶可导acceleration 加速度mean value 中值The Mean Value Theorem 中值定理Rolle’s Theorem 罗尔定理Lagrange’s Mean Value Theorem 拉格朗日中值定理Cauchy’s Mean Value Theorem 柯西中值定理equality 等式inequality 不等式indeterminate form 不定型 (未定式)indeterminate form of type 00 ( ∞∞ ) 00 ( ∞∞ )型未定式L’Hospital’s Rule 洛必达法则Taylor’s formula 泰勒公式polynomial 多项式nth-degree polynomial n 次多项式remaind 余项Lagrange’s form of remainder 拉格朗日型余项Peano’s form of remainder 皮亚诺型余项Maclaurin formula 麦克劳林公式Taylor polynomial 泰勒多项式Mauclaurin polynomial 麦克劳林多项式polynomial approximation 多项式逼近accuracy 精确度margin 边际marginal cost 边际成本marginal revenue 边际收益elasticity 弹性density 密度mass 质量extreme value 极值local maximum value 极大值local minimum value 极小值(absolute) maximum 最大值(absolute) minimum 最小值stationary point 驻点(稳定点)critical point 临界点The First (Second) Derivative Test (极值的)一(二)阶判别法convex 凸的convex curve 凸曲线concave 凹的concave curve 凹曲线convex function 凸函数point of inflection 拐点asymptote 渐近线horizontal asymptote 水平渐近线vertical asymptote 垂直渐近线slant asymptote 斜渐近线curve sketching 作图sketch a curve 作图curvature 曲率The bisection method 二分法The secant method 弦位法Newton’s method 牛顿(切线)法The tangent method 切线法differential calculus 微分学integral 积分integral calculus 积分学definite integral 定积分indefinite integral 不定积分partition 分割Riemann sum 黎曼和integral sign 积分符号integrand 被积函数upper (lower) limit of integration 积分上(下)限integration 积分(求积)integrable 可积的f(x) is integrable on [a, b]integrable function 可积函数integrability 可积性sufficient condition 充分条件necessary condition 必要条件piecewise continuous 分段连续property 性质The mean value theorem of integral 积分中值定理The fundamental theorem of calculus 微积分基本定理Newton-Leibniz formulaprimitive function (anti-derivative) 原函数(反导数)The substitution rule for integration 换元积分法The inverse of the chain rule 反链式法(凑微分法)integration by parts 分部积分法rational function 有理函数fraction 分式irreducible fraction 最简分式partial fraction 部分分式partial fraction decomposition 部分分式分解MATHEMATICAL TERMS (Part 3)vector 矢量free vector 自由矢量zero vector 零矢量magnitude of a vector 矢量的模unit vector 单位矢量scalar product 数量积dot product 点积vector product 矢量积cross product 叉积a is perpendicular (orthogonal) tob a 与b 垂直coordinate 坐标coordinate system 坐标系coordinate axis 坐标轴x-axis x 轴coordinate plane 坐标面direction angle 方向角direction cosine 方向余弦rectangular coordinate system 直角坐标系octant 卦限the first octant 第一卦限variable 变量function of two (three) variables 二(三)元函数function of several variables 多元函数independent variable 自变量dependent variable 因变量domain 定义域range 值域set of points 点集neighborhood 邻域interior point 内点boundary point 边界点bound 边界open set 开集closed set 闭集connected set 连通集region 区域open region 开区域closed region 闭区域bounded region 有界区域unbounded region 无界区域cluster point 聚点double limit 二重极限iterated limit 累次极限continuity 连续性increment 增量total increment 全增量partial increment 偏增量partial derivative 偏导数partial derivative of f(x,y) with respect to x ( y ) f(x,y)关于x(y)的偏导数higher partial derivative 高阶偏导数mixed partial derivative 混合偏导数Laplace equation 拉普拉斯方程total differential 全微分differentiable 可微chain rule 链式法则implicit function 隐函数implicit differentiation 隐函数微分法Jacobian determinant 雅可比行列式curve 曲线space curve 空间曲线tangent vector 切矢tangent line 切线normal plane 法平面surface 曲面normal vector 法矢normal line 法线tangent plane 切平面sphere 球面cylinder 柱面cone 锥面directional derivative 方向导数gradient 梯度gradient vector 梯度矢量f delflevel curve 等值线level surface 等值面local extremum 极值local maximum 极大值local minimum 极小值extreme value 最值absolute maximum (minimum) 最大(最小)值stationary point (critical point) 驻点(临界点)conditional extremum 条件极值Lagrange multiplier 拉格朗日乘数method of Lagrange multiplier 拉格朗日乘数法objective function 目标函数constraint 约束条件method of least square 最小二乘法field 场scalar field 数量场vector field 矢量场gradient field 梯度场potential field 势场potential function 势函数conservative field 保守场gravitational field 引力场force field 力场velocity field 速度场MATHEMATICAL TERMS (Part 4)multiple integral 重积分double integral 二重积分iterated integral 累次积分region 区域region of integration 积分区域type X (Y) region X(Y)型区域order of integration 积分秩序reverse the order of integration 交换积分秩序polar coordinates 极坐标double integrals in polar coordinates 极坐标下的二重积分volume 体积lamina 平面薄片mass 质量density 密度moment about x-axis 关于x 轴的(静)力矩center of mass 重心moment of inertia 转动惯量surface 曲面area of a surface 曲面的面积triple integral 三重积分rectangle 矩形rectangular coordinates 直角坐标系cylinder 柱面cylindrical coordinates 柱面坐标系sphere 球面spherical coordinates 球面坐标系change of variables in multiple integrals 重积分的变量替换Jacobian determinant 雅可比行列式line integral 曲线积分line integral with respect to arc length 对弧长的曲线积分(第一型)line integral with respect to x ( y ) 对坐标x(y)曲线积分(第二型)line integral of a vector field 向量场的曲线积分smooth curve 光滑曲线piecewise smooth curve 逐段光滑曲线oriented curve 有向曲线orientation of a curve 曲线的方向work 功the line integral is independent of path 曲线积分与路径无关connected region 连通区域simply-connected region 单连通区域closed curve 闭曲线Green’s theorem 格林定理(公式)positive orientation of a curve 曲线的正向Fundamental theorem for line integrals 曲线积分的基本定理surface integral 曲面积分surface integral of a scalar field 数量场的曲面积分(第一型)surface integral of a vector field 向量场的曲面积分(第二型)orientable surface 可定向曲面oriented surface 有向曲面Möbius strip 莫比乌斯带Klein bottle 克莱因瓶one-sided surface 单侧曲面two-sided surface 双侧曲面closed surface 闭曲面flux 流量、通量electric flux 电通量divergence 散度rotation (curl) 旋度Gauss’ theorem 高斯定理(公式)The divergence theorem 散度定理(公式)Stokes’ theorem 斯托克斯定理(公式)curl theorem 旋度定理(公式)circulation of v around L v 沿L 的环流量Hamilton operator 哈密顿算子harmonic field 调和场。
Amos使用技巧作图篇

Amos画出的图像往往并不符合要求,框框太大,变量之间的距离太远,太占空间。
以下是调整技巧:1. 打开Amos的AG(Amos Graphics)程序准备画图。
在窗口的左侧会看到如下的三列图标,这些图标在各个对应的菜单中(如File,Edit等)也能找到。
2. 画板长宽调整:点击View-Interface Properties-Landscape-Apply即可,程序默认的是立着的长方形画板。
3. 画潜变量和测量变量:点击,然后在画板上点击一次出现一个椭圆,在连续点击,就会给椭圆加上相应的测量变量和残差变量框框。
4. 点击可以将途中的测量变量的位置上下左右地移动。
5. 点击可以把图中固定路径的位置改变,可以放在第一个或者最后一个。
6.点击,然后拖动椭圆,可以将椭圆调整到合适的大小。
7.点击和,可以将测量变量和残差变量移向椭圆,改变他们之间箭头的长度。
如果仅仅点击,只能调整某一个路径和图形。
8.点击和可以同时调整所有测量变量框的大小,以及残差变量框的大小。
9.点击和,上下或者左右拖动测量变量框,可以改变各个变量框之间的距离。
10.点击左边的,可以逐个选择目标,点击中间的一次选择全部图形,点击右边的放开所有选中的图形。
有时候只需要选中部分图形,点击左边图标之后,可以单击鼠标左键逐个选中,也可以按住鼠标左键,让鼠标箭头在要选中的图形上滑动即可。
11.如果不满意,点,叉掉便是。
12. 点击之后,在点击途中的任何变量框,可以对其进行命名。
一般多用于潜变量的命名或因变量残差的命名。
13.导入数据,点击,然后点击File Names,选中文件之后,点击OK。
如果要看看数据文件,点View Data。
14.然后点击,刚才打开的文件中的所有变量名会出现,然后根据需要将其一一拖到相应的测量变量框中即可。
15.点击Plugins-name unobserved variables,可以给残差命名。
16.用单向箭头连接自变量和因变量,用双向箭头联系自变量,表示相关。
CrystalMaker导出作图数据

CrystalMaker导出作图数据
1 File-New Crystal—选择所要用的空间结构和晶格系数—Transform—diffraction Patter---Powder画出图谱
2 File-export –export selected profiles(注意:导出的数据只是页面范围内的,如果图过大有可能导出数据不全)如图1—channel interval 选择步宽(图二),步宽越小做出的图谱越平滑,在本实验室XRD测试时步宽是0.02,所以可以选小一点例如0.01或0.005.---OK—直接保存
图一
图二
3 导出的数据先用Excel打开,并把文本形式转换成浮点形式右击----单元格式---数值
4 在KaleidGraph里读取数据进行画图(直接粘贴进去的数据无法作图,最好从File里读入)---space—Functions—stantistics里找出最大值,让B列整体除以Max进行归一化,然后放在C列,并在C列标出除的数值,这样做的原因是既可以保持原始数据,有可以一下看出所做的操作,方便以后查看。
- 1、下载文档前请自行甄别文档内容的完整性,平台不提供额外的编辑、内容补充、找答案等附加服务。
- 2、"仅部分预览"的文档,不可在线预览部分如存在完整性等问题,可反馈申请退款(可完整预览的文档不适用该条件!)。
- 3、如文档侵犯您的权益,请联系客服反馈,我们会尽快为您处理(人工客服工作时间:9:00-18:30)。
3.4 外接圆 . . . . . . . . . . . . . . . . . . . . . . . . . . . . . . . . . . . . . . . . . . . 14
3.5 直角标记 . . . . . . . . . . . . . . . . . . . . . . . . . . . . . . . . . . . . . . . . . 15
Asymptote 作图指南
莫图 (gzmfig@)
symptote
2008 年 8 月 5 日
ii
内容提要:
本书向你介绍一个功能强大的作图语言: Asymptote. 设计 Asymptote 的灵感来自有名的 MetaPost. 但由于 Asymptote 的语法格式与 C/C++ 很接 近, 使得它更容易被接受, 而且易学易懂不容易忘记. 你可以轻而易举地用它作出达到出版要求 的非常精美的数学图形, 例如几何图、示意图、函数和数据曲线或曲面图等. Asymptote 具有极 大的可扩展性, 稍加学习就可以写出自己的模块来. Asymptote 能够与 LATEX 完美地结合. 可以把 Asymptote 代码直接嵌入到 LATEX 文件, 也可以 使用 Asymptote 制作出高质量的 EPS 图形, 然后插入到 LATEX 文件中. Asymptote 利用 LATEX 对图形中的文字和数学公式排版, 这保证你的文章中的插图和正文具有完全相同的风格. 就象 LATEX 是数学排版的标准工具一样, Asymptote 的作者们也正在试图把它做成科技作图的标准 工具! 本书就是关于 Asymptote 的介绍. 读完之后你将学会怎样绘制出非常“专业”的数学图形. 相 信从中学到大学, 从学生到教师, 都会有它的受益者的.
3.2 背景网格 . . . . . . . . . . . . . . . . . . . . . . . . . . . . . . . . . . . . . . . . . 9
3.3 三角形 . . . . . . . . . . . . . . . . . . . . . . . . . . . . . . . . . . . . . . . . . . . 12
1.2 Asymptote 的特点
有很多自由的和商业的科技作图软件, 相信读者曾经或者正在使用着它们. 那么为什么还 需要 Asymptote 呢? 其实很简单, 每个软件都有各自的优缺点, 没有一个万能的软件可以做好 每件事情. 每个软件的特点决定了什么人会使用它以及使用它做什么. Asymptote 的主要特点 包括:
• 是一种计算机高级程序语言, 语法类似于 C/C++;
1GNU General Public License (GNU 通用公共许可证), 按照这一许可证授权的软件是开放源代码的 自由软件. 顾名思义, 你可以得到它的源代码, 并在一定条件下具有修改甚至发行它的权力. 具体内容见 /licenses/gpl.txt. 自由软件不见得一定是免费的, 但 Asymptote 是免费的.
5.3 内建函数 . . . . . . . . . . . . . . . . . . . . . . . . . . . . . . . . . . . . . . . . . 41
Asymptote 作图指南, ⃝c 2006 莫图 (gzmfig@)
iii
iv
目录
*5.4 函数也是变量 . . . . . . . . . . . . . . . . . . . . . . . . . . . . . . . . . . . . . . . 41 *5.5 函数中变量的使用 . . . . . . . . . . . . . . . . . . . . . . . . . . . . . . . . . . . . 41
索引
45
第一章 概述
1.1 Asymptote 是什么?
Asymptote 是一款按照 GNU GPL1 授权的自由软件, 你可以免费地得到并使用它. 它的作 者是 A. Hammerlindl, J. Bowman, 和 T. Prince. Asymptote 最初是为 Unix 和 Linux 操作系统 设计的, 但后来也移植到了其它主流操作系统, 例如 MacOS 和 MS Windows 等.
4.6 类型转换 . . . . . . . . . . . . . . . . . . . . . . . . . . . . . . . . . . . . . . . . . 30
4.7 程序流程 . . . . . . . . . . . . . . . . . . . . . . . . . . . . . . . . . . . . . . . . . 31
2.4 运行 Asymptote . . . . . . . . . . . . . . . . . . . . . . . . . . . . . . . . . . . . . 6
第三章 一个实例
9
3.1 作图任务 . . . . . . . . . . . . . . . . . . . . . . . . . . . . . . . . . . . . . . . . . 9
这些特点令 Asymptote 区别于其它软件. 特点本身谈不上好坏, 任何特点都有可能, 在某些情况 下, 给你带来方便或者麻烦.
不同于 Origin, SigmaPlot, Grace, XFig 等作图软件, Asymptote 是编程语言. 也就是说, 它 是基于代码的. 你要用它作图, 就要写一段程序. 这也表明, 它不是“所见即所得”的. 对那些喜 欢使用鼠标点来点去的读者来说, 这无疑是一个缺点(希望你不觉得这个缺点很严重). 而考虑 到 Asymptote 的用户多半也会使用 LATEX, 那么写写代码应该也算不上绝对不可接受的.
4.2 注释语句 . . . . . . . . . . . . . . . . . . . . . . . . . . . . . . . . . . . . . . . . . 22
4.3 变量 . . . . . . . . . . . . . . . . . . . . . . . . . . . . . . . . . . . . . . . . . . . . 22
Asymptote 作图指南, ⃝c 2006 莫图 (gzmfig@)
1
2
第一章 概述
• 使用精确的坐标系统, 可以输出高质量的向量图;
• 用 LATEX 排版图中的文字和数学公式;
• 具有很大的灵活性, 用户通常可以找到办法作出满足自己意愿的图;
• 具有很强的可扩展性, 对于常用的功能可以写出通用的模块, 这类似于 LATEX 的宏包和 C/C++ 的库.
1.3 互联网上的资源 . . . . . . . . . . . . . . . . . . . . . . . . . . . . . . . . . . . . . 2
第二章 安装和配置
3
2.1 安装前的准备 . . . . . . . . . . . . . . . . . . . . . . . . . . . . . . . . . . . . . . . 3
第五章 函数
35
5.1 函数的定义和调用(一) . . . . . . . . . . . . . . . . . . . . . . . . . . . . . . . . 35
5.2 函数的定义和调用(二) . . . . . . . . . . . . . . . . . . . . . . . . . . . . . . . . 40
其实, 与其说 Asymptote 是一款软件, 不如说它是一种语言, 一种专门为作数学图而设计 的高级计算机编程语言. 这里应该提到著名的 MetaPost 语言. Asymptote 的作者们正是受 到 MetaPost 的启发才开发了 Asymptote. MetaPost 的设计目的几乎与 Asymptote 相同, 但它 的语法对于大多数用户来说显得很陌生, 学习起来难度很大. 鉴于这一点, Asymptote 吸收了 MetaPost 的一些非常好的特点, 但使用了一种类似 C/C++ 语言的语法规则. 这使得它更加易 于接受, 从而减小了学习和使用的难度.
4.4 基本数据类型 . . . . . . . . . . . . . . . . . . . . . . . . . . . . . . . . . . . . . . . 24
4.5 运算符和表达式 . . . . . . . . . . . . . . . . . . . . . . . . . . . . . . . . . . . . . 28
2.2 安装 Asymptote . . . . . . . . . . . . . . . . . . . . . . . . . . . . . . . . . . . . . 3
2.3 配置 Asymptote . . . . . . . . . . . . . . . . . . . . . . . . . . . . . . . . . . . . . 5
3.6 文字标签 . . . . . . . . . . . . . . . . . . . . . . . . . . . . . . . . . . . . . . . . . 17
第四章 基本数据类型和程序流程
21
4.1 语句 . . . . . . . . . . . . . . . . . . . . . . . . . . . . . . . . . . . . . . . . . . . . 21
有人可能一听到“编程”就感到头疼. 因此 Asymptote 不会令所有的人满意. 但不管怎么 说, 至少我认为, 仅仅因为这一点就离开 Asymptote 的确非常遗憾. 用 Asymptote 编程可能远不 像你想象的那样可怕. 如果你仅仅是拿它来作一些图(这正是大多数人的目的), 它可以是非常 简单的. 打个比方, 比如你想算个简单的数学—就象 sin(π/5) 之类的—你所需要做的并不是系 统地学习 C 语言然后再编个程序, 而仅仅是去找个计算器按按键就行了. Asymptote 语言也是 这个意思. 当然, 如果你属于那种对编程不头疼的人, 那么你一定会在 Asymptote 中发现更多的 乐趣, 并会使你自己以及他人受益的.