Emission line galaxies in clusters
基础定律以及基尔霍夫定律_Chapter04

conditions (temperature, pressure, gravity,
ionizing flux, magnetic fields, etc.)
+ Velocities
Plasma in typical magnetic fields
Diffraction Grating Spectrographs
A schematic view of a spectrograph:
Light of different wavelengths is in phase at different reflection angles from the grating
Families of Energy Level Transitions Correspond to Spectroscopic Line Series
Photon energy:
hν = E i − E j
€
Balmer Series Lines in Stellar Spectra
(Optical thickness is generally proportional to density)
Hot plasma inside a star (optically thick) generates a thermal continuum
Cooler, optically thin gas near the surface imprints an absorption spectrum
Energy Levels in a Hydrogen Atom
高三宇宙奥秘英语阅读理解30题
高三宇宙奥秘英语阅读理解30题1<背景文章>Black holes are one of the most fascinating and mysterious phenomena in the universe. A black hole is formed when a massive star collapses at the end of its life. The gravitational pull of a black hole is so strong that nothing, not even light, can escape from it.The formation of a black hole begins with the collapse of a massive star. As the star runs out of fuel, it can no longer support its own weight and begins to collapse. The collapse continues until the star reaches a critical density, at which point it becomes a black hole.Black holes have several unique characteristics. One of the most notable is their event horizon, which is the boundary beyond which nothing can escape. Another characteristic is their intense gravitational field, which can distort the space and time around them.Black holes can have a significant impact on the surrounding celestial bodies. They can attract and swallow nearby stars and planets, and their gravitational pull can also affect the orbits of other celestial bodies.Scientists are still working to understand black holes better. They use a variety of tools and techniques, such as telescopes and computer simulations, to study these mysterious objects. Despite significant progressin recent years, there is still much that we don't know about black holes.1. What is a black hole formed by?A. A small star collapsing.B. A massive star collapsing.C. A planet collapsing.D. A moon collapsing.答案:B。
The Difference Between Clusters and Groups A Journey from Cluster Cores to their Outskirts
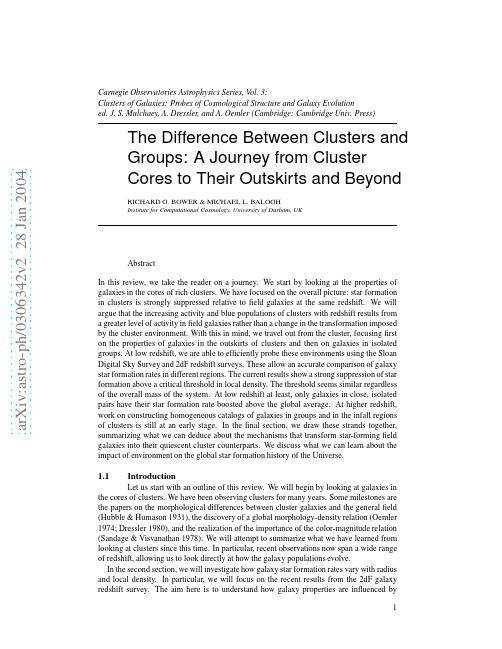
a rXiv:as tr o-ph/36342v228Jan24Carnegie Observatories Astrophysics Series,Vol.3:Clusters of Galaxies:Probes of Cosmological Structure and Galaxy Evolution ed.J.S.Mulchaey,A.Dressler,and A.Oemler (Cambridge:Cambridge Univ.Press)Abstract In this review,we take the reader on a journey.We start by looking at the properties of galaxies in the cores of rich clusters.We have focused on the overall picture:star formation in clusters is strongly suppressed relative to field galaxies at the same redshift.We will argue that the increasing activity and blue populations of clusters with redshift results from a greater level of activity in field galaxies rather than a change in the transformation imposed by the cluster environment.With this in mind,we travel out from the cluster,focusing first on the properties of galaxies in the outskirts of clusters and then on galaxies in isolated groups.At low redshift,we are able to efficiently probe these environments using the Sloan Digital Sky Survey and 2dF redshift surveys.These allow an accurate comparison of galaxy star formation rates in different regions.The current results show a strong suppression of star formation above a critical threshold in local density.The threshold seems similar regardless of the overall mass of the system.At low redshift at least,only galaxies in close,isolated pairs have their star formation rate boosted above the global average.At higher redshift,work on constructing homogeneous catalogs of galaxies in groups and in the infall regions of clusters is still at an early stage.In the final section,we draw these strands together,summarizing what we can deduce about the mechanisms that transform star-forming field galaxies into their quiescent cluster counterparts.We discuss what we can learn about the impact of environment on the global star formation history of the Universe.1.1IntroductionLet us start with an outline of this review.We will begin by looking at galaxies in the cores of clusters.We have been observing clusters for many years.Some milestones are the papers on the morphological differences between cluster galaxies and the general field (Hubble &Humason 1931),the discovery of a global morphology-density relation (Oemler 1974;Dressler 1980),and the realization of the importance of the color-magnitude relation (Sandage &Visvanathan 1978).We will attempt to summarize what we have learned from looking at clusters since this time.In particular,recent observations now span a wide range of redshift,allowing us to look directly at how the galaxy populations evolve.In the second section,we will investigate how galaxy star formation rates vary with radius and local density.In particular,we will focus on the recent results from the 2dF galaxy redshift survey.The aim here is to understand how galaxy properties are influenced byR.G.Bower and M.L.Baloghtheir environment.As we will discuss,it seems that the group environment is critical to the evolution of galaxies,creating a distinctive threshold.In the third section,we will review some of the ideas about how this can all be put to-gether,and how we can hope to use the environmental studies that many groups are under-taking to build a better understanding of the evolution of the Universe.Throughout,this paper will focus on galaxy star formation rates as the measure of galaxy properties,and will leave aside the whole issue of galaxy morphology for other reviewers to deal with.Clearly,the two issues are related since galaxy morphology partly reflects the strength of H II regions in the galaxy disk(Sandage1961),but the two factors are not uniquely linked.Morphology and star formation may be influenced differently by different environments(Dressler et al.1997;Poggianti et al.1999;McIntosh,Rix,&Caldwell2003). We will also skirt around the important issue of E+A galaxies(Couch&Sharples1987; Dressler&Gunn1992;Barger et al.1996;Balogh et al.1999;Poggianti et al.1999)and star formation that is obscured from view in the optical(Poggianti&Wu1999;Smail et al. 1999;Duc et al.2002;Miller&Owen2002).These are discussed in detail in Poggianti (2003).Wherever possible we will use Hαas the star formation indicator(Kennicutt1992), but as we probe to higher redshift,we are forced to use[O II]λ3727unless we shift our strategy to infrared spectrographs.We will also stick to talking about bright galaxies,by which we mean galaxies brighter than1mag fainter than L∗.It would need another complete review if we were to compare the properties of dwarf galaxies over the same range of environments.A good place to start would be Drinkwater et al.(2001),or the many presentations on cluster dwarfs at this Symposium.By the same token,we will avoid discussion of the evolution of the galaxy lu-minosity function(Barger et al.1998;De Propris et al.1999);this is summarized in Rudnick et al.(2003).To avoid confusion,it is worth laying out exactly what we mean by the terms“cluster”and“group.”We will use the term cluster to mean a virialized halo with mass greater than 1014M⊙and the term group to mean a halo more massive than about1013M⊙(but less than 1014M⊙).If an isolated L∗galaxy has a halo mass of order1012M⊙(Evans&Wilkinson 2000;Guzik&Seljak2002;Sakamoto,Chiba,&Beers2003),then our definition of a group contains more thanfive L∗galaxies at the present day.At higher redshift,the conversion between mass and galaxy numbers is more complicated since it depends on whether L∗evolves or not.If we stick to a definition in terms of mass,then at least everything is clear from a theoretical perspective,and we can make quite definite predictions about the numbers of such halos,their clustering as a function of redshift(Press&Schechter1974;Jenkins et al.2001;Sheth,Mo,&Tormen2001),and how mass accumulates from smaller halos into large clusters(Bond et al.1991;Bower1991;Lacey&Cole1993;Mo&White2002). 1.2Clusters of GalaxiesAt the outset,its worth reminding ourselves of why we study galaxy evolution in clusters.One popular reason is that the cluster is a good laboratory in which to study galaxy evolution.Another is that it is“easy”—when we observe the galaxy spectra,we know that most objects will be in this dense environment and that our observations will be highly efficient.The same reason allows us to recognize clusters out to very high redshifts and thus to extend our studies to a very long baseline.But we should remember that clusters do have a significant drawback:they are rare objects.For the standardΛCDM cosmology(Ωm=0.3,R.G.Bower and M.L.BaloghΩΛ=0.7,h=0.7,σ8=0.9),the space density of>1014M⊙halos is7×10−5h−3Mpc−3. Even though such clusters contain∼100L∗galaxies,less than10%of the cosmic galaxy population is found in such objects.There is an emerging consensus that suggests that the stellar populations of galaxies in cluster cores are generally old,with most of the stars formed at z>2.Most of these galaxies also have early-type morphology.It is possible to derive remarkably tight constraints from looking at colors(Bower,Lucey,&Ellis1992;Bower,Kodama,&Terlevich1998;Gladders et al.1998;van Dokkum et al.1998),at the Mg-σrelation(Gúzman et al.1992),or at the scatter in the fundamental plane(Jørgensen et al.1999;Fritz et al.2003).These results rely on the argument that recent star formation would lead to excessive scatter in these tight relations,unless it was in some way coordinated,or the color variations due to age were cancelled out by variations in metal abundance(Faber et al.1999;Ferreras,Charlot,&Silk 1999).Line-index measurements generally suggest very old populations(Jørgensen1999; Poggianti et al.2001),but these relations tend to show somewhat more scatter.This has been interpreted as evidence for the cancellation effects in broad-band colors.To improve the evidence,one can compare clusters at high redshift.For example,if we concentrate on the color-magnitude relation,we would expect the narrow relation seen in lo-cal clusters to break down as we approach the epoch when star formation was prevalent.In fact,we have discovered that the color-magnitude relation is well established in high-redshift clusters(Ellis et al.1997;van Dokkum et al.1998),and that the line-index correlations,fun-damental plane(Kelson et al.2001),and Tully-Fisher relation measurements(e.g.,Metavier 2003;Ziegler et al.2003;but see Milvang-Jensen et al.2003)also show little increase in scatter compared to local clusters.So far,tight relations have been identified in clusters out to z=1.27(van Dokkum et al.2000;Barrientos et al.2003;van Dokkum&Stanford2003). The tight relation does eventually seem to break down,and we are not aware of any strong color-magnitude relation that has been identified in“proto-clusters”at z>2.There is a bias here,however,that should be clearly recognized.Although we are discov-ering that clusters at high redshifts seem also to contain old galaxies,this does not mean that all galaxies in local clusters must have these old populations.A large fraction of galaxies that are bound into local clusters would have been isolated“field”galaxies at z≈1.An even stronger bias of this type has been termed“progenitor bias”by van Dokkum&Franx(2001). They point out that if only a subset of the cluster populations is studied(for example only the galaxies with early-type morphology),then it is quite easy to arrive at a biased view.To get the full picture,one needs to study the galaxy population of the cluster as a whole.An interesting strategy is therefore to simply measure the star formation rate in clusters at different epochs.The general consensus seems to be that there is little star formation (relative tofield galaxies at the same redshift)in virialized cluster cores below z=1.5.For example,Couch et al.’s(2001)survey of the AC114cluster found that star formation was suppressed by an order of magnitude compared to thefield.Similar levels of suppression are seen in poor clusters(Balogh et al.2002).While these studiesfind some exciting objects(see Finn&Zaritsky2003for further examples),the general trend is for the star formation rate to be strongly suppressed relative to thefield at the same redshift.infrared measurements(Duc et al.2002)and radio measurements(Miller2003;Morrison&Owen 2003)have generally come to similar conclusions.The E+A galaxies(Dressler&Gunn 1992)or post-starburst galaxies(Couch&Sharples1987)are a puzzling exception.The large numbers found by the MORPHs group(Dressler et al.1997)suggest that there wasR.G.Bower and M.L.Baloghstrong star formation activity in the recent past in many galaxies(but see Balogh et al.1999).A possible explanation is that these galaxies have only recently arrived in the cluster from much lower-density environments.Indeed,field studies at low redshift have shown this type of object to be more common in low-density regions than in clusters(Zabludoff et al.1996; Goto et al.2003;Quintero et al.2003).Therefore,the greater numbers of E+A galaxies found in high-redshift clusters may result from the greater star formation activity of galaxies outside clusters—this idea gains strong support from Tran et al.’s(2003)observations presented at the Symposium.The next step is to compare the star formation rates in clusters cores at different redshifts. Work is only just starting on this using emission-line strengths(e.g.,Ellingson et al.2001), since it is essential to control systematic uncertainties,such as the aperture through which the star formation rate is measured.However,extensive comparisons have been made on the basis of colors,starting with Butcher&Oemler(1978,1984)and Couch&Newell(1984). These papers showed a startling increase in the numbers of blue galaxies in z>0.2galaxy clusters compared to the present day.These results have been confirmed by more recent studies(e.g.,Rakos&Schombert1995;Margoniner et al.2001),although the effect of the magnitude limit and cluster selection play at least as important a role as the redshift(Fairley et al.2002).There are two issues that complicate the comparison of the galaxies in cluster cores,how-ever.Firstly,we must be careful how we select galaxies that are to be compared.Most of the blue galaxies lie close to the photometric completeness limit.These galaxies will fade by up to1mag if star formation is turned off,and thus they are not directly comparable to the red-galaxy population selected at the same magnitude limit(Smail et al.1998;Kodama &Bower2001).Secondly,we are observing galaxy clusters in projection.There is little doubt that thefield galaxy population at intermediate redshift is much bluer than in the local Universe(Lilly et al.1995;Madau,Pozzetti,&Dickinson1998);thus,although a small level of contamination byfield galaxies has little influence on the overall color distribution, the same contamination will have a much bigger impact on the distribution at intermediate redshift.This problem is only partially eliminated if a complete sample of galaxy redshifts is available since the velocity dispersion of the cluster makes it impossible to distinguish cluster members from“near-field”galaxies that are close enough to the cluster to be indis-tinguishable in redshift space(Allington-Smith et al.1993;Balogh et al.1999;Ellingson et al.2001).This idea is reinforced by experiments with numerical simulations.Galaxies can be associated with dark matter particles,and then“observed”to measure the extent to which radial information is lost.Diaferio et al.(2001)found that a contamination of10%can easily occur;furthermore,since most of the contaminating galaxies are blue(and in these models most genuine cluster galaxies are red),the fraction of blue galaxies can then be boosted by 50%.Despite this,Ellingson et al.(2001)conclude that the rate at which clusters are being built up must also be higher in the past in order for this explanation to work.Kauffmann (1995)shows that there is good theoretical justification for this.It will be interesting to see if the evolution in the colors of the cluster population are con-sistent with the evolution in the emission-line strengths.We might expect to see a difference because of the different time scales probed by colors and by emission lines.For example, if galaxies that fall into the cluster have their star formation quickly suppressed,they will remain blue(in the Butcher-Oemler sense)for a significant period after the line emission subsides(Ellingson et al.2001).Combining these factors,it seems quite possible to accom-R.G.Bower and M.L.BaloghFig.1.1.The median star formation rate as a function of local density from galaxies around clusters in the2dF survey(based on Lewis et al.2002).The left panel shows the star formation rate of all galaxies in the sample;the right panel shows the effect of removing galaxies within2virial radii of the cluster center.Error bars are jackknife estimates.The relations are amazingly similar,showing that the local density is more important than the overall mass of the group or cluster.modate both weak evolution in emission-line strength and more rapid evolution in the colors of cluster galaxies.1.3The Other Axis:Density1.3.1The Cluster OutskirtsSo far we have been discussing the properties of galaxies within the cores of clus-ters,but the dependence on density(or,nearly equivalently,cluster-centric radius)provides another axis over which to study galaxy properties.We have seen that star formation is strongly suppressed in the cores of rich clusters—but at what radius do the galaxies be-come more like thefield?We should also realize that it might be better to compare galaxy properties with their local densities(Dressler1980;Kodama et al.2001),as the large-scale structure surrounding clusters may have the dominant impact on galaxy evolution.One of thefirst steps at studying galaxies in the transition zone around clusters were made with the CNOC2survey(Balogh et al.1999).They showed that there was a strong radial dependence in the star formation rate,but that the star formation rate had not yet reached thefield value even at r≈r vir.The Sloan Digital Sky Survey(SDSS)and2dF galaxy redshift survey surveys have allowed us to make a huge leap forward in this respect.In the local Universe,we are able to map galaxy star formation rates,using the complete redshift information to eliminate contamination by interlopers.In this section we will concentrate on what we have learned from the2dF survey(Lewis et al.2002),but the results from the SDSS give very consistent answers(Gómez et al.2003).Figure1.1shows the median star formation rate as a function of local density.What is remarkable in this plot is that there is quite a sharp transition between galaxies withfield-like star formation rates atΣ<1Mpc−2R.G.Bower and M.L.Baloghand galaxies with low star formation rates comparable to cluster cores(Σ>7Mpc−2).The switch is complete over a range of less than7in density.The density at which the transition occurs corresponds to the density at the virial radius. If star formation is plotted against radius,the transition is considerably smeared out,but does occur at around the cluster virial radius—well outside the core region on which a lot of previous work has been focused.The2dF galaxy redshift survey sample is sufficiently large that we can remove the cluster completely from this diagram.By only plotting galaxies more than2virial radii from the cluster centers,we concentrate on thefilaments of infalling material.The correlation with local density is shown in Figure1.1.Amazingly,the relation hardly changes compared to the complete cluster diagram.This is a great success:we have identified the region where galaxy transformation occurs! It is in the infallingfilaments(consisting of chains of groups)where galaxies seem to change from star-forming,field-like galaxies to passive,cluster-like objects.Of course,it is tempt-ing to associate the transformation in star formation rate with a transformation from late-to early-type morphology.Unfortunately,this test cannot be undertaken with the available2dF data,but we can expect clearer results from SDSS.What happens at higher redshift?In fact,thefirst claim of a sharp transition in galaxy properties was made by Kodama et al.(2001)for the distant cluster A851at z=0.41(top panel in Fig.1.2).Kodama et al.(2001)used photometric redshifts to eliminate foreground objects,and thus to reduce contamination of the cluster members to a level that allowed the color distribution to be studied in the outer parts of the cluster.Their results show an amazing transition in color.Direct comparison with the local clusters is difficult,however,as the magnitude limits are very different(Kodama et al.’s photometric data reach much fainter than the local spectroscopic samples),but Gómez et al.(2003)concluded that the threshold seen by Kodama et al.(2001)was at a significantly higher local density.Perhaps dwarf galaxies are more robust to this environmental transformation;we are not going to attempt to cover this issue.A number of researchers are now engaged in spectroscopic programs to study the trans-formation threshold in higher-redshift systems.The results of Treu et al.(2003)are perhaps the most advanced.They also have the advantage of panoramic WFPC2imaging that will allow them to compare the transformation of galaxy morphology(see Treu2003).The highest redshifts that can be studied require a combination of photometric preselec-tion of objects for spectroscopy.Nakata et al.(2003)have used the photometric technique to map the large-scale structure around the Lynx cluster at z=1.27(lower panel in Fig.1.2), and similar techniques are described by Demarco et al.(2003).These groups identify several candidatefilaments;spectroscopy of these regions is now underway.1.3.2Galaxy GroupsReturning to the local Universe,it is interesting to see if we can probe the properties of galaxies in groups directly.A lot of work has been carried out looking at small samples of groups selected from the CfA redshift survey(Geller&Huchra1983;Moore,Frenk,& White1993),from the Hickson compact group catalog(Hickson,Kindl,&Auman1989), and also from X-ray surveys(Henry et al.1995;Mulchaey et al.2003).In the era of the2dF and SDSS redshift surveys,we can construct robust catalogs contain-ing thousands of groups(Eke et al.2003).It is interesting to compare the star formation rate in the groups as a function of local density,with the relation found in clusters.The relationR.G.Bower and M.L.BaloghFig.1.2.Top:Contour lines pinpoint the transition zone around the rich cluster A851at z=0.41studied by Kodama et al.2001.Bottom:z=1.27groups tracing the large-scale structure surrounding the Lynx clusters(based on Nakata et al.2003).Thesefigures illustrate how photometric methods can be used to reduce contamination rates in the outskirts of distant clusters so that the galaxy population can be studied there.R.G.Bower and M.L.Balogh 1010.111001020301010.11100102030Fig.1.3.The star formation rate as a function of density,comparing groups of galaxies with clusters.The upper and lower horizontal dashed lines show the 75th percentile and the me-dian of the equivalent widths.The hashed region shows the relation for the complete sample,while the solid line shows the relation for systems with 500kms −1<σ<1000kms −1(left )and σ<500kms −1(right ).The dependence on local density is identical irrespective of the velocity dispersion of the whole system.Figure based on Balogh et al.(2003).for the 2dF survey is shown in Figure 1.3(Balogh et al.2003).The panels show the effect of selecting systems on the basis of their velocity dispersion.There is actually very little difference between the trends.The galaxies in dense regions suffer the same suppression of their star formation rate,regardless of the system’s total mass.It is also possible to show that the groups in the infall regions of clusters show the same pattern as isolated groups.We have to conclude that the suppression of star formation is very much a local process.This is an important clue to distinguish between the different transformation mechanisms.Interestingly,in the local Universe,there is little evidence for the environment producing a rise in the star formation rate above the field value.The only exception to this appears to be the close,low-velocity encounters of isolated galaxies (Barton,Geller,&Kenyon 2000;Lambas et al.2003).Figure 1.4shows the star formation rate as a function of separation for systems of different total velocity dispersion.A spike in the median star formation rate appears only in the smallest bin of the first panel.It will be interesting to study this trend within groups and clusters (Balogh et al.2003).One of the next goals is to extend studies of groups to higher redshifts.The first steps in this direction were made by Allington-Smith et al.(1993).They used radio galaxies to pick out galaxy groups at redshifts up to 0.5.By stacking photometric catalogs,they showed thatthe galaxy populations of rich groups (N −190.5>30)∗became increasingly blue with redshift,while poorer groups contained similar populations of blue galaxies at all redshifts.A survey of redshift-space selected groups at intermediate redshift became possible with the CNOC2redshift survey.Carlberg et al.(2001)report a statistical sample of 160groups out to redshift ∗Group richness defined as the number of galaxies with M V ≤−19mag within a 0.5Mpc radius of the radio galaxy (H 0=50km s −1Mpc −1and q 0=0assumed).R.G.Bower and M.L.Balogh00.20.40.60.8111.21.41.6Fig.1.4.The star formation rate of galaxy pairs (b )as a function of separation.The different line styles distinguish the spectral type of the first galaxy of the pair,with the sequence of dot-dash,dotted,and solid lines showing the effect of restricting the sample to more and more active central objects.A strong enhancement is only seen when the separation is less than 100kpc.The figure is based on Lambas et al.(2003).0.4.On the Magellan telescopes,we have been following up the systems at z >0.3in order to determine the complete membership and measure total star formation rates.Figure 1.5shows the membership of a sample group.The initial results are exciting —star formation in many galaxies are more comparable to the surrounding field values.If these results are confirmed as we derive more redshifts and improve the group completeness,it represents a very interesting change from the properties seen in the 2dF groups.At higher redshifts,a tantalizing glimpse of the properties of a few groups can be obtained from the Caltech redshift survey (Cohen et al.2000).R.G.Bower and M.L.BaloghFig.1.5.A sample group from the CNOC2/Magellan group survey.This poor group,con-taining10members,is at z=0.393.1.4What Does It All Mean?1.4.1The Mechanisms Driving Galaxy EvolutionThe mechanisms that have been proposed to drive galaxy evolution in dense envi-ronments can be broadly separated into three categories.R.G.Bower and M.L.Balogh•Ram pressure stripping.Galaxies traveling through a dense intracluster medium suffer a strong ram pressure effect that sweeps cold gas out of the stellar disk(Gunn&Gott1972;Abadi,Moore,&Bower1999;Quilis,Moore,&Bower2000).The issue withthis mechanism is whether it can be effective outside dense,rich cluster cores where thegalaxy velocities are very high and the intracluster medium is very dense.Quilis et al.(2000)found that incorporating holes in the galaxy H I distribution made galaxies easierto strip(Fig.1.6),but it still required clusters more massive than the Virgo cluster to havea great effect.•Collisions and harassment.Collisions or close encounters between galaxies can have a strong effect on their star formation rates.The tidal forces generated tend to funnelgas toward the galaxy center(Barnes&Hernquist1991;Barnes2002;Mihos2003).It islikely that this will fuel a starburst,ejecting a large fraction of the material(Martin1999).Gas in the outer parts of the disk,on the other hand,will be drawn out of the galaxy bythe encounter.Although individual collisions are expected to be most effective in groupsbecause the velocity of the encounter is similar to the orbital time scale within the galaxy,Moore et al.(1996)showed that the cumulative effect of many weak encounters can alsobe important in clusters of galaxies.•Strangulation.Current theories of galaxy formation suggest that isolated galaxies contin-uously draw a supply of fresh gas from a hot,diffuse reservoir in their halo(Larson,Tinsley,&Caldwell1980;Cole et al.2000).Although the reservoir is too cool anddiffuse to be easily detected(Benson et al.2000;Fang,Sembach,&Canizares2003),this idea is supported by the observation that90%of the baryonic content of clusters isin the from of a hot,diffuse intracluster medium.The baryon reservoir in galaxy halosis entirely analogous.When an isolated galaxy becomes part of a group,it may loose itspreferential location at the center of the halo and thus be unable to draw further on thebaryon reservoir.Without a mechanism for resupplying the material that is consumed instar formation and feedback,the galaxies’star formation rate will decline.The exact ratedepends on the star formation law that is used(Schmidt1959;Kennicutt1989)and onwhether feedback is strong enough to drive an outflow from the disk.Semi-analytic models(e.g.,Cole et al.2000)generally incorporate only the third of these mechanisms.The observational data strongly suggest that the ram pressure stripping sce-nario cannot be important for the majority of galaxies.As we have seen,the suppression of star formation seems to occur well outside of the clusters and is equally effective in low-velocity groups,which do not possess a sufficiently dense intracluster medium.Distinguish-ing between the remaining two scenarios is rather harder,since they have similar dependence on environment.Indeed,they may both play a role.The key difference is the time scale on which they operate:collisions are expected to produce changes in galaxy properties on short time scales(∼100Myr),while the changes due to strangulation are much more gradual (>1Gyr).The time scale for harassment is less well defined;while the individual encoun-ters may induce short-lived bursts of star formation,the overall effect may accumulate over several Gyr.The radial gradients that we observe appear to prefer long time scales and, hence,a mechanism like strangulation or harassment(Balogh,Navarro,&Morris2000).To make further progress in this area,we need to compile detailed observations of galaxies that are caught in the transition phase.In particular,morphological measurements will provide another important distinction(e.g.,McIntosh et al.2003).。
我想成为一名宇航员八上英语作文

我想成为一名宇航员八上英语作文I Want to Become an AstronautHave you ever looked up at the night sky and marveled at the twinkling stars and the bright moon? I sure have, and it never ceases to fill me with wonder and amazement. The mysteries of space have captivated me for as long as I can remember. The thought of exploring the great unknown and unraveling the secrets of the universe thrills me to my core. That's why I dream of becoming an astronaut one day.Ever since I was a little kid, I've been fascinated by space. I can vividly recall lying on the grass in my backyard, gazing intently at the star-speckled sky, and letting my imagination run wild. What kind of worlds could those distant stars have orbiting around them? Could some of them possibly harbor alien life forms? The very idea of intelligent beings existing on other planets both excited and intrigued me.My fascination only grew stronger as I got older and started learning more about space in school. I was in awe when I first saw pictures of faraway galaxies, star clusters, and nebulae. The sheer scale of the universe is mind-boggling, and the thought that we humans have only scratched the surface in ourexploration of it fueled my desire to be a part of those brave endeavors.Of course, becoming an astronaut is no easy feat. It requires years of rigorous training, both mentally and physically. You need to be incredibly knowledgeable in fields like physics, astronomy, and engineering. You also need to be in peak physical condition to withstand the extreme forces involved in space travel. And perhaps most importantly, you need to have an unwavering courage and determination to face the many risks and challenges that come with venturing into the great unknown.However, I am fully prepared to dedicate myself to this path. I've always been a diligent and hardworking student, especially in subjects like math and science. I'm also physically active and take good care of my health. But beyond that, I possess an insatiable curiosity and a hunger for knowledge that I believe will serve me well in a career as an astronaut.Just imagine the thrill of being launched into space aboard a powerful rocket, leaving the Earth's atmosphere behind and entering the vast expanse of the cosmos. The view of our beautiful planet suspended in the inky blackness of space must be a breathtaking sight to behold. And then, to actually set footon another celestial body, like the Moon or Mars – what an incredible accomplishment that would be!As an astronaut, I would have the opportunity to conduct cutting-edge scientific research that could potentially lead to groundbreaking discoveries about the origins of our universe, the nature of black holes, or even the existence of extraterrestrial life. The knowledge and insights we could gain from space exploration are virtually limitless, and I would be proud to contribute to humanity's quest for understanding.Of course, being an astronaut also comes with its fair share of risks and dangers. The perils of space travel arewell-documented, from the potential for equipment malfunctions and life-support system failures to the ever-present threat of cosmic radiation and the harsh conditions of extraterrestrial environments. It's a profession that demands nerves of steel and an unwavering commitment to the mission.But I truly believe that the rewards of space exploration far outweigh the risks. The knowledge and discoveries we stand to gain could revolutionize our understanding of the universe and potentially even secure the long-term survival of our species by enabling us to establish settlements on other planets.Imagine being one of the first humans to set foot on Mars and pave the way for future colonization efforts. Or perhaps even venturing beyond our solar system aboard an advanced spacecraft, exploring distant star systems and making first contact with alien civilizations. These may seem like far-fetched notions now, but with the tireless efforts of brilliant minds and the continued advancement of space technology, who knows what amazing feats we might achieve in the future?That's why I dream of becoming an astronaut – to be a part of that grand adventure, to push the boundaries of human knowledge and exploration, and to contribute to our species' quest to unlock the secrets of the cosmos. It's a lofty ambition, to be sure, but one that I am fully committed to pursuing with every ounce of my passion, determination, and hard work.So the next time you gaze up at the night sky and marvel at the twinkling stars, remember that there's a whole universe out there waiting to be explored. And if you catch a glimpse of a shooting star, make a wish for me – that one day, I might have the incredible honor and privilege of being among those brave souls who venture forth into the great unknown, propelling humanity's journey of cosmic exploration to new and uncharted frontiers.。
英语作文关于星星的信息

英语作文关于星星的信息The Stars。
Stars have always captivated human beings with their beauty and mystery. They have inspired poets, artists, and scientists for centuries. The night sky, filled with twinkling stars, has been a source of wonder and awe for people all around the world.Stars are massive, luminous spheres of plasma held together by gravity. They are made up of hydrogen and helium, the two lightest elements in the universe. Stars shine brightly because of the nuclear fusion reactions that take place in their cores. These reactions produce tremendous amounts of energy, which is emitted as light and heat.Stars come in a variety of sizes and colors. The color of a star is determined by its temperature, with blue stars being the hottest and red stars being the coolest. The sizeof a star is measured in terms of its mass, with larger stars being more massive than smaller ones. The most massive stars are known as supergiants, while the least massive stars are known as dwarfs.Stars are not evenly distributed throughout the universe. They are grouped together in galaxies, which are vast collections of stars, gas, and dust held together by gravity. Our own galaxy, the Milky Way, contains billions of stars, including our own sun. In addition to galaxies, stars are also found in clusters, which are smaller groups of stars that are held together by their mutual gravitational attraction.Stars play a crucial role in the universe. They are responsible for the creation of heavy elements, which are essential for the formation of planets, moons, and life itself. Stars also serve as beacons in the night sky, guiding sailors, travelers, and astronomers alike.In conclusion, stars are fascinating objects that continue to intrigue and amaze us. They are the buildingblocks of the universe, the source of light and heat, and the inspiration for countless works of art and literature. The next time you look up at the night sky, take a moment to appreciate the beauty and wonder of the stars above.。
The HamburgSAO survey for emission-line galaxies. VI. The sixth list of 126 galaxies
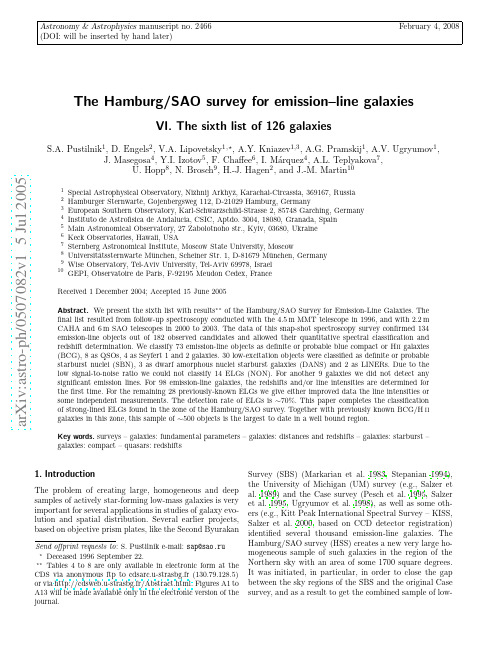
a r X i v :a s t r o -p h /0507082v 1 5 J u l 2005Astronomy &Astrophysics manuscript no.2466February 4,2008(DOI:will be inserted by hand later)The Hamburg/SAO survey for emission–line galaxiesVI.The sixth list of 126galaxiesS.A.Pustilnik 1,D.Engels 2,V.A.Lipovetsky 1,⋆,A.Y.Kniazev 1,3,A.G.Pramskij 1,A.V.Ugryumov 1,J.Masegosa 4,Y.I.Izotov 5,F.Chaffee 6,I.M´a rquez 4,A.L.Teplyakova 7,U.Hopp 8,N.Brosch 9,H.-J.Hagen 2,and J.-M.Martin 101Special Astrophysical Observatory,Nizhnij Arkhyz,Karachai-Circassia,369167,Russia 2Hamburger Sternwarte,Gojenbergsweg 112,D-21029Hamburg,Germany3European Southern Observatory,Karl-Schwarzschild-Strasse 2,85748Garching,Germany 4Instituto de Astrofisica de Andalucia,CSIC,Aptdo.3004,18080,Granada,Spain 5Main Astronomical Observatory,27Zabolotnoho str.,Kyiv,03680,Ukraine 6Keck Observatories,Hawaii,USA7Sternberg Astronomical Institute,Moscow State University,Moscow 8Universit¨a tssternwarte M¨u nchen,Scheiner Str.1,D-81679M¨u nchen,Germany 9Wise Observatory,Tel-Aviv University,Tel-Aviv 69978,Israel 10GEPI,Observatoire de Paris,F-92195Meudon Cedex,FranceReceived 1December 2004;Accepted 15June 2005Abstract.We present the sixth list with results ⋆⋆of the Hamburg/SAO Survey for Emission-Line Galaxies.The final list resulted from follow-up spectroscopy conducted with the 4.5m MMT telescope in 1996,and with 2.2m CAHA and 6m SAO telescopes in 2000to 2003.The data of this snap-shot spectroscopy survey confirmed 134emission-line objects out of 182observed candidates and allowed their quantitative spectral classification and redshift determination.We classify 73emission-line objects as definite or probable blue compact or H ii galaxies (BCG),8as QSOs,4as Seyfert 1and 2galaxies.30low-excitation objects were classified as definite or probable starburst nuclei (SBN),3as dwarf amorphous nuclei starburst galaxies (DANS)and 2as LINERs.Due to the low signal-to-noise ratio we could not classify 14ELGs (NON).For another 9galaxies we did not detect any significant emission lines.For 98emission-line galaxies,the redshifts and/or line intensities are determined for the first time.For the remaining 28previously-known ELGs we give either improved data the line intensities or some independent measurements.The detection rate of ELGs is ∼70%.This paper completes the classification of strong-lined ELGs found in the zone of the Hamburg/SAO survey.Together with previously known BCG/H ii galaxies in this zone,this sample of ∼500objects is the largest to date in a well bound region.Key words.surveys –galaxies:fundamental parameters –galaxies:distances and redshifts –galaxies:starburst –galaxies:compact –quasars:redshifts1.IntroductionThe problem of creating large,homogeneous and deep samples of actively star-forming low-mass galaxies is very important for several applications in studies of galaxy evo-lution and spatial distribution.Several earlier projects,based on objective prism plates,like the Second Byurakan2S.Pustilnik et al.:HSS for emission-line galaxies.VI.Sixth list of126ELGsTable1.Journal of observations20.05.1996 4.5m MMT MMT Spect R3003700–7400 3.24211-12.04.20006m BTA LSS R3253600–7600 4.62425.05.20006m BTA LSS R3253600–7600 4.6128.06-04.07.2000 2.2m CAHA CAFOS G-2003700–9500 4.55403.10-31.10.20006m BTA LSS R6513700–6000 2.3517.01-20.01.20016m BTA LSS R6513700–6000 2.31616-19.02.20026m BTA LSS R4003700–7600 3.81514-15.02.2002 2.2m CAHA CAFOS G-2003700–9500 4.51410.12-13.12.20026m BTA LSS R4003700–7600 3.81024.12.20036m BTA LSS R4003700–7600 3.84Candidate Sample N BCG Other QSO Galaxies Stars Not&ELGs without ClassifiedBCG?emissionSecond priority new771117682212already known299201–––total1062037782212mass emission-line galaxies in a very large section of sky suitable for the study of their spatial distribution.The basic outline of the HSS and itsfirst results are de-scribed in Paper I(Ugryumov et al.1999),while the addi-tional results from the follow-up spectroscopy are given in papers II,III,IV and V(Pustilnik et al.1999,Hopp et al. 2000,Kniazev et al.2001,Ugryumov et al2001).In this, the last paper,we present the results of the follow-up spec-troscopy of another182objects selected on the Hamburg Quasar Survey(HQS)prism spectral plates as ELG can-didates.In Table2we show the breakdown of these ob-jects in the samples of the1st and2nd priority group, and the categories of detected objects as described below. Out of134emission-line objects(galaxies and QSOs)69 were known as NED objects.For28of these galaxies ei-ther only redshift,or also some information on emission lines was known,mainly from the previous HSS papers. We included such objects in the presented list since we provide either significantly improved data or some inde-pendent measurements.The article is organized as follows.In section2we give the details of the spectroscopic observations and of the data reduction.In section3the results of the observations are presented in several tables.In section4we briefly dis-cuss the new data and summarize the current state of the Hamburg/SAO survey.Throughout this paper a Hubble constant H0=75km s−1Mpc−1is used.2.Spectral observations and data reduction2.1.ObservationsThe results presented here were obtained mostly in snap-shot observing mode during one run with the 4.5m Multiple Mirror Telescope(MMT),two runs with the Calar Alto2.2m and seven runs with the SAO6m(BTA) telescopes(see Table1).2.2.Observations with the MMT4.5m telescopeThe observations were carried out on May20,1996,with the Red Channel of the MMT Spectrograph through the long slit of1.′′5×180′′.The300grooves mm−1grating in first order provides a dispersion of3.2˚A pixel−1,and a spectral resolution FWHM of about10˚A.To avoid second-order contamination,a L-38blockingfilter was used.The total spectral range wasλλ3700–7400˚A.The spectra were rebinned by a factor of2along the spatial axis.Hence,the spatial sampling was0.′′6pixel−1.S.Pustilnik et al.:HSS for emission-line galaxies.VI.Sixth list of126ELGs3Short exposures(3–5minutes)were taken in order to detect strong emission lines to allow redshift measure-ments and a crude classification.The slit was not ori-ented along the parallactic angle because of the snap-shot observing mode.Reference spectra of an Ar–Ne–He lamp were recorded to provide wavelength calibra-tion.Spectrophotometric standard stars from Oke(1990) and Bohlin(1996)were observed at the beginning and at the end of the night forflux calibration.The domeflats, bias,dark and twilight sky frames were accumulated each night.The weather conditions were photometric,with see-ing variations around1.′′0(FWHM).2.3.Calar Alto2.2m telescope observationsFollow-up spectroscopy with the CAHA2.2m telescope was carried out during two runs(June-July2000and February2002),using the Calar Alto Faint Object Spectrograph(CAFOS).During these runs a long slit of300′′×2′′and a G-200grism(187˚A mm−1,first or-der)were used.The spatial scale along the slit was 0.′′53pixel−1.A SITE152K×2K CCD was operated without binning.The wavelength coverage wasλ3700–λ9500˚A with maximum sensitivity at∼6000˚A.The spec-tral resolution was∼12–16˚A(FWHM).The slit orienta-tion was not aligned with the parallactic angle because of the snap-shot observing mode.The exposure times varied within5−20minutes depending on the object brightness and weather conditions.The observations were comple-mented by standard starflux measurements(Oke1990, Bohlin1996),reference spectra(Hg–Cd lamp)for wave-length calibration,domeflat,bias and dark frames.In the run of June-July2000the weather conditions were pho-tometric most of the time with a seeing≈1.5′′(FWHM). During one night of this run,as well as during two nights in February2002,the weather conditions were variable with a seeing of3′′–4′′.The measurements in these nights are marked by“∗”in Table5.There was no order separationfilter applied,there-fore some second order contamination by the object UV light might be present at wavelengths longer than7200˚A. However,as can be directly seen from the presented spec-tra,this effect is probably small,since it is undetectable in the continuum behavior aroundλ7200˚A.In principle,one could expect an increase of the linefluxes at wavelengths longer than this due to the second order contamination in the spectra of theflux calibrating stars.There are seven objects whose emission line ratios could be potentially af-fected.These objects are listed and commented at the end of section3.1.2.4.BTA6m telescope observationsThe observations with the6m telescope(BTA)of the Special Astrophysical Observatory of Russian Academy of Sciences(SAO RAS)were performed mainly as a back-up program.Therefore the weather conditions in most cases were rather poor.The seeing in the majority of the nights was in the range of2′′to4′′(FWHM)and/or the transparency was variable.Results obtained under non-photometric conditions are marked by“∗”in Table 5.In all cases we used the long slit spectrograph(LSS) in the BTA prime focus(Afanasiev et al.1995)with a Photometrics1K×1K CCD detector with24µm pixel size. The long slit of120′′was used with the slit width of either 1.′′5or2.′′0,depending on the seeing and grating.Three set-ups with the gratings of325,400and651grooves mm−1 were used during various runs.The wavelength ranges of the spectra covered for different set-ups and their sam-plings in˚A pixel−1are given in Table1.The respective effective resolutions were∼14˚A,∼11˚A and∼7˚A.Reference spectra of an Ar–Ne–He lamp were recorded before or after each observation to provide wavelength cal-ibration.Spectrophotometric standard stars from Bohlin (1996)were observed forflux calibration.All observations were conducted mainly with the software package NICE in MIDAS,described by Kniazev&Shergin(1995).2.5.Data reductionThe reduction of all data was performed at SAO using the standard reduction systems MIDAS1and IRAF2.The MIDAS command FILTER/COSMIC was found to be a quite successful way to automatically remove all cosmic ray hits from the images.After that we applied the IRAF package CCDRED for bad pixel removal,trimming, bias-dark subtraction,slit profile andflat-field corrections.To do accurate wavelength calibration,correction for distortion and tilt for each frame,sky subtraction and correction for atmospheric extinction,the IRAF package LONGSLIT was used.To obtain an instrumental response function from ob-served spectrophotometricflux standards,wefirst ex-tracted the apertures of standard stars.Then the de-termined sensitivity curve was applied to performflux calibration for all object images.Finally we extracted one-dimensional spectra from theflux calibrated images. When more than one exposure was taken with the same setup for a given object,the extracted spectra were co-added and a mean vector was calculated.When several observations with different setups(telescopes or grisms) for the same object were obtained,the data were reduced and measured independently and the more accurate values were taken.To speed-up and facilitate the line measurements we employed the dedicated commandfiles created at SAO us-ing the FIT context and MIDAS command language.The procedures for the measurements of line parameters and4S.Pustilnik et al.:HSS for emission-line galaxies.VI.Sixth list of126ELGsredshifts applied were also described in detail in Papers III,IV and in Kniazev et al.(2004).3.Results of follow–up spectroscopyIn Table2we present the summary of the observation results.182candidates were selected from ourfirst and second priority samples introduced in Paper IV.Out of76first priority candidates(objects showing a clear density peak nearλ5000˚A and a blue continuum on the HQS prism spectral plates),36objects appeared in our list as new ones.40objects were listed in the NED as galaxies or objects from various catalogs and4of them already had information on emission lines and redshifts in earlier publications.Apart from these4objects,24more of the mentioned40NED galaxies have appeared in our previous HSS papers,but had data of rather low quality. All such objects were included in our observing program in order to improve spectral information.The compari-son of our measured velocities with those of galaxies with already known redshift shows acceptable consistency for most objects in common within the uncertainties given. However,forfive galaxies originally appearing in the HSS List II,the difference found is as high as200–300km s−1, which probably indicates the lower accuracy of some ra-dial velocities from that list.The remaining106observed objects were taken from the list of the second priority candidates,those with less prominent emission features on the high resolution spec-tra(HRS)obtained after scanning the original HQS ob-jective prism plates.As described in Paper IV,we created from this list the“APM selected sample”,which uses addi-tional information for the selection.The“APM selected”sample comprises second priority candidates which are classified as non-stellar(at least in one of twofilters)on Palomar Sky Survey plates(PSS)in the APM database, and have a blue colour according to the APM colour sys-tem((B−R)APM<1.0).Here we give the spectral data for64of them,that looked like ELGs or QSOs.31more 2nd priority candidates were classified as stars or galaxies without emission,and12objects with no emission lines were not classified at all due to poor S/N ratio spectra.3.1.Emission-line galaxiesThe parameters of the126observed emission line galaxies are listed in Table4,containing the following information: column1:Number in the Table.column2:The object’s IAU-type name with the prefix HS. column3:Right ascension for equinox B1950.column4:Declination for equinox B1950.The coordinates were measured on direct plates of the HQS and are accu-rate to∼2′′(Hagen et al.1995).column5:Heliocentric velocity and its r.m.s.uncertainty in km s−1.column6:Apparent B-magnitude obtained by calibration of the digitized photoplates with photometric standard stars(Engels et al.1994),having an r.m.s.accuracy of∼0.m5for objects fainter than m B=16.m0(Popescu et al. 1996).Since the algorithm to calibrate the objective prism spectra is optimized for point sources,the brightnesses of extended galaxies are underestimated.The resulting sys-tematic uncertainties are expected to be as large as2mag (Popescu et al.1996).For about30%of our objects,B-magnitudes are unavailable at the moment.We present for them blue magnitudes obtained from the APM database. They are marked by a“*”before the value in the cor-responding column.According to our estimate they are systematically brighter by0.m92than the B-magnitudes obtained by calibration of the digitized photoplates(r.m.s.1.m02).column7:Absolute B-magnitude,calculated from the ap-parent B-magnitude and the heliocentric velocity.No cor-rection for galactic extinction is made because all objects are located at high galactic latitudes and the corrections are significantly smaller than the uncertainties in the mag-nitudes.column8:Preliminary spectral classification type accord-ing to the spectral data presented in this article.BCG means a galaxy possessing a characteristic H ii-region spec-trum with low enough luminosity(M B≥−20m).SBN and DANS are galaxies of lower excitation with a corre-sponding position in the line ratio diagnostic diagrams, as discussed in Paper I.SBN are the brighter fraction of this type.Here we follow the notation of Salzer et al.(1989).The non-confident classification is followed by”?”.Three objects(HS0807+4103,HS1525+4344, HS1627+3625)were recognized as Sy1galaxies due to the presence of broad Balmer lines and broad[Fe ii]emis-sion.HS1644+3934was recognized as a Seyfert2galaxy. The typical spectrum of low-ionization nuclear emission-line regions(LINERs)is identified for2galaxies.14ELGs are difficult to classify,mainly due to low S/N.They are coded as NON.column9:One or more alternative names,according to the information from NED.References are given to the other sources of the redshift-spectral information indicat-ing that a galaxy is an ELG.The spectra of all emission-line galaxies are shown in Appendix A,which is available only in the electronic ver-sion of the journal.The results of lineflux measurements are given in Table5which contains the following information: column1:Number in the Table.column2:The object’s IAU-type name with the prefix HS.Asterisks refer to the objects observed during non-photometric conditions.column3:Designation of the telescope with which the spectral data were obtained.‘B’means BTA,‘C’-Calar Alto2.2m telescope,and‘M’-MMT.column4:Observedflux(in10−16erg s−1cm−2)of the Hβline.The accuracy of this and other parameters varies substantially over the whole table.We divided the relative errors into four intervals:≤5%,(5–10)%,(10–20)%and(20–50)%.They are marked by the respective superscripts a,b,c and d right of each table entree.ForS.Pustilnik et al.:HSS for emission-line galaxies.VI.Sixth list of126ELGs5about40%of ELGs the Balmer absorptions from the underlying stellar population can somewhat affect the measured Hβemissionflux and the relatedflux ratios. These objects are marked with“†”.For several objects with non-detected Hβemission line,thefluxes are given for Hαand marked by a“‡”.columns5,6,7:The observedflux ratios[O ii]/Hβ, [O iii]/Hβand Hα/Hβ.columns8,9:The observedflux ratios[N ii]λ6583˚A/Hα, and([S ii]λ6716˚A+λ6731˚A)/Hα.columns10,11,12:Equivalent widths of the lines [O ii]λ3727˚A,Hβand[O iii]λ5007˚A.Below we give comments on some specific cases:HS1010+4907and HS1009+4906comprise a compact group(∼50kpc in extent)with a fainter galaxy without evident emission lines,namely HS1010+4906(see Table 7).HS1353+4706was classified as an M-star in Paper I (Ugryumov et al.1999).However,it was suspected that a wrong object had been observed about0.′3away.This object will be referred to as HS1353+4706A.The new ob-servations indeed revealed that HS1353+4706B is a very strong-lined BCG with very low metallicity(12+log(O/H) =7.63±0.03;see Pustilnik et al.2004b).The M-dwarf HS 1353+4706A has B1950coordinates135325.2+470646 and its brightness is B>18.7.Seven galaxies observed with the Calar Alto2.2m tele-scope have Hα,[N ii]or[S ii]lines atλ>7200˚A. Theirfluxes can be affected by the second order con-tamination as pointed out in Sect. 2.3.For these galaxies(1231+4349,1235+4108,1426+3658,1437+3724, 1439+3704,1525+4344and1614+4450)the affected pa-rameters in Table5can be either the ratio F(Hα)/F(Hβ), or the lineflux F(Hα),if Hβwas not detected.For the ratios of F([N ii])/F(Hα)and F([S ii])/F(Hα)the effect should be minor since these lines are close in wavelength.3.2.QuasarsThe main criteria applied to search for BCGs are blue continuum nearλ4000˚A and a strong emission line,the expected doublet[O iii]λ4959,5007˚A,in the wavelength region between5000˚A and the sensitivity break of the Kodak IIIa-J photoemulsion near5400˚A(see Paper I). For this reason faint QSOs with Lyαλ1216˚A redshifted to z∼3,or with C ivλ1549˚A redshifted to z∼1.7, or with Mg iiλ2798˚A redshifted to z∼0.8could be se-lected as BCG candidates.In Papers I–V we reported the discovery of a number of such faint QSOs.They were missed by the Hamburg Quasar Survey since it is re-stricted to bright QSOs(B≤17−17.5).Here we re-port the discovery of eight faint(B≥17.5)QSOs.For four of them we identified Lyαλ1216˚A redshifted to z∼3as the line responsible for its selection.Two ob-jects(HS1608+3546and HS1714+4202)show a broad emission line tentatively identified as Mg iiλ2798˚A at z∼0.83–0.84.Two more quasars with z∼1.7were selected due to the line C ivλ1549˚A.Since for HS1203+3811only one broad line is seen in a rather poor S/N ratio spec-trum,its identification as Lyαshould be considered as tentative.The data for all eight quasars are presented in Table6.Finding charts and plots of their spectra can be found on the www-site of the Hamburg Quasar Survey (http://www.hs.uni-hamburg.de/hqs.html).3.3.Non-emission-line objectsIn total,for49candidates no(trustworthy)emission lines were detected.We divided them into three categories. 3.3.1.Absorption-line galaxiesFor nine non-emission line objects the signal-to-noise ra-tio of our spectra was sufficient to detect absorption lines, allowing the determination of redshifts.The data are pre-sented in Table7.3.3.2.Stellar objectsTo separate the stars among the objects with no detectable emission lines,we cross-correlated a list of the most com-mon stellar features with the observed spectra.In total, 26objects with definite stellar spectra and redshifts close to zero were identified.All of them were crudely classified in categories from definite A-stars to G-stars,with most of them intermediate between A and F.The data for these stars are presented in Table8.3.3.3.Non-classified objectsIt was not possible to classify13objects without emis-sion lines.Their spectra have too low signal-to-noise ratio to detect trustworthy absorption features,or the EWs of their emission lines are too small.4.Discussion4.1.The sixth listAs a result we have182observed candidates preselected on HQS objective prism plates,out of which76werefirst pri-ority candidates and106were second priority.134objects (73%of the total)are found to be either ELGs(126)or quasars(8).24of these ELGs were presented in the previ-ous HSS papers,and were reobserved in order to improve the data quality.Seventy two out of126ELGs(∼57%)were classified based on the character of their spectra and their luminos-ity as H ii/BCGs or probable BCGs.14ELGs are difficult to classify due to their poor signal-to-noise spectra.Six more ELGs were classified as Active Galactic Nuclei(AGN):4as Seyfert galaxies and2 as LINERs.The remaining33ELGs are objects with low6S.Pustilnik et al.:HSS for emission-line galaxies.VI.Sixth list of126ELGsexcitation:either starburst nuclei galaxies(SBN and prob-able SBN)or their lower mass analogs–dwarf amorphous nuclear starburst galaxies(DANS or probable DANS). 4.2.Brief summary of the HSS for ELGs Summarizing the results of the Hamburg/SAO survey pre-sented in Papers I through VI,we discovered altogether, from the1-st priority candidates,463new emission-line objects(26of them are QSOs).For100more ELGs known from the literature(NED)we obtained quantitative data for their emission lines.The total number of confident or probable blue compact/H ii-galaxies is387.Relative to all observed537ELGs the fraction of BCGs is∼72%.42more new BCGs and56other ELGs are found among the second priority candidates.Along with the BCGs selected from the HSS candidates,but not observed by us since they already were known from other surveys in this region,the total number of BCGs in the sky re-gion covered by the HSS(∼1700sq.degrees of a single piece of sky)reaches∼500.This constitutes the largest and deepest BCG sample in both hemispheres and will be presented elsewhere as a separate publication.The as-sembly and verifying of the whole HSS database is under-way,and the most up-dated version of this will appear at: http://precise.sao.ru.In Figure1(a-d)we show the distributions of ra-dial velocities,apparent and absolute magnitudes and EWs([O iii]5007)for all found BCGs or BCGs?in the zone of HSS(506objects,including also the galaxies,selected by us as the HSS candidates,but not observed in this project due to lack of observing time;these objects were already known/classified and had redshift data).The lat-ter group comprises about70galaxies which came mainly from the papers by Peimbert&Torres-Peimbert(1992), Vogel et al.(1993),Popescu et al.(1996,1997,1998), Ugryumov et al.(1998),Popescu&Hopp(2000)and some unpublished data on BCGs in the SBS zone,partly inter-secting the HSS zone.Since for most of the sample galaxies the total B-band magnitudes are not available,we used their photographic blue magnitudes from the Palomar Sky Survey,as pro-vided in the APM database(Automatic Plate-measuring Machine at Cambridge,Irwin1998),and calibrated them through the sample of about a hundred BCGs with CCD-measured total B magnitudes.We obtained the linear re-gression of:B CCD=0.429×B APM+10.51,(1) in the range of B APM from14to19.5,with the standard deviation of residuals of0.43mag.These B magnitudes were used as afirst approximation to more accurate data in order to estimate absolute magnitudes and to look at the distributions of the sample galaxies of these parame-ters.The distributions shown in Figure1have the char-acteristics presented in Table 3.A rough estimate of Table3.Characteristics of the HSS BCG sampleB tot(mag)50617.6617.8116.51,18.59 M B(mag)506–17.25–17.40–15.40,–18.89 V hel(km s−1)506847187522695,14976 EW(5007)(˚A)50212211333,524S.Pustilnik et al.:HSS for emission-line galaxies.VI.Sixth list of126ELGs7 Fig.1.Distributions of the BCG sample in the zone of HSS of a)total B-magnitude,b)absolute B-magnitude,c) radial velocity and d)equivalent width of[O iii5007]line.2004b).Some of the strong-lined HSS BCGs were used in the new primordial helium determination(Izotov&Thuan 2004).One of the goals of the HSS project was to search for new extremely metal-deficient(XMD)BCGs(those with12+log(O/H)≤7.65),possible analogs of candi-date young galaxies,like I Zw18and SBS0335–052. Altogether,in addition to the two XMD galaxies in this zone known from previous studies(1415+437=CG389 and1224+3756=CG1024),eight new such galaxies are found(see papers by Kniazev et al.1998,2000a,2000b, Pustilnik et al.2004a,2004b,Guseva et al.2003).Thus, the fraction of XMD BCGs at the magnitude limit of the HSS is∼2%(as already claimed by Pustilnik et al. 2003),about∼1.5times higher than the fraction found by Kniazev et al.(2003)for the Sloan Digital Sky Survey (SDSS).While we are dealing with small samples in ei-ther case,which makes this ratio uncertain,the ratio still indicates that we succeeded in creating a design for the HSS which is more sensitive infinding XMD BCGs than general galaxy surveys like the SDSS.5.ConclusionsWe performed the follow-up spectroscopy of the sixth and last list of candidates for ELGs(mainly of H ii type)from the Hamburg/SAO Survey.Summarizing the results,the analysis of the spectral information and the discussion above we draw the following conclusions:–The methods to detect ELG candidates on the plates of the Hamburg Quasar Survey give a reasonably high detection rate of H ii type emission-line objects.In to-tal,within the two defined priority categories,182ob-jects were observed,27of which were already known as ELGs.Among the remaining155objects we found 107emission-line objects corresponding to a detection rate of∼68%.–Besides ELGs we also found8new quasars,with either Lyα,or C ivλ1549,or Mg iiλ2798in the wavelength region4950−5100˚A near the red boundary of the IIIa-J photoplates(z∼3,1.7and0.8,respectively).–The fraction of BCG/H ii galaxies among all new ob-served ELGs(about43%)is lower in this paper com-pared to the previous parts of the HSS since about 2/3of the observed candidates came from the second priority list.–This list completes the classification work on the strong-lined ELGs in the zone of the Hamburg/SAO survey.Together with previously-known BCG/H ii galaxies in this zone,this sample of∼500objects is the largest one made to date in a well bound region.8S.Pustilnik et al.:HSS for emission-line galaxies.VI.Sixth list of126ELGsAcknowledgements.This work was supported by the grant of the Deutsche Forschungsgemeinschaft No.436RUS17/77/94 and by the Russian Federal Program”Astronomy”.U.A.V. is very grateful to the staffof the Hamburg Observatory for their hospitality and kind assistance.Support by the INTAS grant No.96-0500is gratefully acknowledged.I.M.and J.M. acknowledgefinancial support by DGICyT grants AYA2001-2089and AYA2003-00128and the Junta de Andaluc´ıa.The authors thank the anonymous referee for useful comments and suggestions.The use of APM facility was very impor-tant for selection methods for additional candidates to BCGs from the2nd priority list.This research has made use of the NASA/IPAC Extragalactic Database(NED)which is oper-ated by the Jet Propulsion Laboratory,California Institute of Technology,under contract with the National Aeronautics and Space Administration.We have also used the Digitized Sky Survey,produced at the Space Telescope Science Institute un-der government grant NAG W-2166.ReferencesAfanasiev,V.L.,Burenkov,A.N.,Vlasyuk,V.V.,Drabek,S.V.1995,SAO RAS internal report,No.234Alonso,M.S.,Tissera,P.B.,Coldwell,G.&Lambas,D.G.2004, MNRAS,352,1081Bade,N.,Engels,D.,Voges,W.,et al.1998,A&AS,127,145 Bohlin,R.C.1996,AJ,111,1743Engels,D.,Cordis,L.,&K¨o hler,T.1994,Proc.IAU Symp.161,ed.H.T.MacGillivray(Kluwer:Dordrecht),317 Gottl¨o ber,S.,Lokas, E.,Klypin, A.,Hoffman,Y.2003, MNRAS,344,715Grupe,D.,Beuermann,K.,Thomas,H.-C.,Mannheim,K., Fink,H.H.1998,A&A,330,25Guseva,N.G.,Papaderos,P.,Izotov,Y.I.,et al.2003,A&A, 407,91Hagen,H.-J.,Groote,D.,Engels,D.,&Reimers,D.1995, A&AS,111,195Hopp,U.,Engels,D.,Green,R.,et al.2000,A&AS,142,417 (Paper III)Huchra,J.P.,Geller,M.J.,&Corwin,H.G.Jr.1995,ApJS,99, 391Irwin,M.1998,/∼apmcat/ Izotov,Y.I.,&Thuan,T.X.2004,ApJ,602,200Kniazev,A.Y.,&Shergin,V.S.1995,SAO RAS internal report, 249,1Kniazev,A.Y.,Pustilnik,S.A.,Ugryumov,A.V.1998,Bulletin SAO,46,23Kniazev,A.Y.,Pustilnik,S.A.,Ugryumov,A.V.,&Kniazeva, T.F.2000a,Astronomy Letters,26,129Kniazev, A.Y.,Pustilnik,S.A.,Masegosa,J.,et al.2000b, A&A,357,101Kniazev,A.Y.,Engels,D.,Pustilnik,S.A.et al.2001,A&A, 366,771(Paper IV)Kniazev,A.Y.,Grebel,E.K.,Lei Hao,et al.2003,ApJ,593, L73Kniazev, A.Y.,Pustilnik,S.A.,Grebel, E.K.,Lee,H.,& Pramskij,A.G.2004,ApJS,153,429Lambas,D.G.,Tissera,P.B.,Alonso,M.S.,&Coldwell,G.2003,MNRAS,346,1189Markarian,B.E.,Lipovetsky,V.A.,&Stepanian,J.A.1983, Afz,19,29Mathis,H.&White,S.D.M.2002,MNRAS,337,1193 Oke,J.B.1990,AJ,99,1621Peimbert,M.,&Torres-Peimbert,S.1992,A&A,253,349 Pesch,P.,Stephenson,C.B.,&MacConnell,D.J.1995,ApJS, 98,41Popescu,C.C.,&Hopp,U.2000,A&AS,142,247 Popescu,C.C.,Hopp,U.,Hagen,H.-J.,&Els¨a sser,H.1996, A&AS,116,43Popescu,C.C.,Hopp,U.,&Els¨a sser,H.1997,A&A,325,881 Popescu, C.C.,Hopp,U.,Hagen,H.-J.,Els¨a sser,H.1998, A&AS,133,13Pustilnik,S.A.,Ugryumov,A.V.,Lipovetsky,V.A.,Thuan, T.X.,&Guseva,N.G.1995,ApJ,443,499Pustilnik,S.A.,Engels, D.,Ugryumov, A.V.,et al.1999, A&AS,135,299(Paper II)Pustilnik,S.A.,Kniazev,A.Y.,Lipovetsky,V.A.,&Ugryumov,A.V.2001,A&A,373,24Pustilnik,S.A.,Kniazev,A.Y.,Pramskij,A.G.,&Ugryumov,A.V.2003,Proc.of Euroconference”The evolution ofgalaxies.III.From simple approaches to self-consistent models”,Kiel,Germany,July2002,ApSS,284,795 Pustilnik,S.A.,Kniazev,A.Y.,Pramskij,A.G.et al.2004a, A&A,419,469Pustilnik,S.A.,Kniazev,A.Y.,Pramskij,A.G.,et al.2004b, A&A,in preparationSalzer,J.J.1989,ApJ,347,152Salzer,J.J.,MacAlpine,G.M.,&Boroson,T.A.1989,ApJS, 70,479Salzer,J.J.,Moody,J.W.,Rosenberg,J.L.,Gregory,S.A.,& Newberry,M.V.1995,AJ,109,2376Salzer,J.J.,Gronwall,C.,Lipovetsky,V.A.,et al.2000,AJ, 120,80Schneider,D.P.,Schmidt,M.,Gunn,J.E.1994,AJ,107,1245 Stepanian,J.A.1994,Proc.IAU Symp.161,ed.H.T.MacGillivray(Kluwer:Dordrecht),731Ugryumov, A.V.,Pustilnik,S.A.,Lipovetsky,V.A.,Izotov, Y.I.,&Richter,G.M.1998,A&AS,131,295 Ugryumov,A.V.,Engels,D.,Lipovetsky,V.A.,et al.1999, A&AS,135,511(Paper I)Ugryumov,A.V.,Engels,D.,Kniazev,A.Y.et al.2001,2001, A&A,374,907(Paper V)Vogel,S.,Engels,D.,Hagen,H.-J.,et al.1993,A&AS,98,193。
The dark side of star formation in galaxy clusters spectroscopic follow-up of clusters obse
a rXiv:as tr o-ph/1157v12Oct21**TITLE**ASP Conference Series,Vol.**VOLUME**,**PUBLICATION YEAR****EDITORS**The dark side of star formation in galaxy clusters:spectroscopic follow-up of clusters observed with ISOCAM Dario Fadda Instituto de Astrofisica de Canarias,Via Lactea S/N,E-38200La Laguna,Tenerife -Spain Pierre-Alain Duc CNRS (URA 2052),CEA Service d’astrophysique,F-91191Gif-sur-Yvette Cedex,France Abstract.The evolution of galaxies in cluster environments can be studied using mid-IR observations which trace star forming regions hidden by dust.The optical follow-up of A1689(z=0.2),observed at 6.7and 15µm by ISOCAM,have revealed a systematic excess of the B-[15µm]galaxy color distribution with respect that of Coma and Virgo clusters.This result suggests the existence of a dark side of the Butcher-Oemler effect measured in the optical.We present an analysis of the optical/mid-IR properties of the mid-IR emitters in A1689,comparing in particular the star formation rates based on mid-IR and optical data.Morover,we present preliminary result for J1888,a cluster at z =0.56deeply observed with ISOCAM,based on recent VLT/FORS and NTT/SOFI observations.1.Introduction Since the classical study of Butcher &Oemler (1984)who put in evidence an increasing fraction of blue,presumably star-forming,galaxies as a function ofcluster redshift,several authors have tried to estimate the importance of the cluster environment on the evolution of cluster galaxies.Recent studies with sample of distant clusters (Dressler et al.1999,Balogh et al.2000)pointed out that the star formation rate (SFR)per cluster galaxy appears to be lower than that in similar types of galaxies in the surrounding field.The main drawback of these studies is that the SFR rely on measurements of optical line fluxes (usually[OII]or in a few cases H α)which suffer from strong dust extinction.Since dust obscuration depends on object types and on environmental conditions,it is impossible to correct it on average.On the other hand,although galaxies affected by extinction show typical spectral features (see Dressler et al.1999),it is quite impossible to quantify the total SFR on the basis of the optical data alone.Mid-IR surveys,along with radio centimetric fluxes,provide the best estimates of the dust obscured SFR (see e.g.Chary &Elbaz 2001)when far-IR are not available.For this reason a sample of 10clusters at different redshift (0.1<z <0.9)has been observed with the ISOCAM camera on-board ISO.We12Fadda &Duc)IR log ( SFR [O I I ]/ S F R I R S F R 00.20.40.60.81 1.220401201008060e(b)e(c)e(a)e(a)e(a)e(a)Sy1k(e)k Figure 1.Ratio of the mid-IR to optical SFR estimates versus the mid-IR based SFR estimate for A1689.Note the high dust extinction in some apparently passive galaxies (’k’type).present here the optical/mid-IR properties of the galaxies detected at 15µm in the A1689cluster (see Fadda et al.2000for ISOCAM data)and preliminar results of the VLT follow-up program of J1888,a cluster at z =0.56deeply observed with ISOCAM.2.Hidden star formation in A1689Using available images (HST and NTT)and about 100spectra measured with the NTT (Duc et al.2001),we studied membership,morphologies and spec-tral types of the objects detected by ISOCAM in A1689.Our analysis confirms the high fraction of blue galaxies in the cluster (already detected by Butcher &Oemler 1984)relying on a secure cluster membership of the galaxies (spec-troscopic and photometric redshifts are known for all the galaxies observed).Most of the 15µm sources are luminous,blue,emission-line or morphologically disturbed galaxies,i.e.a population of galaxies usually associated with the “Butcher–Oemler”effect.However,∼30%of the 15µm sources do not show any sign of star-formation activity in their optical spectrum.More of 70%of the emission-line galaxies in our spectroscopic sample are detected at 15µm and all the galaxies classified as dusty starbursts (“e(a)”type in Dressler et al.1999)are 15µm sources.On the contrary,none of the galaxies with a post-starburst optical spectrum have been detected at 15µm.Since the AGN activity is very low in A1689,the 15µm flux is a reli-able tracer of the dust-obscured star formation activity (see Chary &Elbaz 2001).Comparing the SFR based on the mid-IR (15µm flux)and optical ([OII]line flux),we found that for galaxies with mid-IR emission the ratioAPS Conf.Ser.Style3Figure2.15µm map of J1888with more than100sources detected.Subsets show15µm overlays on optical images.Note the excellentastrometric precision of ISOCAM and the clear optical identifications. SFR(IR)/SFR(Opt)is very high and ranges between10and100,being the high-est among“e(a)”galaxies(see Figure1).The median SFR(IR)is2M⊙yr−1, while the median SFR(Opt)of the[OII]detected galaxies is0.2M⊙yr−1.Al-though we are not observing luminous infrared galaxies(the highest total IR luminosity6.2×1010L⊙is measured in a“e(a)”galaxy),we conclude that a significant portion of the star formation activity is visible only using mid-IR data.At least90%of the star formation is missed when estimated from the [OII]line.A comparison with thefield,essential to investigate the effects of the environment on the star formation of the cluster galaxies,will be possible only when a statistical sample of mid-IR galaxies for the coevalfield of A1689will be available.3.Preliminary results in J1888J1888,a cluster at z=0.56,has been surveyed by ISOCAM at the same depth of the Hubble Deep Field covering a strip of14.5′×3.5′crossing the cluster center in order to explore possible variation of the mid-IR properties with the cluster-centric distance(see Figure2).We have recently obtained about120spectra4Fadda&Ducwith VLT/FORS1and a Ks image with NTT/SOFI,which complements B and R images obtained with the2.2m ESO telescope.So far we have redshifts for 55out of70sources detected at15µm and22out of47sources detected at6.7µm.The redshift distribution of the cluster,which appears very loose in the optical images,peaks at z=0.56but thefield is highly polluted by background galaxies.Considering the range of magnitudes of the cluster members(21.4 <B<25.3),55%of the galaxies do not belong to the cluster.Considering only the15µm sources,only30%of the ISOCAM sources are cluster members.The color-magnitude relation is not obvious to determine even for cluster members.Quite surprisingly there is a large number of“red outliers”(B−R>2)which belong to the cluster and most interestingly several of them are detected at15µm.The presence of“red outliers”is not uncommon in clusters at z∼0.5−0.6(see e.g.Margoniner&de Carvalho2000)but in this case any contamination byfield galaxies is ruled out.Contrary to the case of A1689,we have almost no mid-IR emitters among blue cluster members.On the basis of VLT spectra we did a classification of galaxies according to the scheme of Dressler et al.(1999).As in the case of A1689,we detect at15µm all the dusty starbursts(“e(a)”type)and no post-starburst galaxies. Compared to A1689,we detect a larger fraction of spiral-like spectra which is not unexpected for clusters showing the“Butcher-Oemler”effect.A detailed reanalysis of the J1888ISOCAM data is now in progress using the new method developed by Lari et al.(2001)in parallel with the analysis of the deep ISOCAM surveys in the region of the Lockman Hole.The comparison of the data from this survey,whose redshift distribution peaks at redshift of 0.6close to that of J1888,will be fundamental to study the influence of cluster environment on the evolution of galaxies.ReferencesBalogh,M.L.,Morris,S.L.,Yee,H.K.C.et al.1999,ApJ,527,54 Butcher,H.&Oemler,A.Jr.1984,ApJ,285,426Chary,R.&Elbaz,D.2001,ApJ,556,562Dressler,A.,Smail,I.,Poggianti,B.M.et al.,2000,ApJS,122,51Duc,P.-A.,Poggianti,B.-M.,Fadda,D.et al.,2001,A&A,submitted Fadda,D.,Elbaz,D.,Duc,P.-A.et al.2000,A&A,361,827Lari,C.,Pozzi,F.,Gruppioni,C.et al.,2001,MNRAS,325,1173 Margoniner,V.E.&de Carvalho,R.R.2000,AJ,119,1562。
关于太空的知识英语作文
关于太空的知识英语作文Title: A Journey into the Wonders of SpaceSpace, the boundless expanse that extends beyond our planet Earth, has always captivated humanity's imagination. From the ancient astronomers who mapped the constellations to modern astronauts exploring the cosmos, our fascination with the unknown realms of space has only grown stronger.Introduction:The study of space, known as astronomy, has provided us with invaluable insights into the universe. It has allowed us to understand our place in the cosmos and unravel the mysteries of the celestial bodies that surround us. This essay aims to explore some fascinating aspects of space and our quest to conquer the final frontier.The Solar System:Our solar system, a tiny speck within the vastness of the Milky Way galaxy, consists of eight planets, numerous moons, asteroids, and comets. Each planet has unique characteristics and features. For instance, Mars, often called the \'Red Planet,\' has intrigued us with its potential to support life, while Jupiter's massive size and stunning ring system make it a captivating sight.The Sun:At the heart of our solar system lies the Sun, a massive ball of hotplasma that sustains life on Earth. It provides light and heat, making it the primary source of energy for our planet. Solar flares and sunspots are some of the fascinating phenomena associated with the Sun, offering valuable insights into its complex nature.Stars and Galaxies:Billions of stars populate the night sky, each with its own story to tell. From red giants to white dwarfs, stars come in various sizes and stages of life. They are often found in clusters or galaxies, such as our own Milky Way. Galaxies, with their intricate structures and beautiful spiral arms, are home to countless stars, planets, and other celestial objects.Black Holes:Black holes, one of the most intriguing aspects of space, are regions where gravity is so strong that nothing, not even light, can escape. These enigmatic entities continue to puzzle scientists and have led to groundbreaking discoveries about the nature of the universe.The Search for Extraterrestrial Life:The question of whether we are alone in the universe has driven the search for extraterrestrial life. Scientists have discovered exoplanets, worlds beyond our solar system, that could potentially support life. Missions like the Kepler Space Telescope and the upcoming James Webb Space Telescope are dedicated to finding signs of life in the cosmos.Conclusion:Space exploration is a testament to human curiosity and ingenuity. It has not only expanded our knowledge of the universe but also inspired generations to dream big and push the boundaries of what is possible. As we continue to explore the wonders of space, we may soon unlock the secrets of the cosmos and perhaps find answers to some of life's most profound questions.。
Medium-distant clusters of galaxies seen by ISO
a r X i v :a s t r o -p h /9811467v 1 30 N o v 1998MEDIUM-DISTANT CLUSTERS OF GALAXIES SEEN BY ISO ∗L.Lmonon,M.Pierre,C.J.Cesarsky,D.Elbaz,L.VigrouxDAPNIA/SAp,CEA Saclay,FranceABSTRACTWe present a comprehensive study of ISO cluster galaxies in connection with other wavelengths.First results show that infrared galaxies detected by ISO-CAM concentrate on the edge of clusters.Surpris-ingly,they are not emission lines galaxies but very lu-minous elliptical,merging or interacting ones,which suggests non-trivial connections between star forma-tion rate,optical and mid-IR properties.However,no correlation has been found between the MIR/optical star formation properties of the galaxies,so that the exact origin of the IR emission remains unclear.Key words:ISO;infrared astronomy;galaxy clusters.1.INTRODUCTIONUntil recently,detailed cluster studies were restricted to nearby clusters (z <0.1).Nowadays,new imaging as well as spectroscopic capabilities (visible,X-ray,IR,radio)have considerably improved our view of the distant universe.In this context,we have selected a sample of ten bright objects,expected to be rich clusters,from the ROSAT All Sky Survey (RASS)in the z =0.15−0.3range in order to investigate issues ranging from cluster formation and evolution down to a local phenomenon such as the enrichment of the ICM (Pierre et al.1994).We have undertaken a detailed high-resolution multi-wavelength follow-up including ROSAT HRI and PSPC,ASCA pointing-s,radio images at 3,6,13,20and 36cm and ex-tensive photometry and spectroscopy in the optical.Seven of them were included in the ISO Central Pro-gram (DEEPXSRC,30hours,P.I.: C.J.Cesarsky;Collaborator:M.Pierre),in order to study the influ-ence of the environment on the galaxy evolution.We present here the analysis which allowed us to statis-tically determine properties of IR emitting galaxies in our clusters.Table1.DEEPXSRC ISOCAM observations.The column are:(1)the object name from the ACO cata-logue(Abell et al.1989)when existing or the ROSAT All Sky Survey number.(2)the redshift of the object.(3)the size of the side of the maximum sensitivity box area.(4)the sensitivity in the LW2(6.75µm) CAMfilter.(5)the sensitivity in the LW3(15µm) CAMfilter(RXJ1314-2516was not observed in the LW3band).Abell13000.3076.4′5001400RXJ1104-23300.1876.4′4501000Abell17320.1936.4′4001000Abell11110.1656.4′5001300RXJ1032-26070.2474.8′7501500RXJ1314-25160.2444.8′500-RXJ1315-42360.1059.6′7501100Figure2.The6.75µm(µJy)luminosity in function of the I absolute magnitude for objects detected only at6.75µm.Four galaxies are well outside the gen-eral trend,they must befield galaxies or dusty/star-forming objects.4.5.Effects Of The Environmental ConditionsIt could be a correlation between the number of de-tect galaxies at6.75µm and the X-ray luminosity in the[0.1-2.4keV]band(L99).Since the X-ray lu-minosity is related to the richness of the clusters, this corroborates the suggestion of section4.3.as most LW2galaxies are luminous early-type galaxies. Other effects of environmental conditions are very hard to point out because of our low statistic(be-tween4and15galaxies detected by ISOCAM per cluster).4.6.Optical Correlations With Star-FormingGalaxiesIn the course of our optical follow-up,we have dis-covered that detected ISOCAM galaxies in medium distant clusters(at a sensitivity of∼1mJy)are not emission lines galaxies but very luminous ellipti-cal,merging or interacting ones,which suggests non-trivial connections between star formation rate,op-tical and mid-IR properties(see Figure3).However, the spectral resolution at which the redshift of these galaxies were measured(15˚A)does not allow us to identify any peculiar signature in the optical spec-tra of these objects,so that the exact origin of the IR emission remains unclear.This observation be-came a very scheming subject since IR deep surveys claim the existence of a population of galaxies with great IRfluxes in the past(0.6<z<1)with no peculiar optical signature(Elbaz et al.1998,Aussel et al.1998)and could be a new starting point to the comprehension of the stars formation history.ACKNOWLEDGMENTSThe ISOCAM data presented in this paper was anal-ysed using”CIA”,a joint development by the ESA Astrophysics Division and the ISOCAM Consortium. The ISOCAM Consortium is led by the ISOCAM PI, C.Cesarsky,Direction des Sciences de la Matiere, C.E.A.,France.REFERENCESAbell,G.O.,Corwin,H.G.,Olowin,R.P.,1989,ApJS 70,1Aussel,H.,Cesarsky,C.,Elbaz, D.,Starck,J.L., 1998,A&A in press,astro-ph/9810044 Dressler,A.,1980,ApJ326,351Elbaz,D.et al.,1998,”NGST”34th Liege Astro-physics Colloquium,eds.Benvenuti P.et al.,ESA Pub.,astro-ph/9807209Fadda,D.&Elbaz,D.,1999,this bookLmonon,L.,Pierre,M.,Hunstead,H.,Reid,A.,Mel-lier,Y.,B¨o hringer,H.,1997,A&A326,34 Lmonon,L.,Pierre,M.,Cesarsky,C.J.et al.,1999, in preparationLmonon,L.,1999,PhD.thesis,University of Paris XI,FrancePierre,M.,B¨o hringer,H.,Ebeling,H.,Voges,W., Schuecker,P.et al.,1994,A&A290,725 Pierre,M.,Aussel,H.,Altieri,B.et al.,1996,A&AL 315,L297Reid,A.D.,Hunstead,R.W.,Lmonon,L.,Pierre,M., 1998,MNRAS acceptedRowan-robinson,M.et al.,1999,this bookraiesraiesraiesraiesraiesraiesA1A2A3A412B1B2B3raiesraiesFigure 3.Abell 1300,a post-merging cluster (Lmonon et al.1997,Reid et al.1998).On the R band image takenon the CFHT are overlaid in red contours X-ray [0.4-2.4KeV]PSPC levels (8.3×10⁻⁴,and 1.8×10⁻³to 6×10⁻²by step of 5.76×10⁻³counts/s/arcmin 2)and in green radio (1.4GHz)ATCA levels (0.2,0.3,0.5,0.9,1.6,3.2and 6mJy/beam).It confirms that detected ISOCAM galaxies (in magenta and blue for respectively 6.75µm and 15µm bands,circle for galaxies and squares for point-like objects,with size proportional to emitting fluxes)in clusters above a limited flux are not galaxies with emission lines but very luminous elliptical,merging or interacting galaxies (Pierre et al.1996).Line-emitting galaxies are pointed by the ”RAIES”label.Abell 1300contains the most distant radio halo known (A4)and a relic radio source (B3).This is one out of our seven objects,others are available in L99.。
宇宙到底有多大,震撼了!
►dark matter n 暗物质 ►helium [ˈhiːliəm] n 氦
百科知识
Light year 光年 天文学上的一种距离单位。光在真空中1年内走过的路程为1光年,约等于是一个更大的多重宇宙中许多 因果关系不相连的组成部分之一,而这个多重宇宙本身就包含了所有 的空间、时间及其物质。
►multiverse [ˌmʌltɪˈvɜːs] n 多重宇宙 ►hypothesis [haɪˈpɒθəsɪs] n (有少量事实依据但未被证实的)假说 ►constituent [kənˈstɪtjuənt] adj 组成的;构成的 ►comprise [kəmˈpraɪz] v 包含
The Universe
视频欣赏:
The universe is all of space and time and their contents, including planets, stars, galaxies, and all other forms of matter and energy. While the spacial size of the entire universe is unknown, it is possible to measure the size of the observable universe, which is currently estimated to be 93 billion light years in diameter.
1. What is the text mainly talking about? A. The galaxies in the universe. B. The formation of the universe. C. The development of the universe. D. The brief introduction of the universe.
- 1、下载文档前请自行甄别文档内容的完整性,平台不提供额外的编辑、内容补充、找答案等附加服务。
- 2、"仅部分预览"的文档,不可在线预览部分如存在完整性等问题,可反馈申请退款(可完整预览的文档不适用该条件!)。
- 3、如文档侵犯您的权益,请联系客服反馈,我们会尽快为您处理(人工客服工作时间:9:00-18:30)。
a rXiv:as tr o-ph/51117v17Jan25EMISSION LINE GALAXIES IN CLUSTERS Bianca M.Poggianti INAF-Osservatorio Astronomico di Padova -Italy poggianti@pd.astro.it Abstract At the present epoch,clusters of galaxies are known to be a hostile environment for emission-line galaxies,which are more commonly found in low density re-gions outside of clusters.In contrast,going to higher redshifts the population of emission-line galaxies in clusters becomes progressively more conspicuous,and large numbers of star-forming late-type galaxies are observed.I present an overview of the observational findings and the theoretical expectations regard-ing the evolution of emission-line galaxies in dense environments,discussing the properties of these galaxies and the current evidence for environmental in-fluences on their evolution.Keywords:Galaxy evolution;Star-forming galaxies;Clusters of galaxies Introduction This review focuses on galaxies with emission lines in their optical spectra.In the great majority of cases,at least in clusters,an emission-line galaxy can be assumed to be currently forming stars 1,thus the subject of this contribu-tion is essentially the whole population of cluster galaxies with ongoing star formation at any given epoch.One of the major goals of current studies ofgalaxy formation and evolution is to understand when each galaxy formed or will form its stars,and why.Naturally,star-forming galaxies are at the heart of this investigative effort.Knowing their frequency and their evolution as a function of the environment is fundamental to trace the evolution of the star formation activity with redshift and to start gaining insight on the processes that regulate such activity.This is an area of research that really encompasses “many scales”of the Universe,from the star formation on the scale of a single star-forming region within a galaxy,to the integrated properties on a galaxy scale,to a galaxy-cluster scale and to the evolution of the global star formation history on a cosmic scale.I will briefly touch upon each of these scales and I will focus on the following main questions:how many emission line galaxies are there in clusters,at different redshifts?What are their properties (star formation rates,2Hubble types,gas content)?What is their fate?How do they evolve and why? And,finally,what can they teach us about galaxy formation and evolution in general?1.High redshiftStar formation activityAt any given redshift,the properties of cluster galaxies display a large clus-ter to cluster variance.The“average galaxy”in the Coma cluster looks quite different from the“average galaxy”in the Virgo cluster,thefirst cluster being dominated by passively evolving,early-type galaxies,and the second one hav-ing a larger population of star-forming spirals.Moreover,clusters of galaxies, far from being closed boxes,continuously“form”and evolve accreting single galaxies,pairs,groups,or merging with other clusters.The galaxy content of a cluster thus changes with redshift.Keeping these two things in mind,it is possible to look for evolutionary trends with redshift.Historically,thefirst evidence for a higher incidence of star-forming galax-ies in distant clusters compared to nearby clusters came from photometric stud-ies(Butcher&Oemler1978,1984,Ellingson et al.2001,Kodama&Bower 2001).Spectroscopy is of course the most direct way to identify emission–line galaxies.For distant galaxies,the Hαline is redshifted at optical wavelengths that are severely affected by sky or in the near-IR,thus the feature most com-monly used is the[O ii]λ3727line.In the MORPHS sample of10clusters at z∼0.4−0.5,the fraction of emission–line galaxies is∼30%for galaxies brighter than M V=−19+ 5log h−1(Dressler et al.1999,Poggianti et al.1999).In the CNOC cluster sample,at an average redshift z∼0.3,this fraction is about25%(Balogh et al. 1999).This incidence is much higher than it is observed in similarly rich clus-ters at z=0(Dressler,Thompson&Shectman1988).Significant numbers of emission-line galaxies have been reported in virtually all spectroscopic surveys of distant clusters(Couch&Sharples1987,Fisher et al.1998,Postman et al. 1998,2001).The importance of the[O ii]emission can also be assessed from cluster composite spectra,that are obtained summing up the light from all galaxies in a given cluster to produce a sort of“cluster integrated spectrum”(Fig.1, Dressler et al.2004).As expected,the strength of[O ii]in these composite spectra displays a large cluster–to–cluster variation at any redshift,but there is a tendency for the z=0.5clusters to have on average a stronger composite EW([O ii])than the clusters at z=0.If numerous observations indicate that emission–line galaxies were more prominent in clusters in the past than today,and if these results are unsurprising given the evolution with z of the star formation activity in the general“field”,Emission line galaxies in clusters 3370038003900400041004200Figure 1.From Dressler et al.(2004)posite spectra of five clusters at z ∼0.5(top five)and five clusters at z ∼0(bottom five).The [O ii ]line is generally more prominent in the high-z spectra.Right.Equivalent widths of [O ii ]versus H δas measured from composite spectra of clusters at z ∼0.4−0.5(crosses)and clusters at z ∼0(filled dots).quantifying this evolution in clusters has proved to be very hard.The fact that the emission–line incidence varies strongly from a cluster to another at all redshifts,and the relatively small samples of clusters studied in detail at different redshifts,have so far hindered our progress in measuring how the fraction of emission–line galaxies evolves with redshift as a function of the cluster properties.Discriminating between cosmic evolution and cluster–to–cluster variance is a problem also for H αcluster–wide ing narrow–band imaging or multiplex multislit capabilities,a handful of clusters have been studied to date at z ≥0.2(Couch et al.2001,Balogh et al.2002a,Finn et al.2004,and submitted,Kodama et al.2004,Umeda et al.2004).These studies have con-firmed that the fraction of emission–line (H α–detected,in this case)galaxies is lower in clusters than in the field at similar redshifts,and have shown that the bright end of the H αluminosity function does not seem to depend strongly on environment.As shown in Fig.2,the number of clusters studied is still insufficient to pin down the star formation rate (SFR)per unit of cluster mass as a function of redshift AND of global cluster properties such as the cluster velocity dispersion.4Figure2.From Finn et al.(2004).Star formation rate per unit of cluster mass,as measured from Hαnarrow-band imaging,as a function of redshift(left)and cluster velocity dispersion (right).A word of caution is compulsory when using emission–lines and assuming they provide an unbiased view of the evolution of the star formation activity in cluster galaxies.There are several indications that dust extinction is in fact important and strongly distorts our view of the star formation activity in at least some cluster galaxies.Evidence for dust arises from optical spectroscopy itself,whichfinds many dusty starbursting or star–forming galaxies with rel-atively weak emission–lines both in distant clusters and in thefield at similar redshifts(Poggianti et al.1999,Shioya et al.2000,Poggianti et al.2001, Bekki et al.2001).The radio–continuum detection of galaxies with no optical emission lines(Smail et al.1999,Miller&Owen2002)and mid-IR estimates of the star formation rate(Duc et al.2002,Coia et al.2004submitted,Biviano et al.2004)indicate that even the majority or all of the star formation activity of some cluster galaxies can be obscured at optical wavelengths.Whether tak-ing into account dust obscuration changes significantly the evolutionary picture inferred from emission lines is still a critical open question.Finally,precious informations about emission–line galaxies can be obtained from absorption–line spectra.In distant clusters,the presence of galaxies with strong Balmer lines in absorption in their spectra,and no emission lines,testi-fies that these are post-starburst/post-starforming galaxies observed soon afterEmission line galaxies in clusters5 their star formation activity was interrupted and observed within1-1.5Gyr from the halting(Dressler&Gunn1983,Couch&Sharples1987,see Pog-gianti2004for a review).These galaxies have been found to be proportion-ally more numerous in distant clusters than in thefield at comparable redshifts (Dressler et al.1999,Poggianti et al.1999,Tran et al.2003,2004).Their spectral characteristics and their different frequency as a function of the envi-ronment are a strong indication for a truncation of the star formation activity related to the dense environment.Galaxy morphologiesIn this section I summarize the results concerning the morphologies of emission-line galaxies in distant clusters obtained with the Wide Field and Planetary Camera2.At the time of writing,high–quality data of distant clusters have been obtained with the Advanced Camera for Surveys by several groups,and results should appear soon(Desai et al.in prep.,Postman et al.in prep.).The HST images have revealed the presence of large numbers of spiral galaxies in all distant clusters paring HST morphologies and spectroscopy,it has been shown that emission–line galaxies in distant clusters are for the great majority spirals(Dressler et al.1999).The viceversa is not always true:several of the cluster spirals,in fact,do not display any emission line in their spectra,and both their spectra and their colors indicate a lack of current star formation activity(Poggianti et al.1999,Couch et al.2001,Gotoet al.2003).These“passive spirals”might be an intermediate stage when star–forming spirals are being transformed into passive S0galaxies.A strong reason to believe that a significant fraction of the spirals in distant clusters evolve intoS0s comes from the evolution of the Morphology-Density(MD)relation.The MD relation is the observed correlation between the frequency of the various Hubble types and the local galaxy density,normally defined as the projected number density of galaxies within an area including its closest neighbours.In clusters in the local Universe,the existence of this relation has been known fora long time:ellipticals are frequent in high density regions,while the fractionof spirals is high in low density regions(Oemler1974,Dressler et al.1980).At z=0.4−0.5,an MD relation is already present,at least in concentrated clusters,but it is quantitatively different from the relation at z=0:the frac-tion of S0galaxies at z=0.5is much lower,at all densities,than in clustersat z=0(Dressler et al.1997).The fraction of S0s in clusters appears to increase towards lower redshifts,while the proportion of spirals correspond-ingly decreases(Dressler et al.1997,Fasano et al.2000).Interestingly,el-lipticals are already as abundant at z=0.5as at z=0.Adopting a more conservative distinction between“early-type”(Es+S0s)and late-type(spirals)6galaxies,a similar evolution is found,with the early-type fraction decreasing at higher redshifts(van Dokkum et al.2000,Lubin et al.2002).First results at z∼0.7−1.3seem to indicate that between z=0.5and z=1what changes in the MD relation is only the occurrence of early-type galaxies in the very highest density regions(Smith et al.2004).Alltogether,thefindings described in this and the previous section suggest that many galaxies have stopped forming stars in clusters quite recently,as a consequence of environmental conditions switching off their star formation activity,and that many galaxies have morphologically evolved from late to early type galaxies.What can be the cause/causes for these changes?2.Physical processesThe physical mechanisms that are usually considered when trying to assess the influence of the environment on galaxy evolution can be grouped in four main families:1Mergers and strong galaxy-galaxy interactions(Toomre&Toomre1972, Hernquist&Barnes1991,see Mihos2004for a review).These are most efficient when the relative velocities between the galaxies are low,thus are expected to be especially efficient in galaxy groups.2Tidal forces due to the cumulative effect of many weaker encounters (also known as“harassment”)(Richstone1976,Moore et al.1998).These are expected to be especially important in clusters,and particu-larly on smaller/lower mass galaxies.3Gas stripping-Interactions between the galaxy and the inter-galactic medium(IGM)(Gunn&Gott1972,Quilis et al.2000).The interstellar medium of a galaxy can be stripped via various mechanisms,including viscous stripping,thermal evaporation and–the most famous member of this family–ram pressure stripping.Ram pressure can be efficient when the IGM gas density is high and the relative velocity between the galaxy and the IGM is high,and such conditions are expected to be met especially in the very central regions of cluster cores.4Strangulation(also known as starvation,or suffocation)(Larson,Tinsley &Caldwell1980,Bower&Balogh2004).Assuming galaxies possess an envelope of hot gas that can cool and feed the disk with fuel for star formation,the removal of such reservoir of gas is destined to inhibit further activity once the disk gas is exhausted.In semi-analytic models, for example,the gas halo is assumed to be removed when a galaxy enters as satellite in a more massive dark matter halo.Emission line galaxies in clusters7 Note that while stripping gas from the disk induces a truncation of the star formation activity on a short timescale(∼107yrs),strangulation is expected to affect a galaxy star formation history on a long timescale(>1Gyr)provoking a slowly declining activity which consumes the disk gas after the supply of cooling gas has been removed.The former two of these families of processes affect the galaxy structure, thus morphology,in a direct way:the merger of two spirals can produce an elliptical galaxy,and repeated tidal encounters can change a late–type into an early-type galaxy.The latter two families,instead,act on the gas content of galaxies,hence their star formation activity,and can modify their morpholo-gies in an indirect way:once star formation is halted in a disk,this can fade significantly,the bulge-to-disk relative importance can change and the galaxy appearance and morphology can appear significantly modified.3.Low redshiftNumerous excellent works have been carried out on a single cluster or sam-ples of clusters in the local Universe.Summarizing them is beyond the scope of this paper,and the reader canfind a comprehensive review in Gavazzi& Boselli(in prep.).I have chosen to mention two low-redshift results here,to compare and contrast them with the results at higher redshifts:the observed trends of star formation with local environment,and the gas/SF distribution within galaxies.Trends of star formation with local environmentIt has been known for a long time that in the nearby Universe also the aver-age star formation activity correlates with the local density:in higher density regions,the mean star formation rate per galaxy is lower.This is not surpris-ing,given the existence of the MD relation:the highest density regions have proportionally more early-type galaxies devoid of current star formation.Interestingly,the correlation between mean SF and local density extends to very low local densities,comparable to those found at the virial radius of clus-ters,and such a correlation exists also outside of clusters(Lewis et al.2002, Gomez et al.2003).Again,this seems to parallel the fact that an MD relation is probably existing in all environments,and it has been observed in clusters of all types(Dressler et al.1980)and groups(Postman&Geller1984)–though the MD relation is not the same in all environments,e.g.in concentrated vs.ir-regular,high-vs.low-L X clusters(Dressler et al.1980,Balogh et al.2002b).A variation in the mean SF/galaxy with density can be due either to a differ-ence in the fraction of star-forming galaxies,or in the star formation rates of the star-forming galaxies,or a combination of both.In a recent paper,Balogh et al.(2004a)have shown that the distribution of Hαequivalent widths(EW)8in star-forming galaxies does not depend strongly on the local density,while the fraction of star-forming galaxies is a steep function of the local density,in all environments.Again,a dependence on the global environment is observed, in the sense that,at a given local density,the fraction of emission-line galaxies is slightly lower in environments with high density on large scales(∼5Mpc) (but see Kauffmann et al.2004for an opposite result).The fact that a relation between star formation and density is observed also outside of clusters has often been interpreted as a sign that the environment starts affecting the star formation activity of galaxies(provoking a decline in star formation in galaxies that if isolated would continue forming stars)at rel-atively low densities,when a galaxy becomes part of a group.Personally,I believe the existence of such a correlation is more probably the result of a correlation between initial conditions(galaxy mass and/or local environment very early on,at the time thefirst stars formed in galaxies)and type of galaxy formed.The exact shape of the correlation,instead,is probably influenced by transformations happening in galaxies when they enter a different environment. Gas content and gas/SF distribution within galaxies In order to understand what happens to galaxies in clusters,two crucial pieces of information are1)the gas content of cluster galaxies and2)the spatial distribution of the gas and of the star formation activity within each galaxy.It has been several years since it became evident that many spirals in clusters are deficient in HI gas compared to similar galaxies in thefield(Giovanelli& Haynes1985,Cayatte et al.1990,see van Gorkom2004for a review).Most (but not all)of the HI deficient spirals are found at small distances from the cluster centre.In the central regions of clusters,the sizes of the HI disks are smaller than the optical disks,and a spatial displacement between the HI and the optical occurs in several cases(Bravo-Alfaro et al.2000).The fraction of HI–deficient spirals increases going towards the cluster centre,and a corre-lation is observed between deficiency and orbital parameters:more deficient galaxies tend to be on radial orbits(Solanes et al.2001).All of thesefindings strongly suggest that ram pressure stripping,or at least gas stripping in general,plays an important role(see also Bravo-Alfaro and Solanes contributions in these proceedings).On the other hand,the work from Solanes et al.(2001)has unexpectedly shown that the HI deficiency is ob-served out to2Abell radii.This result has raised the question whether the origin of the HI deficiency in the cluster outskirts can be consistent with the ram pressure scenario and whether can be simply due to effects such as large distance errors or rebounding at large clustercentric distances of galaxies that have gone through the cluster center(Balogh,Navarro&Morris2000,Mamon et al.2004,Moore et al.2004,Sanchis et al.2004).Emission line galaxies in clusters9Figure3.From Koopmann&Kenney2004.Median Hαradial profiles for galaxies grouped in different classes according to their Hαdistribution.Thefirst two panels show profiles that can be considered“normal”(reproduced also in other panels).Truncated,anemic,enhanced classes are shown in all the other panels.Recent works have yielded a census of the spatial distribution of the star for-mation(as observed in Hαemission)within cluster galaxies.These works have shown that the majority of the cluster galaxies have peculiar Hαmorphologies, compared tofield galaxies(Moss&Whittle1993,2000,Koopmann&Ken-ney2004,V ogt et al.2004).More than half of the spirals in the Virgo cluster, for example,have Hαradial profiles truncated from a certain radius on,while others have Hαsuppressed throughout the disk,and in some cases,enhanced (Fig.3)(Koopmann&Kenney2004).On a sample of18nearby clusters,sim-ilar classes of objects are observed:spirals with truncated Hαemission and HI gas on the leading edge of the disk;spirals stripped of their HI with their star formation confined to the inner regions;and quenched spirals,in which the star formation is suppressed throughout the disk(V ogt et al.2004).From these works,gas stripping appears a very important factor in determining both the gas content and the star formation activity of cluster spirals,though tidal effects are also found to be significant(Moss&Whittle2000,Koopmann& Kenney2004).Spirals in clusters thus appear to be heavily affected by the en-10vironment,and to be observed in different stages of their likely transformation from infalling star-forming spirals to cluster S0s.It is apparently hard to reconcile the peculiar Hαmorphologies of spirals in nearby clusters with the fact that the distribution of Hαequivalent widths (EWs)for blue galaxies in the2dF and Sloan does not seem to vary signifi-cantly in clusters,groups andfield(Fig.9in Balogh et al.2004).This apparent contradiction still awaits an explanation.4.Trends with galaxy mass and downsizing effectHow do the results described above depend on the galaxy mass?Does the environmental dependence of galaxy properties change with galaxy mass?It has always been known that fainter,lower mass galaxies on average are bluer than higher mass galaxies,and on average have more active star forma-tion.The references to old and new papers showing this could easilyfill this review.Recently,the interest in this well established observational result has grown, and its implications have been more and more appreciated.In all environments, lower mass galaxies have on average a more protracted star formation history. This implies that,on average,going to lower redshifts,the maximum lumi-nosity/mass of galaxies with significant star formation activity progressively decreases.This“downsizing effect”,observed in and outside of clusters,in-dicates an“anti-hierachical”history for the star formation in galaxies,which parallels a similar effect observed for AGNs(Cristiani et al.2004,Shankar et al.2004).The downsizing effect is thus another effect besides any envi-ronmental effect(see e.g.Fig.4,and Kauffmann et al.2003,2004),and the dependence on the galaxy mass/luminosity cannot be ignored when trying to trace evolutionary effects.In clusters,innumerable results have shown the existence of a downsizing effect(Smail et al.1998,Gavazzi et al.2002,De Propris et al.2003,Tran et al.2003,De Lucia et al.2004,Kodama et al.2004,Poggianti et al.2004,to name a few).A direct observation of this effect at high redshift is shown in Fig.5and illustrates the consequence of downsizing on the characteristics of the color-magnitude red sequence in clusters.A deficiency of faint red galaxies is observed compared to Coma in all four clusters studied,despite of the variety of cluster properties.The red luminous galaxies are already in place on the red sequence at z∼0.8,while a significant fraction of the faint galaxies must have stopped forming stars and,consequently,moved on to the red sequence at lower redshifts.Emission line galaxies in clusters11Figure4.From Balogh et al.2004b.Galaxy color distribution from Sloan as a function of luminosity and local density.5.Conclusions and speculationsA number of important issues have not been considered here due to page limits,but should be included in any complete review of emission-line galaxies in clusters,in particular:a description of the IR and radio-continuum studies, the Tully-Fisher relation of cluster versusfield spirals,the spatial distribution and kinematics of various types of galaxies,the link between the star-formation activity and cluster substructure,the luminosity function of emission–and12Figure5.From De Lucia et al.2004.Left.Color-magnitude diagrams of four clusters at z=0.7−0.8from the ESO Distant Cluster Survey.Histograms represent the magnitude distribution of galaxies within3σfrom the red sequence.Right.The magnitude distribution of red sequence galaxies at z∼0.75(top)is compared with the one of red galaxies in the Coma cluster(bottom).High-z clusters exhibit a clear deficit of low-luminosity passive red galaxies compared to Coma and other nearby clusters.non–emission line galaxies as a function of the environment,and the line emis-sion from AGNs.By now,mostly thanks to the scientific debate of the latest years,it is widespread wisdom that we are investigating a three-dimensional space,whose axis are redshift,environment and galaxy mass.In fact,the evolutionary his-tories and,in particular,the star formation activity of galaxies have similar (increasing)trends as a function of(higher)redshift,(lower)galaxy mass and (lower)density/mass of the environment.While observationally we are begin-ning tofill this3-parameter space,the great theoretical challenge is to help comprehend from a physical point of view why this is the history of our Uni-verse.Emission line galaxies in clusters13 The results mentioned above do not yet match together into one,coherent picture,and in some cases they might be apparently clashing with each other. The observational results in distant clusters,both those regarding the star for-mation activity and the morphologies,point to a strong evolution.Many galax-ies have stopped forming stars in clusters quite recently,and the morphology of many disk galaxies must have changed.Dense environments seem to accel-erate the transformation of star-forming late-type galaxies into passive early-type galaxies.The local large redshift surveys have highlighted the existence of trends of galaxy properties with local density that exist in all environments. This,as well as several other lines of evidence,suggests that whatever induces the existence of a morphology-density and of a star-formation-density relation is not effective solely in clusters.On the other hand,there is now solid evidence (and the gas/star formation results in nearby clusters are most convincing in this respect)that gas stripping is at work and affects most of the emission-line galaxies in clusters,(or,at least,most of those galaxies in clusters that today still have emission lines).Twenty years ago,an expression often used in thisfield was“nature or nur-ture?”.Nowadays,especially within the context of a hierarchically growing Universe,the distinction between nature and nurture has become very subtle, also from a philosophical point of view.The example of the most massive ellipticals is instructive in this respect. They are found in the cluster cores,and the current cosmological paradigm tells us that they were in the highest density peaks of the primordialfluctu-ations,thus have always been in the highest density regions,since very high redshifts.Therefore,at least“part”of the morphology-density relation(and of the star-formation density(SFD)relation,since their stars all formed very early on)must have been in place at z>3.Is it more correct to call this a“primor-dial effect”–because established at very high redshift–or“environmental”–because related to the local density of the environment?but the environment of these ellipticals at z=10is strongly related to their environment today:can we speak of“galaxy destiny”??On the other hand,we know that the morphology-density relation in clusters has evolved with redshift,at least as far as the disk galaxies are concerned, and we can directly observe its evolution.Therefore,we know that while the existence of a morphology-density relation can be traced back to thefirst epoch of galaxy formation,its evolution,and thus its exact shape at any time,depends on the subsequent evolution,likely strongly influenced by the environment. Is the existence of the MD(and SFD)relation primordial,and its evolution environmental?Perhaps also we,as behavioural psychologists(Ridley,2003),are coming to realize that nature and nurture are so intertwined that they become,to a certain extent,indistiguishable and unseparable.。