3-steps-arrows-diagrams三步-箭头-图表
PPT素材循环箭头图表(1)
Text in here
ThemeGallery is a Design Digital Content & Contents mall developed
by Guild Design Inc.
Description of the contents
Text in here
e-Marketing
Supplier
SCM
Supplier
E-CRM
Customer Customer
e-Marketplace
e-Business의 발전단계
Development Implementation
Design
Evaluation
Analysis
eBiz Transformation
ThemeGallery is a Design Digital Content & Contents mall developed by Guild Design Inc.
Diagram
01 Your Title in here
ThemeGallery is a Design Digital Content & Contents mall developed by Guild Design Inc.
ThemeGallery is a Design Digital Content & Contents mall developed
by Guild Design Inc.
Text in here
ThemeGallery is a Design Digital Content & Contents mall developed
工艺流程图学习要领

工艺流程图学习要领英文回答:Learning the essentials of process flowcharts involves understanding the basic components and steps involved in creating and interpreting these diagrams. Process flowcharts are visual representations that illustrate the sequence of steps or activities in a process. They are widely used in various industries to document and analyze workflows, identify bottlenecks, and improve efficiency.To begin with, it is important to understand the key symbols and shapes used in process flowcharts. Some common symbols include rectangles (representing activities or tasks), diamonds (representing decisions or branching points), arrows (representing the flow of the process), and circles or ovals (representing the start or end points of the process). Familiarizing oneself with these symbols will make it easier to comprehend and create process flowcharts.Next, one should focus on the sequential order of activities or tasks in the process. Each activity should be clearly defined and labeled, and the flow of the process should be logical and easy to follow. For example, let's consider a simple process flowchart for making a cup of coffee:1. Start: Boil water.2. Pour hot water into a cup.3. Add coffee grounds to the cup.4. Stir the coffee.5. Add milk and sugar (optional)。
贝恩《贝恩咨询PowerPoint模板及图表库》15- 2页

Recycling
• First level bullet
Text
-Second level dash Third level arrow
• First level bullet
-Second level dash Third level arrow
Text Text • First level bullet
Segmented circular arrows
Segment 4
Segment 1
Segment 3
Segment 2
BOS Bain-Template (revised)
16
This information is confidential and was prepared by Bain & Company solely for the use of our client; it is not to be relied on by any 3rd party without Bain's prior written consent.
• First level bullet
- Second level dash
Third level arrow
• First level bullet
-Second level dash
Third level arrow
• First level bullet
- Second level dash
Triangle
Text
Text
Text
Text
BOS Bain-Template (revised)
18
This information is confidential and was prepared by Bain & Company solely for the use of our client; it is not to be relied on by any 3rd party without Bain's prior written consent.
IBM的标准流程图画法

如何满足内部客户或外部客户需求的活动; 活动之间的时间先后顺序; 每个活动的输入和输出,以及不同活动之间的接口关系; 执行活动的角色(由同一组织或不同组织承担); 与信息系统的接口; 分析流程现状; 设计未来的流程; 根据设定的目标来测评流程;
3
LOVEM图的作用:
什么是流程
“与”分支
001
一个活动在同一时间导致 两个结果
PLACE
an order
002 COPY manager 003 COPY finance
“或”分支
一个活动的结果由某个判 断决定。 箭头不能指向与时间相反 的方向。使用LOOP连接。
001
“循环”分支
Yes. Stock OK.
PLACE
1天 1天 3天 2天 6天 3天
CSF
在线操作
6
LOVEM图——样例
标题 流程图的标题应含有编号。如订单管理流程1.0 虚线 一根水平的虚线,用来区分客户和业务 [图的顶部] 带状区 一组等高的水平线,用来区分不同的角色 [图的主体部分] 角色 一根垂直的线,用来区分角色和活动 [图的左边] 应明确角色的岗位和部门 自动操作线 一根水平线代表自动系统[图的底部] 手工操作 (线的上方) /在线操作 (线的上面) / 批处理 (线的下方) 时间周期 一根水平的箭头线 [图的底部] 现状(箭头线的上方)/目标(箭头线的下方)
LOVEM Line Of Visibility Enterprise Modeling - 流程制作技术
1
讲稿内容介绍
学术英语(教师资料)-Unit3

Unit Contents
1 Preparing for listening to a lecture 2 Paying attention to the introduction 3 Understanding the ideas through examples 4 Following a lecture through signal words 5 Memorizing the points by taking notes
Unit 3 Listening to Lectures
1 Preparing for listening to a lecture
• Lectures are not only a major part of college learning, but another major source of your research article.You will get information no less than from reading essays and articles.To listen to an academic lecture effectively, however, you may do some homework beforehand.The following are some tips:
Unit 3 Listening to Lectures
3 Understanding the ideas through examples
Signal words that you should pay attention to:
for example for instance the following example (story/ incident) illustrates/
箭头图(arrow diagram)
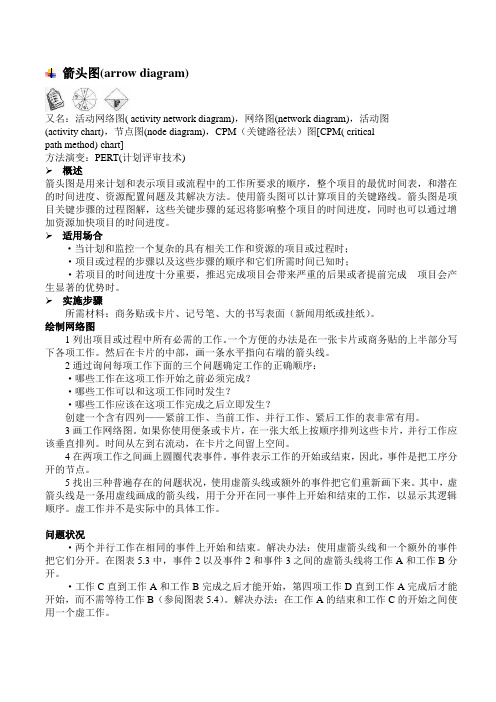
箭头图(arrow diagram)又名:活动网络图( activity network diagram),网络图(network diagram),活动图(activity chart),节点图(node diagram),CPM(关键路径法)图[CPM( criticalpath method) chart]方法演变:PERT(计划评审技术)概述箭头图是用来计划和表示项目或流程中的工作所要求的顺序,整个项目的最优时间表,和潜在的时间进度、资源配置问题及其解决方法。
使用箭头图可以计算项目的关键路线。
箭头图是项目关键步骤的过程图解,这些关键步骤的延迟将影响整个项目的时间进度,同时也可以通过增加资源加快项目的时间进度。
适用场合·当计划和监控一个复杂的具有相关工作和资源的项目或过程时;·项目或过程的步骤以及这些步骤的顺序和它们所需时间已知时;·若项目的时间进度十分重要,推迟完成项目会带来严重的后果或者提前完成项目会产生显著的优势时。
实施步骤所需材料:商务贴或卡片、记号笔、大的书写表面(新闻用纸或挂纸)。
绘制网络图1列出项目或过程中所有必需的工作。
一个方便的办法是在一张卡片或商务贴的上半部分写下各项工作。
然后在卡片的中部,画一条水平指向右端的箭头线。
2通过询问每项工作下面的三个问题确定工作的正确顺序:·哪些工作在这项工作开始之前必须完成?·哪些工作可以和这项工作同时发生?·哪些工作应该在这项工作完成之后立即发生?创建一个含有四列——紧前工作、当前工作、并行工作、紧后工作的表非常有用。
3画工作网络图。
如果你使用便条或卡片,在一张大纸上按顺序排列这些卡片,并行工作应该垂直排列。
时间从左到右流动,在卡片之间留上空间。
4在两项工作之间画上圆圈代表事件。
事件表示工作的开始或结束,因此,事件是把工序分开的节点。
5找出三种普遍存在的问题状况,使用虚箭头线或额外的事件把它们重新画下来。
用例模型——绘制系统顺序框图(SSD)
a message with parameters it is an abstraction representing the system event of entering the payment data by some mechanism
total with taxes
makePayment(amount)
ta xL in e Ite m s = g e tT a xe s ( sa le )
用例简述 顾客在购物网站上输入注册信息,成为网站会员。
基本事件流 1 顾客在会员注册画面,输入用户编号、密码、用户姓 名、电子邮件地址和联系电话等信息,提交注册请 求。 2 系统对顾客的信息进行检查,并保存顾客的信息。 4 系统提示顾客注册成功。
回忆 用例 用例如何描述参与者与系统 的交互? 如果用图形象的表示交互是 不是更好?
第九章 绘制系统顺序图SSD
SYSTEM SEQUENCE DIAGRAMS
重点:
掌握SSD的画法 给出用例要求可以画出SSD图
system as black box the name could be "NextGenPOS" but "System" keeps it simple the ":" and underline imply an instance, and are explained in a later chapter on sequence diagram notation in the UML external actor to system : Cashier makeNewSale a UML loop interaction frame, with a boolean guard expression loop enterItem(itemID, quantity) Process Sale Scenario
131张图表(英文)
Headline: 24-point bold (adjust to keep to 2 lines, no smaller than 18-point)
Flush left subhead (no bullet), 18-bold italics: Bullet is 18-point bold and begins at the left margin: – A dash is 14-point non-bold, and indented once under a bullet (dash icon is an N-dash): • A sub-bullet is 14-point non-bold, and indented once under a dash (with smaller icon than 18-bullets). Colons are used at the ends of bullets that are followed by dashes: – And at the ends of dashes followed by sub-bullets: • Full stops are used for all lines of six words or longer.
The Title Is Set in 26-Point Arial Bold (three lines max., reduce font size if more)
Sub-title, 20-Point Arial Bold This Could Go to Two Lines
Client/Capacity2000
Source: The source should be 8-point, non-bold. Punctuate sources: Use semi-colon between sources in the series and always end with a full stop. Note: Text is anchored to the bottom, enabling deletions or additions without having to move the box; box margins 0/.03; 0.10 before paragraph spacing. a. Use lower-case alpha characters for footnote references; call-out for footnotes should be 12 point using superscript.