RGIS 2010 系统电法软件介绍
第四章 数字程控交换机的软件系统

根据重要性及影响面大小
BQ1_____BQ2_____BQ3
基本级
没有执行周期,有任务就执行,程序级别最 低。
二 程序启动方式 1 故障级 采用故障中断启动(由硬件进行故障识别) FH->FM->FL 2 时钟级 采用时钟中断(F-150 4ms S1240 5ms) 由时钟计数电路向处理机发定时中断请求。 H->L ->B 等待下次中断 每次中断时只执行各级任务中的一小部分 (因为程序时限要求不同)
中断 中断
H级
FL
FH 。 。 FL
。L级
。
L级
故障级任务启动举例
时钟中断
时钟中断 8ms
时钟中断
时钟中断
故障级 周期级 基本级 暂停
各级任务执行举例
3 基本级B 由队列启动,先到先服务的原则 FIFO 各级程序启动由任务调度程序来管理
H级调度程序 任务调度程序分类 L级调度程序 B级调度程序
应用软件系统
呼叫处理程序 管理程序 维护程序
操作系统
中央处理机
处理机 外围设备
交换机 外围设备 数据库管理系统
运行软件系统结构
数据
——操作系统:对交换机(尤指处理机)的硬 件和软件资源进行管理和调度。 并为其他软件部分提供支持。 接口:应用软件系统 —— 交换机硬件 (类似于计算机的 O.S)
—— 数据库系统:对软件系统中大量数据进行集 中管理。实现各部分软件对数 据共享访问及数据保护功能。 ﹡数据:是程序执行的环境和依据。 动态数据:呼叫过程中有许多数据需要暂存且不 断变化。 半固定数据:局数据,用户数据。
与各局的设备情况及安装条件有关的数据。 如:各种话路设备的配置 中继信令方式 编号方式 计费方式、路由计划、新业务情况…… c. 用户数据 反映用户特征的数据 如:用户类别、话机类型、服务级别、新业 务、用户设备号码等
电力系统分析工具软

01
02
MATLAB
MATLAB
工具箱
标准潮流
连续潮流
最优潮流
小信号稳定分析
时域仿真
电磁暂态
图形化用户交互
图形化电网搭建
EST
√
√
√
√
MatEMTP
√
√
√
√
Matpower
√
√
PAT
√
√
√
√
PSAT
√
√
√
√
√
√
√
PST
√
√
√
√
SPS
√
√
√
√
√
√
VST
√
√
√
√
√
电力系统分析工具箱功能对比
MATLAB-PSAT
PSS®E
主要功能
PSS®E OPF(用于电力系统工程的仿真器的优化潮流)是个功能强大,使用方便的电力网络分析工具。它突破了常规的潮流分析,为用户提供了全面优化和调整输电系统运行的能力。PSS®E OPF完全嵌入在PSS®E的潮流程序中,使得这种优化和调整更为容易。
PSS®E OPF把职能融入潮流求解过程中,大大提高了分析电力系统性能的效率。 常规的潮流依赖于工程师系统地研究各个解后才能找到一个满意的“良好”解, 而PSS®E OPF直接改变各种控制从而迅速地确定“最优”解。几乎对于任何一 个合理的初始点,OPF肯定能求得唯一的全局最优解,并同时满足系统 约束, 使成本减少到最小或使系统性能最佳。
潮流计算:可进行单相、三相潮流计算,计算时可以考虑负荷电压特性、变压器分接头、HVDC及SVC;也可进行电感、电容耦合的多相线路潮流计算,得到分布式多相线路上的电压随距离的变化曲线 暂态计算:分为电磁暂态计算和机电暂态计算。电磁暂态部分采用差分导纳法、变积分步长等方法和技巧有效地处理了开关操作产生间断点、非线性连接等问题;机电暂态部分可用自定义地负荷模型考虑频率、电压特性,自定义的继电保护断开线路仿真。在暂态计算中不同的时段可采用不同的数学模型,可变积分步长
Elecsys2010 操作说明

ELECSYS 2010操作说明1. 打开分析仪1.1简介在测试样品前,必须检查样本盘是否存在,是否打开打印机开关和分析仪开关,是否在软件上记录了你的操作号。
1.2检查样本盘打开操纵台前的门,检查样本盘是否在样本盘槽内。
1.3打开打印机如果打印机未开启,打开位于打印机前右侧的开关。
当打印机打开时,绿灯亮。
同时检查打印纸是否足够。
注意:打印机型号可根据国家而不同1.4打开分析仪分析仪的开关通过位于操纵台前的开关来控制。
按开关的右端使之处于ON的位置,小绿灯亮表明系统已打开。
打开分析仪后,打开PROCELL和CLEANCELL瓶盖。
1.5登录开机短时间后,触摸式屏幕显示的是分析仪关闭时的最后一次软件记忆内容。
根据下列程序操作进入操作者ID号码:1.按STATUS进入STATUS屏幕,如下所示。
不管系统是否被使用,OPERATOR ID总在屏幕上的相同位置。
2.按OPERATOR ID,输入你的号码(1-99)。
3.按ENTER。
2.登录检查2.1简介每天测试样品前要进行登录检查。
2.2目测检查×探针是否良好,是否有粘附物。
×管道是否变形和弯曲。
×吸样针是否有气泡,如有,需冲洗。
×吸样管和孵育器表面保持干净,吸样管和孵育器上液体的溢出可能引起顶端或孵育系统阻塞,所以会引起机械臂的警报。
2.3登录屏幕按INBENTORY显示登录屏幕。
2.4PROCELL和CLEANCELL的检查:根据需要更换PROCELL和CLEANCELL。
如果SET1和SET2大于30%,屏幕键显绿色。
如果SET1和SET2大于0%而小于30%,屏幕键显黄色。
如果SET1和SET2等于0%,屏幕键显红色。
注意:SET2(右侧)首先被用完。
如要替换SET2,将左侧试剂瓶(SET1)移至右侧(SET2),然后装上新的试剂瓶于左侧(SET1)2.5装满蒸馏水:当容器空了,键显红色。
2.6清除废物筒:当废物筒满了,键显红色。
电法处理软件使用说明.doc
电法处理软件使用说明井下直流电法解释软件由VB开发环境完成。
该软件由煤炭科学研究总院西安分院开发,专用于井下直流电法资料解释的配套软件,可在WINDOWS环境下运行。
下面介绍一下该软件的使用过程:1.软件的安装:运行安装软盘中的setup.exe程序,然后按照提示就可以完成安装。
需要注意的是:请确保绘图软件Grafwin和suffer安装在c:\SURFER6目录下,本程序才可以调用它。
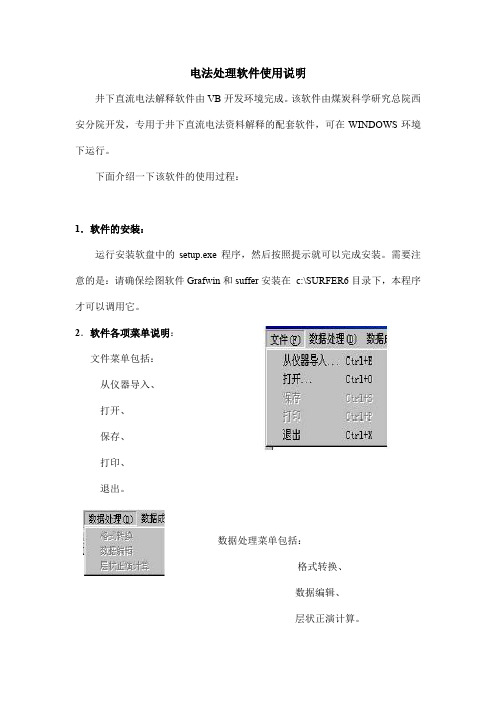
2.软件各项菜单说明:文件菜单包括:从仪器导入、打开、保存、打印、退出。
数据处理菜单包括:格式转换、数据编辑、层状正演计算。
数据成图菜单包括:平剖图、等值线图。
3.各项详细介绍:“从仪器导入”菜单项:该菜单使用于pc机和仪器之间的数据传输,当点击该项或者快捷按钮后将显示下图所示窗口:选择好”通讯端口”和”保存路径”后就可以点击”确定”按钮来开始通讯。
通讯过程中要让仪器先处于等待传输状态,并且本程序可以显示传输进度。
例:保存路径:e:\gf\1.dat“打开”、“保存”、”打印”、”退出”菜单项:这几项菜单项和一般应用软件功能基本相同,这里就不再介绍了。
“格式转换”和“数据编辑”菜单项:这两项是在点击“打开”菜单后才可以使用,对仪器的原始数据进行格式转换和一些相关的计算。
如果原始文件存为1.dat, 则这项数据存在1zh.dat和1bj.dat中。
“层状正演计算” : 该项是在有一些已知条件的情况下,输入各层的厚度和电阻率值,计算一条正演曲线的数据。
如果原始数据存在1.dat中,点击确定后该数据存于1zy.dat中。
“平剖图”和“等值线图”:前者会粗略地描述一下地层电阻率的大致趋势,从这种趋势可以看出一些的地层分层的信息,为后面的等值线图的解释提供参考。
点击后者会调用suffer和grafwin绘图程序。
关于它们的使用,请参阅它们的使用说明,这里不作介绍。
4.软件使用的一般流程本软件使用的一般流程为:数据传输—打开传输文件—数据转换—数据编辑—成图.A . 数据传输:点击状态栏中的按钮就会出现如下图所示的窗口如左图所示,选择串口,输入传输数据个数(从仪器中得知纪录的数据数),然后点击“保存路径”就可以得到右图所示的窗口,选择或在空白框输入传输文件名,然后点击确定按钮进入传输过程.出现右图所示的窗口后,必须先使仪器的进入传输状态然后点击确定按钮,开始传输.(如果仪器显示”hello”则表示传输正常,没有出现则有可能是传输线没连接好.)出现”传输结束”消息框后,传输正常结束.点击”打开”按钮打开刚才传输保存的文件.B. 打开传输文件:点击”数据转换”按钮对数据进行转换,如果存在不正常的数C. 数据转换:据,可以在数据显示框中直接进行修改,删除操作.删除时要保证以行为单位进行删除.修改操作完成以后一定要存盘,点击”保存按钮”后,( 如果传输文件存为1.dat,则保存文件名为1zh.dat),选择好保存文件名并保存.点击”数据编辑”按钮将出现下图所示的窗体D.数据编辑:选择好施工方法后就可以点击”确定”按钮,得到成图数据文件.和”数据转换”一样,这里也可以进行数据的修改工作.注意事项是基本相同的,只是在保存时(如果传输文件存为1.dat,则保存文件名为1bj.dat),选择好保存文件名并保存.E.成图:这部分已经在前面介绍过了,这里就不再说明了.5.其他说明这里也可以直接点击”打开”按钮对”数据编辑”和”数据转换”的保存文件进行重复处理. 如果传输文件存为XXX.dat,打开”数据转换”保存文件名为XXXzh.dat, 打开”数据编辑”保存文件名为XXXbj.dat.该软件由于编写的能力有限,还有很多错误和不足之处。
电力网络故障诊断系统软件的结构和功能说明书

International Conference on Materials Engineering and Information Technology Applications (MEITA 2015)Functions and General Structure of Fault Diagnosis System Software Du Peidong, Liu Fuchao, Zheng Jingjing, Wang QinglingState Grid Gansu Electric Power Research Institute, Lanzhou, China****************Keywords: Fault diagnosis, power network, structure.Abstract. Referred to in the fault diagnosis of power grid mainly refers to the transmission network and transmission network bears an important task of power transmission, power plant and terminal user ties, is one of the most important parts of the power system. Long term exposure to natural environment in the transmission network, and wide coverage, complex structure, due to natural disasters or operational failures and other factors, the failure is inevitable. The dependence of modern society on the electric energy is increasing, and the short time of transmission network fault can cause great loss. When the power grid is in a fault, the fault recorder can be transmitted to the dispatching center through the public telephone network or other channels. The rich recording information provides the basis for the further diagnosis.IntroductionAs an important part of the whole “regional power grid dispatching decision support system”, the purpose of the power grid failure diagnosis and recovery system software is to serve for the dispatch operator. In the situation of the failure, it can assist the dispatch operator to judge and deal with the fault with the fastest speed. According to the status of the fault processing software in the whole decision system and the specialty of fault treatment, when the fault occurs in the system, decision system should be preferentially transferred to perform fault processing functions and cannot be shielded by the other computing programs.The diagnostic software make meet the field requirements and conform to the actual situation as a starting point. On the basis of analyzing all kinds of characteristics about the faults in the power system and according to the experience and the process of dealing with accidents by the general scheduling personnel, we construct the whole structure of the fault diagnosis system.Power System Fault and Scheduling ProcessThe Classification of Power System Fault. The Failure of the Main Parts. It includes the short-circuit fault and disconnection fault of the line, the bus and the transformer and internal abnormality and failure of the main transformer. The Abnormality and Failure of the Main Equipment. It includes the abnormality and failure of the high voltage circuit breaker, isolating switch, current transformer and voltage transformer, capacitor and reactor and other equipments. The Failure of the Secondary Equipment. It includes the failure of DC system, the failure of secondary wiring and relay protection and safety automatic device.(4) The Abnormality of the System Frequency(5) The Abnormality of the System V oltage(6) The System Oscillation(7) The System SeparationThe Diagnosis Process of Dispatcher with Power Grid Fault. When a fault occurs in power system, and the circuit breaker trips, the diagnosis process of dispatcher for the system fault can be generally described as follows.First of all, according to the tripping condition of the circuit breaker, we open CRT of the related station in the SCADA system and contrast the deflection of the simulation plate so as to determine whether the system has had a failure.After we confirm the system has had an accident, we use the relevant information on the SCADA to search for the related equipment about the power failure in the process of the accident and make the preliminaryjudgment of the failure according to these equipment. If there is only one equipment with the failure in the process of the failure, the equipment is the fault equipment. If multiple equipments have the power failure, the dispatcher will analyze the possible reasons for the power failure of each equipment according to the principle analysis of the cooperation within the protection( for example, weather it conforms to the characteristics of the switch trip field personnel to check the protection action signal after the operation of the main protection, the characteristics of tripping about the operation of the backup protection and the characteristics of the switch trip after the operation of fault protection). With the above analysis, we give a preliminary judgment on the fault equipment.After the field personnel check the signal of the protective operation and make a report, we finally confirm the location of the failure point according to the signal of the protective operation. If there is a failure within the substation, we should be able to check the relevant equipments to find whether they have flashover marks.The Basic Requirements of the Power Grid Fault Diagnosis System Software It has the same requirement with other advanced application software in the decision system. It it operated on the unified support software platform. It adopts the same graph structure, real-time library and a part of history library so that it can share network topology model, parameters and data, and maintain data consistency. Graphical hints. It uses different colors to show the fault components or equipments and the possible recovery path. It establishes the faulty diagnosis and restoration and provides the maintenance and modification methods for the rule base and friendly user interface. The maintenance process of the database does not affect the operation of software applications. It realizes the two kinds of operation modes, namely the real tense and research tense. In the state of the real tense, it fetches the data from the fault information system and SCADA system. In the state of the research tense, it fetches the data from DTS or uses manual placement alarm.(1) It uses the fault information system or the dispatcher to trigger the operation of power grid fault diagnosis system software. The dispatcher can also be activated by a button, and then it can run the system recovery processing software.(2) In the situation of incomplete information, it hints the dispatcher to input those more detailed information so as to determine the fault components further.The Interface with Other Application SoftwareIt establishes the data interface with SCADA system, and according to the requirement it obtains the real-time data and historical data. The data got from the SCADA system mainly includes the real-time and historical value of the switch, the breaker switch, and remote electricity quantity, SOE and PDR information. It establishes the data interface with the fault information system, and according to the requirement it obtains the real-time data and historical data. The data got from the fault information system mainly include the status of the relaying plate, protection action and disturbance information, the report of trip protection and the fault data recorder information. It establishes the data interface with DTS data to realize the data sharing and the mutual transfer. The information got from DTS is the same with the data got from SCADA system and fault information system ( DTS may not provide for the protective disturbance and fault recorder information). It recovers the software interface with power grid failure.The Basic Function of the Power Grid Fault Diagnosis System SoftwareThe Starting Detection of the Power Grid Fault Diagnosis System Software. We make the fault information collected in the fault information system and the SCADA system be consolidated into the format which is easy to be diagnosed and judge whether we start the core fault diagnosis process with simple logic. If we judge that it is not the starting core fault diagnosis process but the network structure changes, we should only operate the initialization program, and show to revise and update the network knowledge of the diagnostic procedure.The Diagnosis of the Related Information about the Point of Failure. The Location of Fault Point. According to the information provided by the complete degree, we can make the fault point be positioned to the area, components or equipment.If fault information system can only provide the action information of switch.—For simple faulty, we can position to the components;—For complex faulty ( the switch, or the protective action resistance, error action), we can only be positioned to blackout area, and the system can calculate the failure probability of each component in the blackout area and line up from big to small according to failure probability.If fault information system can provide the action information of the switch and the protector.—For the situation of the switch action resistance and error action, we can position to the components;—For some situations of the protector action resistance and error action, we can position to the components,If fault information system can not only provide the action information of the switch and the protector, but also provide the fault recorder information. For the complex failure, we can position to the components precisely.If fault information system also can provide the abnormality and failure information; we can make a further diagnosis till the equipment with the basis of positioning to the components precisely.Judging the Types of fault (the breakdown, ground fault ground fault or phase fault)If fault information system can only provide the action information of the switch and the protector; we can confirm the possible types of fault.If fault information system can provide the report about the trip protection and the fault recorder information; we can confirm the types of fault precisely.Judging the Failure Property( instantaneous fault or permanent fault)If fault information system can only provide the action information of the switch and the protector, we can confirm the possible property of fault.If fault information system can provide the fault recorder information, we can confirm the types of fault precisely.(We can provide the information of automatic circuit recloser and we can also affirm the possible fault property.The Overall Structure of the Fault Diagnosis Expert SystemThe fault diagnosis system is a part of the whole “Regional power grid intelligent dispatching decision support system”, so its whole structure should comply with the functional requirements of whole decision system to construct. The advanced application software of scheduling decision system is constructed based on the data platform. We use the intelligent dispatching decision machine to coordinate each software to operate with what kind of time order and combination mode so that we make it be intelligent and automated when we analyze operation state of power system. It can provide reasonable analysis results for the dispatchers so as to make the system be able to realize the safe and economic operation in the true sense. Because the fault diagnosis system belongs to the transient analysis, only the power grid has an accident, it can be operated and analyzed. What’s more, at the same time, the fault information volume is very large. In order to shorten the time of fault diagnosis, we need more efficient information processing means and effective storage way, and these jobs are dealt with by the data platform located in the upper layer. We can combine with the whole structural design of intelligent decision system to deal with. ConclusionWe first analyze the types of the various faults and abnormalities, and the basis and process of analyzing the failures by the dispatcher in the actual power system in This paper. Then, according to the field requirements of Lanzhou local dispatching and starting from the whole situation of regional power grid online intelligent decision support system we analyze the relationship betweenthe diagnostic software and the advanced application software of other various parts to complete the overall functional design and structural design of fault diagnosis system. The design has been smoothly passed the acceptance at the end of 2003. After we have analyzed the information demand of the fault diagnosis system and the function requirement of diagnostic software in details, we can realize our online intelligent fault diagnosis expert system specifically.References[1] Korba P, Larsson M, Rehtanz C.Detection of Oscillations in Power System Using Kalman Filtering Techniques. Proceedings of IEEE Conference on Control Applications, 2003.183~188.[2] Li Yi-qun, Teng Lin, Liu Wan-shun, et al. The Study on Real-time Transient Stability Emergency Control in Power System. Proceedings of the 2002 IEEE Canadian Conference on Electrical&Computer Engineering, Canada: 2002.138~143.[3] Ota Y, Ukai H, Nakamura K, et al Evaluation of Stability and Electric Power Quality in Power System by Using Phasor Measurement. Proceedings of Imitational Conference on Power System Technology, 2000.1335~1340.[4] Ota Y, Ukai H, Nakamura K, et al. PMU Based Midterm Stability Evaluation of Wide-area Power System. IEEE/PES Transmission and Distribution Conference and Exhibition, Asia Pacific:2002.1676~1680.[5] Nuqui R F, Phadke A G, Schulz R P, et al. Fast On-line Voltage Security Monitoring Using Synchronized Phasor Measurements and Decision trees. IEEE Power Engineering Society Winter Meeting, 2001.1347~1352.[6] Ishibashi A, Imai M, Omata K, et al. New Type of islanding Detection System for Distributed Generation Based on Voltage Angle Difference between Utility Network and Distributed Generation Site. Eighth IEE International Conference on Developments in Power System Protection, 2004.542~545.[7] Rehtanz C, Bertsch J.Wide Area Measurement and Protection System for Emergency Voltage Stability Control. IEEE Power Engineering Society Winter Meeting, 2002. 842~847[8] Fan Chun-ju, Li Sheng-fang, Yu Wei-yong, el a1.Study on Adaptive Relay Protection Scheme Based on Phase Measurement Unit(PMU).Eighth IEEE International Conference on Developments in Power System Protection, 2004.36~39.。
RGIS教程软件结构和功能

工作空间管理
RGIS2009基本操作
• 系统提供了不同的数据查看方式:
– 地图窗口 – 浏览窗口 – 布局窗口
地图窗口
• 以常规地图的方式表达信息,使数据的 地理模式直观化。 是最常用的地图显示 和操作窗口,包含了常用的编辑工具。
浏览窗口
• 以列表方式表达信息,通过浏览窗口可以全面 查看表中各项数据值和选定数据。该窗口数据 可以实现与地图窗口的联动。
等。
地图图层
• 系统是按图层的方式组织表,一张表构 成一个图层实体。每一个图层包含整个 地图的不同方面。每张表都作为独立的 图层显示。每个图层可以包含不同的地 图对象(点、线、面、文本)。
地图图层
• 例如,第一个图层包含重力异常等值线, 第二个图层是表示异常线的标注,第三 个图层是异常图的面元,把它们层层叠 加就形成一幅完整的地图。在创建每一 个图层时,都要为其建立一张表,系统 就是通过这种方式在表与地图之间建立 了联系。(见下图)
RGISMAP主要功能
• 数据库建设和维护:重力、磁测数据库建设和维护的工具,能够 实现对省级和全国重力和磁测数据库管理和维护。
• 数据预处理:坐标转换、网格化、空白区处理、数据扩边、地磁 要素计算、磁化强度计算、剖面数据准备。
• 重磁数据处理功能:空间域/ 频率域的延拓、导数、曲化平,异常 分离。 • 磁测数据处理:化磁极、低纬度化极、三分量转换、任意方向分 量转换、磁源重力异常计算;剖面数据处理。
表的基本概念
• 系统通过表的形式将数据与地图有机地 结合在一起。当用户在系统中打开数据 文件时,系统将创建一个表。这个表至 少由两个独立的文件组成,一个是包含 数据结构的文件(*.tab),另一个是包含 原始数据的文件(*.dat)。关于文件,我们 将在下面描述。
电力系统仿真软件DIgSILENT介绍
电力系统仿真软件DIgSI L ENT介绍吕 涛,韩祯祥(浙江大学电气工程学院,浙江 杭州 310027)摘 要:介绍了德国DIgSI LE NT公司的大型集成化电力系统仿真软件的主要功能、特点和应用。
提供了电力系统各个方面的分析功能。
高度图形化的操作模式和全新的数据管理理念使它区别于众多的电力系统分析软件,具有独特的优点。
关键词:电力系统;仿真软件;DIgSI LE NT中图分类号:TP391.9 文献标识码:B 文章编号:100129529(2004)1220037205I ntroduction of pow er system simulation softw are DIgSI LENTL¨U Tao,H AN Zhen2xiang(School of E lectrical Engineering,Zhejiang Univ.,Hangzhou310027,China)Abstract:The major functions,features and application of the large integrated power system simulation s oftware designed by DIgSI LE NT C om pany of G ermany were introduced.The s oftware has analytical functions for every aspects of power system and is distinctive from other power system analysis s oftware for its high degree graphic operation m ode and new data manage2 ment concept.K ey w ords:power system;simulation s oftware;DIgSI LE NT 电力系统仿真软件DIgSI LE NT的名称来源于数字仿真和电网计算程序(DIgital SImu Lation and E lectrical NeT w ok),最早的开发始于1976年。
PI Server 2010 系统管理简介介绍
PI Server 2010
系统管理简介
OSIsoft, LLC 777 Davis St., Suite 250 San Leandro, CA 94577 USA 电话:(01) 510-297-5800 传真:(01) 510-357-8136 网站: OSIsoft Australia • OSIsoft Europe GmbH • OSIsoft Asia Pte Ltd. • OSIsoft Canada ULC • OSIsoft,LLC 代表处 • OSIsoft Japan KK • 澳大利亚,佩思 德国,法兰克福 新加坡 中国,上海 墨西哥,墨西哥城 巴西,圣保罗 加拿大,蒙特利尔 & 卡尔加里 日本,东京
PI Server将备份恢复到现有 PI Server ....................................................................................41 第 8 章 管理接口 ...........................................................................................................................43 关于 PI 接口 ....................................................................................................................43 配置接口 ...........................................................................................................................45 监视 PI 接口性能 .............................................................................................................48 第 9 章 管理安全性 .......................................................................................................................49 关于安全性 .......................................................................................................................49 管理身份验证 ....................................................................................................................49 管理授权 ...........................................................................................................................57 提高安全性 .......................................................................................................................65 第 10 章 监视 PI System 性能 ....................................................................................................69 如何监视性能计数器 .........................................................................................................69 监视哪些性能计数器 .........................................................................................................72 第 11 章 管理数据源设备 ..............................................................................................................75 添加新设备 .......................................................................................................................75 删除过时设备 ....................................................................................................................75 更换设备 ...........................................................................................................................76 附录 A PI Server 运行状况检查 .................................................................................................77 附录 B 术语表 ..............................................................................................................................79 附录 C 技术支持和资源 .............................................................................................................101 培训 ................................................................................................................................104 索引 ...............................................................................................................................................105
电力系统分析工具软件
PSCAD/EMTDC
Dennis Woodford博士于1976年在加拿大曼尼托巴水电局开发完成了 EMTDC的初版,是一种世界各国广泛使用的电力系统仿真软件,PSCAD 是其用户界面,PSCAD的开发成功,使得用户能更方便地使用EMTDC进 行电力系统分析,使电力系统复杂部分可视化成为可能,而且软件可以作 为实时数字仿真器的前置端。可模拟任意大小的交直流系统。
计提供依据、计算无源网络的谐波分布、分析网络中出现的周期性干扰、 研究与频率和电压有关的负荷的影响等 动态稳定性分析:应用收敛性较好的QR算法求出全部特征值,来判断 系统在小扰动下的动态稳定性;若考虑发电机轴系方程后,也可进行次同 步振荡的研究 面向模块的仿真语言:采用模块化语言来模拟发电机励磁,原动机调 速器、汽轮机等。具有80多种模块,其中有积分、惯性等基本积分环节, 也有较大的组合模块
PSS®NETOMAC
德国西门子公司在上个世纪70年代开发的电力系统分析软件,经过多年的 发展,该软件不断完善,功能日益强大,具有良好的开放性,可嵌入用户 自行编制的 FORTRAN语言子程序、数学表达式等,用户遍及世界各地。 该软件元件模型全,仿真频带宽,运行与Windows环境下 。 功能:
潮流计算:可进行单相、三相潮流计算,计算时可以考虑负荷电压特性、
PSS®E
系统特点: (1)输入数据方式及与其他程序数据文件共享的方便性; (2)程序缺省模型包括发电机模型、励磁系统模型、调速器模型、HVDC 模型、FACTS 模型、负荷模型等的完整性; (3)用户自定义模型功能和程序接口功能; (4)用户自定义计算顺序与用户自定义计算功能; (5)分析计算功能的多样性; (6)计算方法的透明性与文档的完整性; (7)国际交流的方便性。
ED-GWL2010 用户手册说明书
ED-GWL2010一款基于RASPBERRY PI 4B设计的室内轻网关上海晶珩电子科技有限公司2023-03-23版权声明ED-GWL2010及其相关知识产权为上海晶珩电子科技有限公司所有。
上海晶珩电子科技有限公司拥有本文件的版权并保留所有权利。
未经上海晶珩电子科技有限公司的书面许可,不得以任何方式和形式修改、分发或复制本文件的任何部分。
免责声明上海晶珩电子科技有限公司不保证本手册中的信息是最新的、正确的、完整的或高质量的。
上海晶珩电子科技有限公司也不对这些信息的进一步使用作出保证。
如果由于使用或不使用本手册中的信息,或由于使用错误或不完整的信息而造成的物质或非物质相关损失,只要没有证明是上海晶珩电子科技有限公司的故意或过失,就可以免除对上海晶珩电子科技有限公司的责任索赔。
上海晶珩电子科技有限公司明确保留对本手册的内容或部分内容进行修改或补充的权利,无需特别通知。
目录1产品概述 (4)1.1目标应用 (4)1.2规格参数 (4)1.3系统框图 (5)1.4功能布局 (5)1.5包装清单 (7)1.6订购编码 (7)2快速启动 (8)2.1设备清单 (8)2.2硬件连接 (8)2.3首次启动 (9)2.3.1Raspberry Pi OS (Lite) (9)2.3.2使能SSH功能 (10)2.3.3查找设备IP (10)3接线指南 (11)3.1Internal I/O (11)3.1.1micro-SD Card (11)3.1.2天线 (11)4软件操作指引 (11)4.1按键 (11)4.2LED指示 (12)4.3以太网配置 (12)4.4WiFi (13)4.5蓝牙 (13)4.5.1基本用法 (13)4.5.2示例 (14)4.6LoRaWAN (14)4.6.1安装LoRa服务和ChirpStack客户端 (15)4.6.2配置LoRa服务 (15)4.6.3安装ChirpStack服务端 (17)4.6.4添加LoRa网关和终端 (20)5操作系统安装 (23)5.1镜像下载 (23)5.2系统烧录 (23)5.2.1工具准备 (23)5.2.2烧录 (23)5.3基于原版Raspberry Pi OS在线安装BSP (24)6FAQ (24)6.1.1默认用户名密码 (24)7关于我们 (24)7.1关于EDATEC (24)7.2联系方式 (24)1ED-GWL2010是一款基于Raspberry Pi 4B设计的室内轻网关。
- 1、下载文档前请自行甄别文档内容的完整性,平台不提供额外的编辑、内容补充、找答案等附加服务。
- 2、"仅部分预览"的文档,不可在线预览部分如存在完整性等问题,可反馈申请退款(可完整预览的文档不适用该条件!)。
- 3、如文档侵犯您的权益,请联系客服反馈,我们会尽快为您处理(人工客服工作时间:9:00-18:30)。
参数
计算方式、计算参数、装置类型
2 3 4 5 6
电极数目、测深点数目和数据行数 AB/2、AM、OO„/2值 对应于AB/2排列的MN/2。 第一个测深点的电阻率值 第一个测深点的极化率值
7
8 9
……
第N个测深点的电阻率值 第N个测深点的极化率值
如果测深点数目>1
当计算参数取“1”时,该行缺省;
224 18 1 4 3.500e+000 5.000e+000 7.500e+000 1.000e+001 1.500e+001 2.250e+001 3.500e+001 5.000e+001 7.500e+001 1.000e+002 1.500e+002 2.250e+002 3.500e+002 5.000e+002 7.500e+002 1.000e+003 1.500e+003 2.250e+003 2.000e+000 2.000e+000 2.000e+000 2.000e+000 2.000e+000 2.000e+000 2.000e+000 2.000e+000 2.000e+000 2.000e+000 2.000e+000 2.000e+000 2.000e+000 2.000e+000 2.000e+000 2.000e+000 2.000e+000 2.000e+000 1.027e+002 9.828e+001 7.579e+001 5.039e+001 2.237e+001 1.466e+001 1.892e+001 2.641e+001 3.878e+001 5.067e+001 7.334e+001 1.049e+002 1.515e+002 1.985e+002 2.598e+002 3.053e+002 3.664e+002 4.171e+002 9.639e-001 1.092e+000 1.892e+000 3.480e+000 8.447e+000 1.312e+001 1.372e+001 1.373e+001 1.370e+001 1.364e+001 1.342e+001 1.293e+001 1.204e+001 1.104e+001 9.624e+000 8.488e+000 6.820e+000 5.258e+000
1
2
计算区域(即地电断面 范围)的起始测量点号 nb、终止测量点号ne 及测点间距dn
3
各测点的相对高程
二维电阻率极化率人机交互式正反演程序
二极剖面装置数据格式
序号 参数 计算点数mp、 计算点距dm、 计算的起始点 号mb和终止点 号me 参数说明 1. mp必须是整型数,后3个数 据可为实型数据 2. 四个数据的关系为mp=(me- mb)*dm/dn,且mb≥nb,me≤ne 。 3. dm的单位为m。 1. AM的单位为m; 2. A,M电极应位于算区测量点 范围内。 2213 35 85 10.0 13.5 14.5 16.7 20.8 22.4 24.5 28.7 30.4 36.8 40.5 41.3 40.5 41.7 40.4 39.8 38.5 37.4 36.7 35.8 35.4 34.3 33.1 29.4 25.3 24.1 20.2 19.8 18.7 16.3 15.2 14.2 13.2 11.0 8.7 8.3 7.6 5.7 4.0 3.0 2.6 1.0 0.2 -1.0 -2.4 -3.5 -5.3 -5.0 -3.0 -2.0 -1.0 1.0 21 20.0 40.5 80.5 20.0 25.0 26.5 35.5 60.5 90.5 123.4 150.7 190.5 250 350 450 280.5 180.5 95.5 60.5 45.3 30.5 31.4 27.5 30.5 28.0 1.43 1.48 1.95 2.10 2.43 3.5 5.04 7.84 9.25 10.12 11.2 9.5 8.7 6.5 4.8 3.8 2.9 2.6 2.32 1.92 1.64
1
2
AM电极距值
3
实测视电阻率 值
1.正演计算时缺省; 2.视电阻率值依点号大小次序排 列; 3.视电阻率数据个数为mp个。
1. 正演计算时缺省; 2. 视极化率值依点号大小次序 排列; 3. 视极化率数据个数为mp个。
4
实测视极化率 值
二维电阻率极化率自动反演程序
程序适用于二极、三极、对称四极和偶极偶极等测量方式的高 密度电法视电阻率和视极化率数据的反演。三极装置排列的方 式有双边、单边AMN和单边NMA三种方式。
RGIS 2010 系统电法软件介绍
2011年11月
RGIS 2010 电法数据处理与正反演模块
电法勘探是根据地壳中不同岩层或矿石之间存在的电磁性质 差异,利用一系列技术装置观测与研究天然存在的或人工建立 的地下电场或电磁场的分布规律,达到研究地质构造、找矿和 解决其他地质问题的一组地球物理方法技术。 电法勘探方法众多,测量的参数多,每一种方法的工作方式 和效率也不同。不同的方法对不同的勘探目标的分辨能力也不 同。RGIS 2010系统包含电法模块为: 一维直流电阻率和极化率测深正反演程序 二维电阻率极化率人机交互式正反演程序 二维电阻率极化率自动反演程序 二维大地电磁反演程序 一维磁源瞬变电磁正反演 二维磁源瞬变电磁正反演 二维直流电阻率法地形改正
充电装置的供电电源可以位于地表亦可处于地下,但观察位于 地表;充电电源个数可以多个;可以依电位亦可以依电位梯度 计算充电装置下地表的视电阻率和视极化率,还可以考虑地形 高程的影响。充电法有两种观测方法,电位观测法和梯度观测 法。 电位观测法是将测量电极N置于远离测区可视为无穷远处,另 一个测量电极M沿侧线逐点移动,观测相对于N极的电位值U, 同时观测供电电流强度I,观测结果用归一化值U/I表示。 电位梯度观测法是使测量电极M、N保存一定距离,通常等于 1~2个测点距离,沿侧线同时移动,逐点进行电位差U和供电 电流强度I的观测。结果用观测结果(U/I)*MN表示,记录点为 MN之中点。 偶极剖面可进行多个不同间隔系数的偶极断面的电阻率和极化 率计算,但一般不宜多于6~8个间隔系数。 凡测深装置,其布线方向均沿二维剖面方向。
程序能对二极电位、对称四极和偶极偶极测深装置进行一维 层状介质的电阻率和极化率正演理论计算。
程序能对以上装置的实测视电阻率和视极化率自动反演层参 数。
程序涉及的二极电位、对称四极 (MN>0)、对称四极 (MN= =0)、偶极偶极测深 (MN>0) 和偶极偶极测深 (MN=0)等五种 正反演装置实际上仅为三种装置,但是它们的用途不同。 测量电极距 MN>0 与 MN=0 在算法上有差别,理论上对 MN=0 的装置梯度型装置一般计算电场强度,依据电场强度 计算视电阻率。而在野外的实际工作中无法测量电场强度, 只能通过观测点电位值△V,用△V/MN 来逼近电场强度。
一维直流电阻率和极化率测深正反演程序
反演数据文件格式
序号
1
示例数据为轴向偶极(MN>0)装置反演数据
参数说明
反演计算时计算方式取2,反演电阻率时计算参数取1,同时反 演电阻率和极化率时计算参数取2、装置类型依据观测装置不 同分别取值1~5,含义同前表。 电极距自小到大排列 装置类型取1,3,5,该行缺失。须一行输入完毕,不能换行 当计算参数取“1”时,该行缺省;
序号 参数 计算方式ww、计算参 数wu、地形参数wh和 装置类型wq 参数说明 1.正演计算时ww取1,反演计算时ww取2; 2.视电阻率计算时wu取1,同时计算视电阻率和视极化率时 wu取2; 3.地形平坦时wh选择0,地形不平坦时wh选择1; 4.依据观测装置不同wq分别取值1~10,详见上表。 1.dn的单位为m; 2.nb,ne必须整型数据; 3.对于wq<7前的各种装置,该范围必须涵盖电剖面的A,B ,M,N电极,即最边部的电极必须处于该测量点范围内(中 梯装置,A,B供电极例外)。并且在地形不平时,必须有该 部分每点的测量相对高程。 1.相对高程数据个数为ne-nb+1个; 2.在地形平坦时,该部分数据缺省。
2 3 4
电极数目、数据行数 AB/2、AM、OO„/2值 对应于AB/2排列的MN/2。 装置类型取1,3,5,该行缺失。须一行输入完毕,不能换行
114 18 2 3.500 5.000 7.500 10.00 15.00 22.50 35.00 50.00 75.00 100.0 150.0 225.0 350.0 500.0 750.0 1000. 1500. 2250. 2.000 2.000 2.000 2.000 2.000 2.000 2.000 2.000 2.000 2.000 2.000 2.000 2.000 2.000 2.000 2.000 2.000 2.000
一维直流电阻率和极化率测深程序
正演数据文件格式
该模块的输入数据文件较多,所有 输入输出文件均为文本格式,文件 后缀如中表所示。文件格式如下表 所示。数据示例为轴向偶极(MN>0) 装置正演输入数据文件。 序号
1
装置类型
二极装置
正演计算
*.s1f
反演计算
*.s1i
对称四极(MN>0)装置
对称四极(MN=0)装置 轴向偶极(MN>0)装置