Wind loads on marine structures
中大港口河岸工程研究生培养计划

港口海岸及近海工程专业硕士研究生培养方案一、培养目标:培养德、智、体、美全面发展,致力海洋工程科学的高级科技和教学人才。
掌握坚实的本学科基础理论和应用专业知识、熟练运用计算机和一门外国语。
具有从事科学研究或担负专门工程技术工作的能力,并取得较系统的研究成果。
毕业后具有从事科学研究、教学工作,以及海洋工程管理、航运、环保,港建等部门的实际工作。
二、研究方向:1、海洋工程与能源;2、近岸动力学;3、海岸带水环境与遥感;4、海洋环境动力要素对建筑物作用;5、波、流和结构的相互作用;6、海岸港口河道泥沙;7、海岸及近海工程数值模拟及可视化研究;8、海岸及近海工程信息技术及网络研究;9、海洋环境水力学三、学习年限学制3年。
按中山大学《学位与研究生教育工作手册》及中大研院[2003]3号《中山大学硕士研究生培养工作试行办法》有关规定要求。
四、课程设置五、考核方式按中山大学《学位与研究生教育工作手册》及中大研院[2003]3号《中山大学硕士研究生培养工作试行办法》有关规定要求。
六、学位论文工作及发表论文要求按中山大学《学位与研究生教育工作手册》及中大研院[2003]3号《中山大学硕士研究生培养工作试行办法》有关规定要求。
七、参考书目1.波浪理论及其在工程上的应用, 丘大洪,高等教育出版社,19862.随机波浪及其在工程上的应用,俞聿修,大连理工大学出版社,19923.海岸河口动力学, 赵今声等, 海洋出版社 19934.海岸动力学, 薛鸿超等, 人民交通出版社,19805.海洋科学导论, 冯士笮等, 高等教育出版社,20006.河流动力学,王绍成主编,人民交通出版社7.潮汐分析预报,方国洪, 海洋出版社8.Estuaries: a phsical introduction, Dyer, K.R. 1978, John Wiley and Son9.水波动力学,梅强中,科学出版社,198410.水动力学,朱蔚文,张涤明, 高等教育出版社, 199311.计算流体力学,张涤明、蔡崇喜、章克本、詹杰民、黄海,中山大学出版社,1991年12.Journal of Hydraulic Engineering, ASCE.13.Journal of Waterway, Port, Coastal, and Ocean Engineering, ASCE14.Ocean Engineering15.Applied Ocean Research16.International Journal for Numerical Methods in Fluids17.海洋学报18.海洋工程19.水动力学研究与进展, Journal of Hydrodynamics20.力学学报21.水利学报22.遥感学报23.海洋与湖沼24.热带海洋25.海洋技术。
海洋工程结构物风载荷计算方法比较
海洋工程结构物风载荷计算方法比较岳晓瑞;徐海祥;罗薇;詹成胜【摘要】海洋工程结构物作业环境十分复杂,作业期间除了受自身的工作载荷外还受到环境载荷的影响,风载荷是海洋结构物所受的主要环境载荷之一.为保证其作业安全,设计时选择一种合适的风载荷计算方法,为海洋工程结构物提供可靠的风载荷信息十分重要.海洋工程结构物风载荷计算方法较多,文中对目前常用的几种风载荷计算方法进行了介绍,以一艘大型油船为例对其所受的风载荷进行了计算,并将计算结果与实验结果进行了比较.比较分析表明,Blendermann方法的计算结果与实验结果吻合较好.%Operating environment of marine engineering structures is very complex, during the operations besides the work loads, marine engineering structures are also subject to the environment loads,and the wind loads usually play a major role in the environmental loads. To ensure the safety of its operations, it is important to choose an appropriate calculation method for the designers. At present,many methods are used to calculate the wind load on marine engineering structures. In this paper,several of the commonly used wind load calculation methods are introduced, then a VLCC (Very Large Crude Carrier) suffered wind loads are calculated, and the calculation results are compared with the experimental results, which show that the calculation results of the Blendermann's method are close to the experimental results.【期刊名称】《武汉理工大学学报(交通科学与工程版)》【年(卷),期】2011(035)003【总页数】4页(P453-456)【关键词】海洋工程结构物;环境载荷;风载荷;计算方法【作者】岳晓瑞;徐海祥;罗薇;詹成胜【作者单位】武汉理工大学交通学院,武汉430063;武汉理工大学交通学院,武汉430063;武汉理工大学交通学院,武汉430063;武汉理工大学交通学院,武汉430063【正文语种】中文【中图分类】U6620 引言随着陆地资源的日益枯竭,人类对海洋资源的开采活动进入了一个新的阶段,在这一阶段里海洋工程结构物种类繁多.如何保证海洋工程结构物在恶劣的海洋环境中安全作业成为首要问题,海洋工程结构物在作业期间除了受自身的工作载荷外还受到环境载荷的影响.风载荷是海洋结构物所受的一种主要环境载荷,如何提高海洋工程结构物风载荷的计算精度,为设计海洋工程结构物提供可靠的载荷信息十分重要.由于海洋工程结构物具有种类多、上层建筑结构复杂、高度不同等特点,对获得准确的风载荷带来了很大困难.风洞试验是目前获得风载荷最为可靠的方法,但风洞试验具有试验成本高、试验周期长等缺点,设计时对每一个海洋工程结构物进行风洞试验是不切合实际的.针对上述问题,国内外学者提出了多种风载荷计算方法.在国外,Isherwood公式计算风压系数精度较高,被普遍采用[1];Could提出了船舶上层建筑风压力系数和风压力矩的估算方法,该方法考虑了相对风速[2];Blendermann搜集了大量关于风载荷的数据,并在此基础上提出了横向、纵向以及首摇的风载荷系数计算公式[3-4].另外,Blendermann还通过实验数据得出了在不均匀风速下风载荷的计算方法[5];OCIMF提出了超大型船舶风载荷的计算方法,例如计算VLCC所受的风载荷[6];Haddara运用神经网络技术提出了一套计算海洋工程结构物风载荷系数的方法[7];模块法(Building Block Method)也是计算海洋工程结构物所受风载荷的方法之一[8],模块法是将整个水线以上结构离散成不同的标准构件模块,叠加各组成构件的风载荷获得结构物所受的总风载荷.在国内,汤忠谷[9]对15艘长江和近海商船的船模进行了风洞试验,给出了风压合力系数、风压合力角及风压力作用点位置的回归公式;洪碧光[10]通过对50条船模风压系数的风洞试验数据进行回归分析,得出了一种由船型参数来估算风压系数的回归公式.为方便海洋工程结构物设计者选择合适的风载荷计算方法,本文以一艘大型油船为例,分别采用目前常用的几种风载荷计算方法对其所受的风载荷进行了计算,并将计算结果与实验结果进行了比较分析.1 风载荷计算方法目前常用的风载荷计算方法主要包括:1)Blendermann方法 Blendermann通过风洞试验搜集了大量的关于风载荷的数据,并在此基础上得出了横向和纵向风载荷系数计算公式.式中:Cx,Cy分别为纵向、横向风载荷系数;Cd1,Cdq,δ为与船舶类型有关的参数;θ为风向角;AL,AF分别为正纵、正横时的受风面积;SL为受风面积的形心距船中的距离.2)Isherwood公式Isherwood根据各类商船有关压力的大量船模风洞试验结果,按商船上层建筑各特征参数进行回归分析,得出了计算风压力系数和风压力矩系数的回归公式,即Isherwood公式:式中:Cx(θ),Cy(θ)分别为风向角θ时纵向、横向风载荷系数;As为船舶水线以上的侧投影面积;Af为船舶水线以上的正投影面积;Ass为船舶上层建筑的侧投影面积;Loa为船舶总长;B为船宽;c为船舶水线以上部分侧投影面积的周长(除去桅杆和通风筒等细长物体以及水线长度);d为船舶水线以上部分侧投影面积形心到船首的距离;m为船舶侧投影面积中桅杆或中线面支柱的数目;a0,…,a6;b0,…,b6的值参见文献[1].3)Haddara方法 Haddara采用神经网络技术对所搜集的关于船舶所受风载荷实验数据进行了回归分析,得出以下公式:式中:Ck为风载荷系数,k为横向或纵向;AL,AF分别为正纵、正横时的受风面积;Loa为船舶总长;B为船宽;SL为受风面积的形心距船中的距离;δ为风向角;γki,ζkij为权重值.4)模块法(building block method)模块法是计算海洋工程结构物所受风载荷常用的方法之一,也是ABS和DNV建议的方法.模块法是将整个水线以上结构离散成不同的标准构件模块,叠加各组成构件的风载荷获得结构物所受的总风载荷.因此在使用模块法计算之前要求已知各组成构件的载荷特性,其准确性依赖于对构件载荷特性、构件之间影响特性以及模块的划分.其算法如下.由于风在垂直方向是有梯度的,那么海平面高度Z处的风速为式中:Zr为参考高度,一般取10m;vZr为参考高度的风速;p为指数,一般取0.1~0.15之间.构件风载荷计算时采取平均风速式中:A为受风面积;v(y,z)为构件受风面上点(y,z)处的风速.第i个模块所受风载荷式中:vie为第i个模块的平均风速;ρ为空气密度;Csi,Chi分别为第i个模块的形状系数和高度系数;Ai为第i个模块在正横或正纵方向上的投影面积.受风构件的总风载荷Fwind为式中:Ne为划分模块的数量.风载荷系数表达为式中:Cx,Cy分别为纵向和横向的风载荷系数;Fx,Fy分别为纵向和横向的合力;ρ为空气密度;vr为参考风速;Ar为参考面积.5)OCIMF方法 OCIMF提供了超大型船舶计算风载荷的方法并给出了不同球鼻艏和不同载况下的风载荷系数,具体见文献[6].2 实例计算及比较分析为方便海洋工程结构物设计者选择合适的风载荷计算方法,本文以一艘大型油船为例,分别采用上述风载荷计算方法对其所受的风载荷进行了计算,并将计算结果与实验结果进行了比较分析.该大型油船的主要参数为:总长351.4m,船宽55.4m,设计吃水23.5m,横向受风面积为1 131.79m2,纵向受风面积3 401.47m2.为方便风载荷的计算,建立图1所示的坐标系.图1 坐标系图2和图3分别为采用上述几种方法计算该大型油船所受风载荷系数与实验结果在x方向和y方向的比较.图2 几种方法计算大型油船所受x方向上的风载荷系数与实验结果的比较图3 几种方法计算大型油船所受y方向上的风载荷系数与实验结果的比较从图2可以看出,随着风向角的增大,x方向上的风载荷系数变化趋势为先由大逐渐减小,在90°附件时为零,后由小逐渐增大.通过图2的比较可以看出,当风向角较小时,几种方法的计算结果与实验结果吻合较好,随着风向角的增大,与实验结果相比,Isherwood方法和模块法的计算结果相对偏大,OCIMF方法的计算结果相对偏小,而Haddara方法的计算结果当风向角在90°以内时相对偏小,在90°以外时相对偏大.同时可以看出,在风向角的整个变化范围内,Blendermann方法的计算结果均与实验结果吻合较好.从图3可以看出,随着风向角的增大,y方向上的风载荷系数变化趋势为先由小逐渐增大,在90°附近时达到最大,后由大逐渐减小.通过图3可以看出,与实验结果相比,几种计算方法中除了Haddara方法的结果在风向角较小时出现异常外,其它方法的曲线变化趋势与实验吻合较好.3 结论风载荷是海洋结构物所受的主要环境载荷之一.为保证海洋结构物作业安全,设计时选择一种合适的风载荷计算方法,为其提供可靠的设计风载荷信息十分重要.本文首先对目前常用的几种风载荷计算方法进行了介绍,然后以一艘大型油船为例对其所受的风载荷进行了计算,并将计算结果与实验结果进行了比较.比较分析表明,Blendermann方法的计算结果与实验结果吻合较好.参考文献[1]Isherwood R M.Wind resistance of merchant ship[J].Trans.of RINA,1973(115):132-138.[2]Gould R.The estimation of wind loads on ship superstructures[J].The Royal Institution of Naval Architects,1982(8):34-40.[3]Blendermann W.Wind loads on moored and manoeuvring vessels [J].OMAE,Offshore Technology,1993(1):183-189.[4]Blendermann W.Parameter identification of wind loads on ships'[J].Journal of Wind Engineering and Industrial Aerodynamics 51,1994(2):339-351.[5]Blendermann W.Estimation of wind loads on ships in wind with a strong gradient,offshore technology[J].1995(1-A):271-277. [6]OCIMF,Prediction of wind and current loads on VLCCs[M].2nd ed.Oil Companies International Marine Forum,1994.[7]Haddara M R.Wind loads on marine structures[J].Marine Structures,1999(12):199-209.[8]陈恒.深海半潜式平台动力定位推力系统设计研究[D].上海:上海交通大学船舶海洋与建筑工程学院,2008.[9]汤忠谷.水面船舶的空气动力[J].武汉水运工程学院学报,1982(4):79-89.[10]洪碧光.船舶风压系数计算方法[J].大连海运学院学报,1991,17(2):113-121.。
Alongwind static equivalent wind loads and response of tall buildings. Part I

Journal of Wind Engineeringand Industrial Aerodynamics79(1999)135—150Alongwind static equivalent wind loadsand responses of tall buildings.Part I: Unfavorable distributions of static equivalent wind loadsYin Zhou*,Ming Gu,Haifan XiangState Key Laboratory for Disaster Reduction in Ci v il Engineering,Department of Bridge Engineering, Tongji Uni v ersity,Shanghai200092,People+s Republic of ChinaReceived1April1997;received in revised form12September1997;accepted6October1997AbstractAlthough on the same theoretical basis,the current standards of major countries have set out two evidently different distributions of alongwind static equivalent wind loads,one being the same as the mean wind force and the other the same as thefirst mode shape on tall buildings.In this paper,thefluctuating static equivalent wind load is evaluated as mean,background and resonant components,and the unfavorable distribution of each component is separately addressed.Meanwhile,the wind loads by the above two code methods are derived.The effects of the wind loads by the two code methods on tall buildings are then examined to identify whether or not they are equivalent with regard to the actual wind induced responses.The results show that the wind loads by the two code methods can only ensure an equivalentfirst mode displacement response,and they may lead to some considerably unfavorable load effects, for example,the base shear force estimation.Finally a numerical example demonstrating the main results is given. 1999Elsevier Science Ltd.All rights reserved.Keywords:Static equivalent wind load;Gust loading factor method;Tall buildingNomenclaturec, constants,normalization factor and exponent of thefirst mode shape C\@background response deviation factor of the GBJ code method C\ ?,C0\ ?background and resonant response deviation factors of the GLFmethodC(z)drag force coefficientD(z),D (z),D0 (z)average,peak background and peak resonantfirst mode dis-placement response*Corresponding author.E-mail:yinzhoutj@.0167-6105/99/$—see front matter 1999Elsevier Science Ltd.All rights reserved.PII:S0167-6105(97)00297-3136Y.Zhou et al./J.Wind Eng.Ind.Aerodyn.79(1999)135–150f , frequency and critical damping ratio in thefirst mode g,g0background and resonant peak factorG,G0,G background,resonant component of gust factor and thegust factorH,B,D height,width and depth of the buildingi A, constants describing the influence functioni(z)influence functionJ&,J8joint acceptance function in horizontal and vertical direc-tionm(z)mass per unit heightp(z), (z)fluctuating wind pressure and its RMS valueP\ ?(z),P\@(z),P(z)peak background equivalent wind load by the GLFmethod,GBJ code method and of the actual valueP0\ ?(z),P0(z)peak resonant equivalent wind load by the GLF methodand of actual valueP(z),P(z)peak and average wind forceQ(z)load response correlation factorr,r,r0,r mean,peak background,peak resonant and peak resultantresponse of arbitrary typeR V,R X coherence of the applied wind pressure¹observation timeu(z), S,S S(f)fluctuating wind velocity,its RMS value and spectrum º(z)average wind velocity½(z),½(z)peak and average displacement responseexponent of average wind velocity profile(z)thefirst mode shape1.IntroductionThe alongwind responses of tall buildings under gusty wind are well known due primarily to the work of Davenport and other researchers in the early1960s;however, two voids associated with procedures to aid in the design still can be found in the literature to date:thefirst is on the distributions of the static equivalent wind loads; the second is on the effects of the mode shapes.Considerations of these two problems are separately the subjects of the present paper(Part I)and a companion paper (Part II).The“gust loading factor”method[1],originally introduced by Davenport(1967)as a classic method for computing the wind-induced dynamic responses in alongwind, has been developed and applied in almost all the current standards of the major countries.The“gust loading factor”is defined as the ratio between the peakfluctuat-ing displacement response and the mean displacement response.Because the mean wind force and the mean responses are generally appreciated by the engineers,the wind-induced peak dynamic displacement response can easily be obtained when the gust loading factor is available.Besides the displacement response,the engineers alsoY.Zhou et al./J.Wind Eng.Ind.Aerodyn.79(1999)135–150137 care for the internal forces,stresses and strains,etc.It is more convenient to providethe static equivalent wind load for engineering use.However,the same attention to the“gust loading factor”has not been paid to thestudy of the static equivalent wind load to date.According to the“gust loading factor”method,the static equivalent wind load is equal to the mean wind force multiplied bythe“gust loading factor”,then the distribution of the equivalent wind load with thebuilding height obeys a2 exponential law( is the exponent of the mean windvelocity profile),just as the mean wind force does.Among the current standards of themajor countries and associations,the American Code ANSI/ASCE-93[2],CanadianCode NBC-1995[3]and the RLB-AIJ1993[4],etc.,all provide this kind of2exponent wind load(hereafter referred to as GLF method).However,it has generallybeen recognized that the distribution of the resonant static equivalent wind load withthe building height should obey a exponential law( is the exponent of thefirstmode shape;provided that the distribution of the mass along the building height isuniform).In general,2 varies in the range of0.2—0.7,while is around1for typicaltall buildings.So,the wind load by the GLF method is evidently different from the exponent resonant equivalent wind load.It is quite doubtful that the2 exponent wind load by the GLF method can ensure the same effects as the actual values.On theother hand,the static equivalent wind load provided by the Chinese Loading Code,GBJ9-87[5],is equal to the inertial wind force producing the samefirst modedisplacement response as the actual value,and obeys the exponential law(hereafterreferred to as GBJ code method).The Australian Code,AS1170.2-89[6],however,does not provide the static equivalent wind load and only gives a gust base momenteffect factor.As far as the static equivalent wind load on tall buildings is concerned,itseems that the misleading conception still exists.In this paper,thefluctuating static equivalent wind load is evaluated as mean,background and resonant components according to the actual response character-istics of tall buildings to gusty wind.The unfavorable distributions of these threecomponents are separately set out.Meanwhile,the wind loads by the two codemethods(GLF method and GBJ code method)are provided.Because of the evidentdifference of the wind loads distributions,the load effects of the wind loads by the twocode methods are then examined to identify whether or not they are equivalent withregard to the actual wind-induced responses of tall buildings.Finally,a numericalexample demonstrating the main results is given.2.Assumptions(1)The quasi-steady and strip theory are effective for the alongwind problem.Thewind pressures in upwind and leeward are assumed to be fully correlated[7].Thebuilding responded linear-elastically to the gusty wind.(2)Uniform rectangular building,the width and the force coefficient are bothconstants along the height of the building:B(z)"B,C (z)"C .(1)(3)The mass per unit height is constant in the vertical direction:m (z )"m .(2)(4)Negligible resonant responses in modes higher than the first.The fundamental mode shape can be described by(z )"c (z /H )@(3)where c and are both constants.(5)Mean wind velocity can be described byº(z )"º&(z /H )?(4)in which º&is the mean wind velocity evaluated at the top of the building,H .(6)The spectrum describing the fluctuating wind is a Davenport-type spectrum.The RMS fluctuating wind velocity, S ,is constant with the height.(7)Negligible aerodynamic damping or other aeroelastic effects.(8)The coherence of the fluctuating wind pressure is slightly different from that in Ref.[1]asR V (x ,x ,f )"exp(!c "x !x"),R X (z ,z ,f )"exp(!c "z !z "),c "8f h /º(h ),h "0.6H (5)in which h is the reference height [8].Correspondingly,the joint acceptance functions in the horizontal direction and vertical direction are separately defined as"J &(f )" "1BR V (x ,x )d x d x ,(6)"J 8( , ,f )" "(1# # ) H & &(z /H )?>@(z /H )?>@R 8(z ,z )d z d z .(7)(9)The influence function of the building under externally applied or static equiva-lent loads is assumed to be in the formi (z )"i A (z /H )@ ,(8)where i A , are both constants.The influence function is applicable to arbitrary load effects for instance,the internal forces,stress,deflection,and so on. is the exponent of the influence function,and is usually different for different responses.For the base shear force and base moment responses,the coefficients are i A "1, "0and i A "H ,"1,respectively.138Y.Zhou et al./J.Wind Eng.Ind.Aerodyn.79(1999)135–1503.Formulae of actual static equivalent wind loads and load effectsIn this section,the static equivalent wind load is separately evaluated as mean,background and resonant components.The latter two components are assumed to be uncorrelated and are combined using a “root sum of squares ”rule [9].3.1.Mean wind forceThe mean wind force can be easily derived:P (z )"12º &C B (z /H ) ?.(9)Its effect on the structure isr "&P (z )i (z )d z "12 º &C Bi A H 1# #2 .(10)3.2.Background component and its load e ffectsThe background responses at frequencies below the natural frequency are essential-ly quasi-static and the structure’s response is not affected by its dynamic behavior.The background responses can be derived as [9]p (x ,z )" º(z )u (x ,z )C B,(11)r "g & &p (x ,z )p (x ,z )i (z )i (z )d x d x d z d zd f "g º&C BHi A (1# # ) S S (f )"J &(f )" "J 8( , ,f )" d f (12)where p (x ,z )is the fluctuating wind pressure on the surface of the building at the point (x ,z );the contribution of the second order term of the fluctuating wind velocity has been neglected.The determination of the static equivalent wind load associated with the back-ground response is somewhat difficult because of the correlation of the applied wind pressure.The “load response correlation ”method,which was originally introduced by Kasperski et al.[10],may be one of the effective approaches.If the correlation coefficient between the fluctuating wind load at height z and the load effect at height z can be denoted by Q (z ),then the peak background load distribution can be Y.Zhou et al./J.Wind Eng.Ind.Aerodyn.79(1999)135–150139given byP (z )"g Q (z )(z ),(13)Q (z )" & p (z ,x )p (z ,x )i (z )d x d x d z d f ( & & p (z ,x )p (z ,x )i (z )i (z )d x d x d z d z d f )(z ),(14) (z )"( º(z )C ) S S (f )R V (x ,x )d x d xd f ," º&CB S S (f )"J &(f )" d f (z /H )?,(15)where g ,the background peak factor,is assumed to be 3.7in this paper [6], (z )is the RMS fluctuating externally applied wind force evaluated at height z .It can be seen from Eqs.(13)—(15)that the distribution of the background equiva-lent wind load is independent of the dynamic behavior,but is dependent on the load effect concerned.3.3.Resonant component and its load e ffectsUsing methods of random vibration theory and spectral analysis,and white-noise excitation assumption,the first mode peak resonant displacement response can be computed fromD 0 (z )"g 0 º&C B (2 #1)m (2 f )(1# # )"J &(f )#J 8( , ,f )" f 4 S S (f ) z H @.(16)The resonant equivalent fluctuating wind load can be represented by the inertial forceP 0 (z )"m (z )(2 f ) D 0(z )"g 0 º&C B (2 #1)(1# # )"J &(f )#J 8( , ,f )" f 4S S (f ) z H @,(17)g 0"(2ln(f ¹)#0.577(2ln(f ¹),(18)in which f and are the natural frequency and the critical damping ratio of the first mode,respectively.¹is the observation time,and is set to be 600s in this paper.It can be seen that the distribution of the resonant equivalent wind load obeys the ex-ponential law.140Y.Zhou et al./J.Wind Eng.Ind.Aerodyn.79(1999)135–150The load effect of the resonant equivalent wind load component isr 0 "& P 0 (z )i (z )d z "g 0 º&C BH (2 #1)i A (1# # )(1# # )"J &(f )#J 8( , ,f )" f 4S S (f ).(19)3.4.Resultant equi v alent wind load and e ffectsThe mean wind force and the resonant equivalent wind load obey the 2 and exponential law,respectively,and they are both independent of the response.Nevertheless,the distribution of the background equivalent wind load is not indepen-dent of the type of the response.It is suggested that the resultant peak load effects rather than the equivalent wind loads be combined in the following wayr (z )"r (z )#((r (z )) #(r 0(z )) .(20)4.Equivalent wind loads and effects based on the “gust loading factor ”methodAs mentioned earlier,the equivalent wind load (or its components)by the GLF method is equal to the mean wind force multiplied by the gust factor (or its compo-nents).Based on this judgment,the equivalent wind load components by the GLF method are deduced in this section.4.1.Background component and its load e ffectsThe first mode mean displacement response,which is useful for the derivation of the formulae in this section,can be easily obtained:D (z )"2 #12 # #1) º &BC 2m (2 f) z H @.(21)The first mode background displacement response can be computed from D (z )"g º&C B (2 #1)m (2 f ) (1# # ) S S (f )"J &(f )" "J 8( , ,f )" d f z H @.(22)The background equivalent wind load is equal to the mean wind force multiplied bythe background gust factor,that isP \ ?(z )"G P (z )"D (z )D (z )P (z )"g º&C B (2 # #1)(1# # ); S S (f )"J &(f )" "J 8( , ,f )" d f z H?.(23)Y.Zhou et al./J.Wind Eng.Ind.Aerodyn.79(1999)135–150141The arbitrary peak background response can be derived asr \ ?"&P \ ?(z )i (z )d z "g º&C BH (2 # #1)i A (1#2 # )(1# # );S S (f )"J &(f )" "J 8( , ,f )" d f.(24)4.2.Resonant component and its load e ffects Similarly,with the first mode resonant displacement response (Eq.(16)),the reson-ant equivalent wind load can be obtainedP 0\ ?(z )"G 0P (z )"D 0 (z )D (z )P (z )"g 0 º&C B (1# #2 )(1# # );"J &(f )#J 8( , ,f)" f 4S S (f ) z H ?.(25)The arbitrary resonant response can be computed from r 0\ ?"&P 0\ ?(z )i (z )d z "g 0 º&C BH (1#2 # )i (1#2 # )(1# # );"J &(f )#J 8( , ,f )" f 4 S S (f ).(26)5.Equivalent wind loads and effects by the GBJ code methodThe dynamic equivalent wind load (or its components)by the GBJ code method is equal to the inertial wind force producing the same first mode displacement response as the actual value.It means that the resonant equivalent wind load and effects by the GBJ code method are equal to the actual ones or Eqs.(17)and (19).But the background component is different,which is derived in this section.With the first mode background displacement response (Eq.(22)),the background equivalent wind load by the GBJ code method can be easily obtained:P \@(z )"m (2 f ) D(z )"g º&C B (2 #1)(1# # )S S (f )"J &(f )" "J 8( , ,f )" d f z H @.(27)142Y.Zhou et al./J.Wind Eng.Ind.Aerodyn.79(1999)135–150The arbitrary background response can then be computed from r\@"&P\@(z)i(z)d z"(2 #1)g º&C BHi(1# # )(1# # ) S S(f)"J&(f)" "J8( , ,f)" d f .(28) 6.Deviation factors of the load effects and parametric analysisExcept for the mean wind load,the distributions of the background and resonant equivalent wind load components by the two code methods are different from those of the actual ones as indicated in the above sections.It is necessary to study the effects of the loads on the responses to identify whether or not they are equivalent with regard to the actual wind induced responses.In this section,the effects of background and resonant wind load components are separately examined.6.1.Background response de v iation factorsThe background response deviation factors,C,are defined as the ratio of the load effects of the background equivalent wind loads by the two code methods to the actual background response,and they can be deduced using Eqs.(12),(24)and(28)asC\ ?"r\ ?/r"(1#2 # )(1# # )( S S(f)"J&(f)" "J8( , ,f)" d f)(1#2 # )(1# # )( S S(f)"J&(f)" "J8( , ,f)" d f),(29)C\@"r\@/r"(1#2 )(1# # )( S S(f)"J&(f)" "J8( , ,f)" d f)(1# # )(1# # )( S S(f)"J&(f)" "J8( , ,f)" d f).(30) For thefirst mode displacement response the exponent of the influence function " (refer to Eqs.(16),(21)and(22)),the background factor C\ ?"C\@"1 regardless of the values of other parameters.It means that thefirst mode background displacement responses by both the GLF method and the GBJ code method are equivalent to the actual value.The sensitivity of background deviation factor of the GLF method,C\ ?,to its parameters is illustrated in Fig.1.It can be seen from Fig.1that the background deviation factor of the GLF method is sensitive to the parameter (i.e.the type of response).In Fig.1a, "1,which is an assumption generally adopted in most codes.The background factor is relatively Y.Zhou et al./J.Wind Eng.Ind.Aerodyn.79(1999)135–150143Fig.1.Background response deviation factor of GLFmethod.Fig.2.Background response deviation factor of GBJ code method.disperse with regard to its parameters,but ranges within a rather small region of 0.96—1.03.It seems that the 2 exponent background equivalent wind load by the GLF method is a fairly good approximation of the actual response dependent background wind loads.In Fig.1b, "0.15,and varies.The background factor varies in a slightly wider region than that for "1,but still within 5%.The sensitivity of background deviation factor of the GBJ code method,C \@,to its parameters is illustrated in Fig.2.From Fig.2,it can be seen that the background deviation factor of the GBJ code method is also sensitive to parameter .In Fig.2a, "1.The background factor ranges from 0.84to 1.05as varies from 0.1to 0.35.In Fig.2b, "0.15,and varies.The background factor varies in a wider region than that for "1of 0.67—1.05as from 0.5to 2.0.When "0.15,as far as the base shear force response is concerned,the background factor is 0.85as "1,and 0.67as "2.0.It means that the 144Y.Zhou et al./J.Wind Eng.Ind.Aerodyn.79(1999)135–150Fig.3.Resonant response deviation factor of GLF method.equivalent wind load by the GBJ code method will lead to unsafe background responses.For the majority of structures,the background responses will be dominant[3],the GBJ code method will correspondingly result in unsafe design.It should be pointed out that,because the background factor is related not only to the parameters , , ,but also to the definitions of the wind spectrum and correla-tion of the wind pressure,when the latter definitions are different from those adopted in this paper,the factor will be somewhat different.Another factor that should be pointed out is that,the integration region adopted in the computation of the response is 0—H .For some kinds of responses,such as the shear forces in the middle stories,this would not certainly be an unfavorable region [11].6.2.Resonant response de v iation factorAs mentioned earlier,the resonant equivalent wind load and effects by the GBJ code method are the same as the actual values.Only the resonant response deviation factor of the GLF method,C 0\ ?,is addressed ing Eqs.(19)and (26),the factor can be deduced asC 0\ ?"r 0\ ?/r 0 "(1#2 # )(1# # )(1#2 #)(1#2 ).(31)Like for the background factor,the resonant factor C 0\ ?"1when " .That is to say,the resonant equivalent wind load given by the GLF method is also equivalent with regard to the first mode displacement response.The sensitivity of the resonant factor to its parameters is illustrated in Fig.3.In Fig.3a, "1.The resonant factor of the GLF method is also sensitive to parameter but varies in a wider range than the corresponding background factor of 0.92—1.23.The resonant factor gradually approaches unity as increases,which implies a closer wind load to the actual resonant equivalent wind load.For the base shear force ( "0),the factor is as high as 1.23when "0.10,which can hardly be neglected.In Fig.3b, "0.15and varies.The resonant factor is more sensitive tothan to ,and varies in a wider range than that in(a)of0.93—1.52as from0.5to2.0. For the base shear force response,the factor is1.18when "1.0,while it is1.52when "2.0.The effect of non-linear mode shape( O1)will be examined in the compan-ion paper(part II).7.Numerical exampleAn assumed tall building,H;B;D"200;50;40m with50floors.The mass per unit height is m "234275kg/m.Itsfirst-mode frequency is0.2Hz,the critical damping ratio is0.01.The reference wind velocity at10m height is30m/s,the exponent of the wind velocity profile is "0.15,the intensity of the turbulence wind evaluated at10m height is S/º "0.2.In this section,the background equivalent wind loads for the base shear force,the base moment and thefirst mode displacement response are computed with the“LRC method”,the background equivalent wind loads by the two code methods are alsoFig.4.Background equivalent wind loads and their shear force,moment,displacement responses.(A)Mean wind force;(B)Background equivalent wind load for the base shear force;(C)Background equivalent wind load for the base moment;(D)Background equivalent wind load for thefirst mode displacement response;(E)Background equivalent wind load by the GLF method;(F)Background equivalent wind load by the GBJ code method.computed.Meanwhile,mean wind force,resonant equivalent wind load of actual and by the GLF method are also provided.The distributions of the above loads and the distributions of the shear force,moment and displacement responses under the action of those loads are separately illustrated in Figs.4and5.Define the“gust effect factor”as the ratio between the resultant peak response of arbitrary type r(Eq.(20))and the mean value r(Eq.(10)).Considering the factors for the base shear force,base moment,and thefirst mode displacement responses,the results for this numerical example with different methods are listed in Table1.It can be concluded from this numerical example that:(1)The distributions of the background equivalent wind loads for different re-sponses computed by the LRC method are different from each other,and they are also different from those given by the two code methods.Meanwhile,the2 exponent resonant equivalent wind load given by the GLF method is also evidently different from that given by the GBJ code method or the actual exponent resonant equivalent wind load.(2)Different load effects have been obtained as expected resulting from the different distributions of equivalent wind loads.Although thefirst mode displacement response is identical between the three kinds of equivalent wind loads,the conclusion cannot beFig.5.Resonant equivalent wind loads and their shear force,moment,and displacement responses.(A)The mean wind force;(B)the resonant equivalent wind load of actual value or by the GBJ code method;(C)the resonant equivalent wind load by the GLF method.Table1Gust effect factorBase shear force Base moment First modedisplacementMethod of this paper 2.29 2.51 2.57GLF method 2.57 2.57 2.57GBJ method 2.19 2.49 2.57extended to other load effects.For this numerical example,as far as the base shear force response is concerned,the background responses by GLF method and GBJ code method and the resonant response by GLF method are separately98.2%,74.8%and 131.4%of the actual values,the latter two can hardly be neglected even from the engineering viewpoint.(3)The gusty effect or the gust effect factor is different for a given building depending on which response is concerned.However,the gust effect factor by the GLF method for any kind of response is the same,namely the“gust loading factor”or thefirst mode displacement gust effect factor,which will inevitably result in inconsist-encies.For the base shear force response of this example,the gust effect factor by the GLF method is12%larger than the actual value.(4)Although the background base shear force response by the GBJ code method is 25.2%lower than the actual value,the resultant response is only4.4%less because for this numerical example the resonant response is dominant.(5)The background responses under the action of the background equivalent wind loads computed by the LRC method are truly most unfavorable,which confirms the effectiveness of the LRC method.Furthermore,the adoption of the LRC method in this paper can also ensure a consecutive transition of the formulae suitable for buildings from relative low or rigid to high andflexible.8.ConclusionsIn this paper,thefluctuating static equivalent wind load is separately evaluated as mean,background and resonant components according to the actual response char-acteristics of the tall buildings to gusty wind.The background equivalent wind load component is derived with the LRC method,while the resonant component is represented by the inertial wind force.Meanwhile,these components are also pro-vided with two code methods,namely the GLF method and the GBJ code method. Because of the evidently different distributions of the equivalent wind loads given by different methods,the effects of the equivalent wind loads on the responses are then examined to identify whether or not they are equivalent with regard to the actual wind-induced responses of tall buildings.The results show that the wind loads by thetwo code methods can only ensure an equivalentfirst mode displacement response, while they may lead to some considerably unfavorable load effects,for example,the base shear force estimation.Although the resonant equivalent wind load component is the same as the actual value,the background component by the GBJ code method is not identical to the actual value,which will lead to unsafe response estimation.For the majority of structures the background responses will be dominant.Because the GBJ code method may result in unsafe design,it is not suitable for code use.Neither the background nor the resonant component by the GLF method is identical to the actual wind load.Because the deviation of the background responses is generally within5%,the background component by the GLF method is a fairly good approximation for the actual response dependent equivalent wind loads.How-ever,the same conclusion cannot be extended to the resonant component which may lead to some considerably unfavorable resonant response,for example,the base shear force estimation.When the building is high,flexible or with low damping,the resonant response will be dominant.The GLF method will then result in excessively conserva-tive design and is not suitable for code use.The distributions of the mean wind force and the resonant equivalent compon-ent obey respectively the2 and exponent law.The distribution of the back-ground component is dependent on the load effect concerned,but it can be well approximated with the2 exponentfirst mode displacement equivalent wind load.With these load components,the corresponding load effect components can easily be obtained and then be combined to the resultant effect using Eq.(20)in this paper.AcknowledgementsThe research work in this paper is jointly supported by the Chinese National Science Foundation and by the Chinese National Science Foundation for Outstand-ing Youth Scientists.This support is gratefully acknowledged.The work is also partially under a Joint Research Program with Fujita Corporation of Japan,the authors would like to express appreciation to the Corporation forfinancial support, as well as to Dr.M.Nakayama of the Corporation for kindly supplying of some relevant materials.References[1]A.G.Davenport,Gust loading factors,J.Struct.Div.,ASCE93(ST3)(1967)11—34.[2]ASCE,Minimum Design Loading for Buildings and Other Structures,ANSI/ASCE7-93,1994.[3]NRCC,User’s Guide-NBC1995Standard Commentaries,1996.[4]Architectural Institute of Japan,Recommendations for loading on buildings,RLB-AIJ1993(Englishversion),1996.[5]Chinese Code of Loading on Buildings and Other Structures,GBJ9-87,1990(in Chinese).[6]Australian Standard,AS1170.2-89,SAA Loading Code,1989.。
Wind Tunnel Testing of Buildings-PNAP150
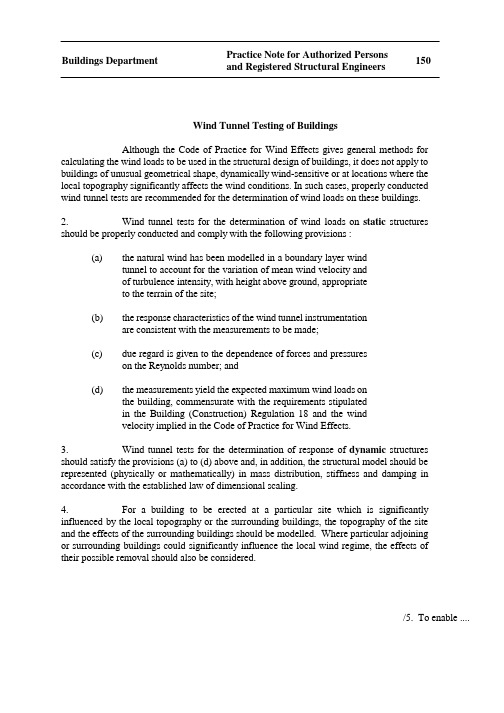
Wind Tunnel Testing of BuildingsAlthough the Code of Practice for Wind Effects gives general methods for calculating the wind loads to be used in the structural design of buildings, it does not apply to buildings of unusual geometrical shape, dynamically wind-sensitive or at locations where thelocal topography significantly affects the wind conditions. In such cases, properly conductedwind tunnel tests are recommended for the determination of wind loads on these buildings.2.Wind tunnel tests for the determination of wind loads on static structuresshould be properly conducted and comply with the following provisions :(a)the natural wind has been modelled in a boundary layer windtunnel to account for the variation of mean wind velocity andof turbulence intensity, with height above ground, appropriateto the terrain of the site;(b)the response characteristics of the wind tunnel instrumentationare consistent with the measurements to be made;(c)due regard is given to the dependence of forces and pressureson the Reynolds number; and(d)the measurements yield the expected maximum wind loads onthe building, commensurate with the requirements stipulatedin the Building (Construction) Regulation 18 and the windvelocity implied in the Code of Practice for Wind Effects.3.Wind tunnel tests for the determination of response of dynamic structuresshould satisfy the provisions (a) to (d) above and, in addition, the structural model should be represented (physically or mathematically) in mass distribution, stiffness and damping in accordance with the established law of dimensional scaling.4.For a building to be erected at a particular site which is significantly influenced by the local topography or the surrounding buildings, the topography of the siteand the effects of the surrounding buildings should be modelled. Where particular adjoiningor surrounding buildings could significantly influence the local wind regime, the effects oftheir possible removal should also be considered./5. To enable ....- 2 -5.To enable the Building Authority to consider fully the testing proposal,authorized persons (APs)/registered structural engineers (RSEs) are advised to submit amethod statement of the wind tunnel study to prove its acceptability, before structural plansare submitted for approval. The method statement should contain the procedure onmodelling and measurement and the methodology for analysis and prediction of wind effectson the building.6.Recommended values which will meet the provisions of wind tunnel tests andpublications are given in Appendix A to assist APs and RSEs in considering the technical ----aspects.(Helen C P Lai YU)Building AuthorityRef. : BD GP/BREG/C/15First issued December 1991 (GSE)This revision June 1994 (AD/SE)Index under : Wind Tunnel TestingPNAP 150Appendix A Recommended Values for Wind Tunnel Modelling(a)Power law approximations can be used for the variation of mean wind velocity and ofturbulence intensity in the simulation of natural wind. The recommended values are :(i)General TerrainPower exponent for mean wind velocity= 0.19Power exponent for turbulence intensity= -0.26Gradient height=200 mReference turbulence intensity at 75 m height= 0.10 (ii)Built-up TerrainPower exponent for mean wind velocity= 0.33Power exponent for turbulence intensity= -0.4Gradient height=300 mZero plane displacement= 25 mReference turbulence intensity at 75 m above zero plane= 0.18 Where the topography effects are particularly important, the figures above mayrequire adjustment. In such case site-specific studies of wind speeds and tubulenceproperties to establish the wind profile are recommended.(b)For the determination of local pressures, a gust duration of 1 second is recommendedand thus the wind tunnel instrumentation should be able to measure fluctuationsshorter than a period t m, where :linear ratio of model to full-scalet m = 1 second xvelocity ratio of model to full-scale(c)For general situations, a geometrical length scale of the model greater than 1:500 anda velocity scale greater than 1:10 is recommended. For shapes sensitive to Reynoldsnumber, such scales may not be sufficient and the method statement should addressthe special scaling requirement.(d)The 50-year return mean hourly gradient velocity implied in the Code is 64 m/s. Publications on Technical Aspects of Wind Tunnel Tests(a)N.J. Cook. "The Designer's Guide to Wind Loading of Building Structures". BuildingResearch Establishment Report. Butterworths, London, Part 1:1986 and Part 2:1990. (b)"ASCE Manual on Engineering Practice No. 67 - Wind Tunnel Model Studies ofBuildings and Structures". ASCE, New York, 1987.。
自主研发数值波浪水槽及其在海洋工程与技术专业实验教学中的应用

自主研发数值波浪水槽及其在海洋工程与技术专业实验教学中的应用作者:来源:《高教学刊》2021年第34期摘要:针对物理模型实验成本高且存在比尺限制等问题,采用光滑粒子流体动力学(SPH)方法自主研发数值波浪水槽,并与物理波浪水槽相结合应用于海洋工程与技术专业的波浪实验课程教学。
教学改革和实践表明,数值与物理波浪水槽相辅相成,可为学生提供灵活机动的创新实验平台,基于数值波浪水槽的虚拟仿真实验可充分调动学生积极探索的热情和主动学习的兴趣,为培养海洋工程与技术专业的领军人才奠定坚实基础。
关键词:数值波浪水槽;虚拟仿真;教学改革中图分类号:G642 文献标志码:A 文章编号:2096-000X(2021)34-0104-04Abstract: Combined with the physical wave tank, the numerical wave tank is applied to the wave experiment teaching of marine engineering and technology major by using the smooth particle hydrodynamics(SPH) method due to the high cost and scale limitation of physical model. The teaching reform and practice show that the complementation of numerical and physical wave tank can provide flexible innovative experimental platform for undergraduate students. Virtual simulation experiment based on numerical wave tank can fully mobilize students' enthusiasm for activeexploration and interest in active learning, and lay a solid foundation for training leading personnel in Marine Engineering and Technology.Keywords: numerical wave tank; virtual simulation; teaching reform波浪的形成变化及传播规律是研究海岸地貌演变、港口及航道工程及海岸带资源利用与保护的基础,是土木、水利及海洋工程专业学生需牢固掌握的基本内容[1]。
某海域极端环境下15万吨级FPSO波浪荷载数值研究

第21卷第4期装备环境工程2024年4月EQUIPMENT ENVIRONMENTAL ENGINEERING·109·某海域极端环境下15万吨级FPSO波浪荷载数值研究刘中柏1,高宁波2*,唐鑫彤3,徐业峻1(1.中海油能源发展股份有限公司采油深圳分公司,广东 深圳 518052;2.武汉船舶职业技术学院,武汉 430050;3.中国船级社海工技术中心,天津 300457)摘要:目的评估在役15万吨级FPSO在某海域百年一遇极端波浪作用下典型横剖面的水动力特性,进而得到FPSO的极值荷载,作为FPSO返坞改造的关键控制参数。
方法基于国产自主三维频域线性势流软件COMPASS-WALCS,建立15万吨级FPSO湿表面网格模型,根据三维绕射-辐射理论,计算湿表面上的水动力荷载,将每个绕射单元上的水动压力直接映射到结构模型上进行计算。
采用谱分析方法对百年一遇海况进行分析,得到短期运动极值响应。
对响应幅值算子(RAO)和波能谱密度进行谱分析,得到极端波浪下的响应谱,进而得到浮体运动和波浪荷载短期预报各种统计值,利用统计方法求得短期响应的最大值。
结果计算了船中部Fr143横剖面的载荷极值,即垂向弯矩、垂向剪力、剖面型心加速度等,发现船舶迎浪时弯矩值最大,随着浪向角增大,弯矩值逐渐减小,剖面垂向剪力则随着浪向角增大逐渐增大。
结论 FPSO 在极端波浪作用下,其大迎浪角条件下荷载更加危险,需要给予格外关注。
关键词:浮式生产储卸油装置;势流理论;极端波浪;响应幅值算子;水平弯矩;加速度中图分类号:TG630 文献标志码:A 文章编号:1672-9242(2024)04-0109-07DOI:10.7643/ issn.1672-9242.2024.04.013Wave Loads of a 150 000-ton FPSO in Extreme Environment of a Sea AreaLIU Zhongbai1, GAO Ningbo2*, TANG Xintong3, XU Yejun1(1. CNOOC Energy Technology & Service-Oil Production Services Co., Guangdong Shenzhen 518052, China;2. Wuhan Institute of Shipbuilding Technology, Wuhan 430050, China;3. China Classification SocietyOcean Engineering Technology Center, Tianjin 300457, China)ABSTRACT: The work aims to evaluate the hydrodynamic characteristics of a typical cross section of a 150 000-ton FPSO un-der extreme wave conditions, occurring in a once-in-a-century wave climate in the South China Sea to obtain the extreme load imposed on the FPSO and use it as a critical control parameter for the FPSO’s dry-dock retrofit. Based on the domestically de-veloped 3D frequency-domain linear potential flow software COMPASS-WALCS, a wet surface grid model of the 150 000-ton FPSO was constructed. The three-dimensional diffraction-radiation theory was used to calculate the hydrodynamic loads on wet收稿日期:2024-03-05;修订日期:2024-04-01Received:2024-03-05;Revised:2024-04-01基金项目:中国博士后科学基金(2017M612541)Fund:China Postdoctoral Science Foundation (2017M612541)引文格式:刘中柏, 高宁波, 唐鑫彤, 等. 某海域极端环境下15w吨级FPSO波浪荷载数值研究[J]. 装备环境工程, 2024, 21(4): 109-115. LIU Zhongbai, GAO Ningbo, TANG Xintong, et al.Wave Loads of a 150,000-ton FPSO in Extreme Environment of a Sea Area[J]. Equipment Environmental Engineering, 2024, 21(4): 109-115.*通信作者(Corresponding author)·110·装备环境工程 2024年4月surface and the water pressure results on each diffraction unit were directly mapped onto the structural model for computation.Spectral analysis was employed to analyze the once-in-a-century wave climate resulting in short-term extreme motion responses.By analyzing the response amplitude operator (RAO) and wave energy spectral density, the response spectrum under extreme waves was obtained to predict various statistical values for the short-term vessel motion and wave loads. Statistical method was used to determine the maximum short-term response. The extreme load values of Fr143 cross section in the middle of the ship, namely vertical bending moment, vertical shear force and profile center acceleration, were calculated. It was found that the bending moment of the ship was the largest when facing the wave, and the bending moment gradually decreased with the in-crease of the wave angle, while the vertical shear force of the cross section gradually increased with the increase of the wave an-gle. It can be concluded that the FPSO experiences more hazardous loads when facing extreme waves at large wave angles which require special attention and consideration.KEY WORDS: FPSO; potential theory; extreme wave; RAO; horizontal bending moment; acceleration海上油气开采是海洋经济的重要组成部分,其依赖于各种海洋平台完成油气钻探和生产作业。
风洞研究
– – – – Pollution Bio-terrorism Accidental hazardous gas or liquid spills Used for evauation planning
Store Separation
• Store separation deals with the safety issues of separating an internal or external store from an airplane.
Boeing 747/Shuttle
Captive Trajectory Simulation
Drop Model Test
Other Wind Tunnel Uses
Race Car Design Planetary Mobile Vehicles High Altitude Airships
– Stores could be auxillary fuel tanks – Weapons – Other flight vehicles
• How would you verify that a safe separation is possible using a wind tunnel?
– Loads on buildings – Influence of building wakes on other nearby buildings – Loads on Towers – Loads on Bridges
Non Aerospace Uses of Wind Tunnels
• Wind Engineering – the study of wind loading on buildings, structures,and environmental factors.
目录-海上施工分册
国家“十二五”重点图书出版工程《海洋工程设计手册—海上施工分册》编译工作正式启动继《海洋工程设计手册—风险评估分册》编译工作完成以后,上海交通大学出版社和上海熔圣船舶海洋工程技术有限公司启动《海洋工程设计手册》系列图书第二本《海洋工程设计手册—海上施工分册》编译工作。
《海洋工程设计手册》系列图书是由上海交通大学船舶海洋与建筑工程学院的多位教授、专家针对国内海洋工程行业发展对基础技术图书的需要而确定的出版选题。
《海上施工分册》是《海洋工程设计手册》系列图书之一,已经列入国家“十二五”重点图书出版工程。
未来五年,将会有一批国内外顶级的海工类著作纳入到这一出版工程中,为我国的海洋工程行业发展提供基础技术支撑,也必将为行业的发展产生深远的影响。
《海洋工程设计手册—海上施工分册》的主要内容来自国际海洋工程界公认的权威著作——英国Taylor&Francis出版集团的《Construction of Marine and Offshore Structures》。
该书系统、全面的阐述了离岸和深海施工的各个方面,其中包括:海洋建筑物的材料和建造、海洋和离岸施工设备、海洋作业、海洋和离岸建筑物的桩柱施工、离岸平台:钢套管架和微型桩、海洋和离岸施工建造技术的其他应用、海底管路的铺设、塑料及复合管路和电缆、海洋建筑物的维修、深海中的施工建造等经典篇章。
该书的编译出版将填补国内海洋工程行业在海上施工领域的学术著作的空白,为从事海上施工的专业人员提供权威的参考和借鉴。
《海洋工程设计手册——海上施工分册》编译出版工作由上海交通大学出版社和上海熔圣船舶海洋工程技术有限公司共同负责。
《海洋工程设计手册—海上施工分册》目录第0章引言Introduction0.1概述General0.2地理Geography0.3生态环境Ecological Environment0.4法定管辖Legal Jurisdiction0.5离岸施工建造的各方关系与次序Offshore Construction Relationships and Sequences0.6典型的海洋建筑物及其合约Typical Marine Structures and Contracts0.7设计与施工建造的相互影响Interaction of Design and Construction第1章海洋和离岸施工建造的物理环境因素Physical Environmental Aspects of Marine and Offshore Construction 1.1概述General1.2距离与深度Distances and Depths1.3静水压与浮力Hydrostatic Pressure and Buoyancy1.4温度Temperature1.5海水和海洋空气的界面化学Seawater and Sea-Air Interface Chemistry1.5.1海洋微生物Marine Organisms1.6海流Currents1.7海浪和涌浪Waves and Swells1.8风和风暴Winds and Storms1.9潮汐和风暴潮Tides and Storm Surges1.10雨、雪、雾、浪花、大气结冰和闪电Rain,Snow,Fog,Spray,Atmospheric Icing,and Lightning1.11海冰和冰山Sea Ice and Icebergs1.12地震活动、海震和海啸Seismicity,Seaquakes,and Tsunamis1.13水灾Floods1.14冲刷Scour1.15淤积和推移质Siltation and Bed Loads1.16怠工和恐怖行为Sabotage and Terrorism1.17船舶交通Ship Traffic1.18火灾和烟气Fire and Smoke1.19意外事件Accidental Events1.20全球变暖Global Warming第2章岩土因素:海底土和海积土Geotechnical Aspects:Seafloor and Marine Soils 2.1概述General2.2密实砂Dense Sands2.13泥土的液化Liquefaction of Soils2.4石灰质砂Calcareous Sands2.5海底的冰碛物和冰砾Glacial Till and Boulders on Seafloor2.6超固结淤泥Overconsolidated Silts2.7海底永久冻土和笼形包含化合物Subsea Permafrost and Clathrates2.8北极松软淤泥和粘土Weak Arctic Silts and Clays2.9冰蚀和冰举丘Ice Scour and Pingos2.10沼气Methane Gas2.11泥浆和粘土Muds and Clays2.11.1粘土的水下斜率Underwater Slopes in Clays2.11.2打桩“准备”Pile Driving“Set-Up”2.11.3短期承载强度Short-Term Bearing Strength2.11.4疏浚Dredging2.11.5取样Sampling2.11.6渗透Penetration2.11.7粘土的固结;强度的改进Consolidation of Clays;Improvement in Strength 2.12珊瑚和类似源于生物的土壤:胶结土、冠岩Coral and Similar Biogenic Soils;Cemented Soils,Cap Rock 2.13非胶结砂岩Unconsolidated Sands2.14水下沙丘(“巨型沙丘”)Underwater Sand Dunes("Megadunes")2.15基岩露头Bedrock Outcrops2.16鹅卵石Cobbles2.17深海砂砾沉积Deep Gravel Deposits2.18海底淤泥Seafloor Oozes2.19海底不稳定性和下陷;浊流Seafloor Instability and Slumping;Turbidity Currents2.20冲刷和腐蚀Scour and Erosion2.21总结Concluding Remarks第3章海上施工建造的生态和社会影响Ecological and Societal Impacts of Marine Construction 3.1概述General3.2油类和石油产品Oil and Petroleum Products3.3有毒化学品Toxic Chemicals3.4受污染的泥土Contaminated Soils3.5施工废弃物Construction Wastes3.6水体浑浊Turbidity3.7沉积物运移、冲刷和腐蚀Sediment Transport,Scour,and Erosion3.8空气污染Air Pollution3.9海洋生物:哺乳动物和鸟类、鱼类及其他生物群Marine Life:Mammals and Birds,Fish,and Other Biota3.10蓄水层Aquifers3.11噪声Noise3.12高速公路、铁路、驳船和空中交通Highway,Rail,Barge,and Air Traffic3.13现有建筑物的保护Protection of Existing Structures3.14液化作用Liquefaction3.15公众安全和第三方船舶Safety of the Public and Third-Party Vessels3.16考古问题Archaeological Concerns第4章海洋建筑物的材料和建造Materials and Fabrication for Marine Structures4.1概述General4.2用于海洋环境的钢制建筑物Steel Structures for the Marine Environment4.2.1钢材料Steel Materials4.2.2装配与焊接Fabrication and Welding4.2.3结构钢的安装Erection of Structural Steel4.2.4钢结构的涂层和防腐Coatings and Corrosion Protection of Steel Structures4.2.5高性能钢High Performance Steels4.3结构混凝土Structural Concrete4.3.1概述General4.3.2混凝土搅拌料和性能Concrete Mixes and Properties4.3.2.1高性能混凝土——“流动混凝土”High Performance Concrete—“Flowing Concrete”4.3.2.2低密度结构混凝土Structural Low-Density Concrete4.3.2.3超高性能混凝土Ultra-High Performance Concrete(UHPC)4.3.3混凝土的输送和填筑Conveyance and Placement of Concrete4.3.4养护Curing4.3.5钢的增强Steel Reinforcement4.3.6预拉伸钢筋和配件Prestressing Tendons and Accessories4.3.7埋置Embedments4.3.8海洋混凝土的涂层Coatings for Marine Concrete4.3.9施工缝Construction Joints4.3.10成型和支撑Forming and Support4.3.11公差Tolerances4.4钢筋混凝土混合结构Hybrid Steel-Concrete Structures4.4.1混合结构Hybrid Structures4.4.1复合材料施工Composite Construction4.5塑料、合成材料、复合材料Plastics and Synthetic Materials,Composites4.6钛Titanium4.7岩石、砂和柏油-沥青材料Rock,Sand,and Asphaltic-Bituminous Materials第5章海洋和离岸施工设备Marine and Offshore Construction Equipment5.1概述General5.2航道中的基本运动Basic Motions in a Seaway5.3浮力、吃水和干舷Buoyancy,Draft,and Freeboard5.4稳性Stability5.5破损控制Damage Control5.6驳船Barges5.7起重船Crane Barges5.8离岸浮吊(全回转式)Offshore Derrick Barges(Fully Revolving) 5.9半潜式驳船Semisubmersible Barges5.10自升式施工驳船Jack-Up Construction Barges5.11下水驳船Launch Barges5.12双体载驳船Catamaran Barges5.13挖泥船Dredges5.14铺管船Pipe-Laying Barges5.15供给船Supply Boats5.16起抛锚船Anchor-Handling Boats5.17拖船Towboats5.18钻探船Drilling Vessels5.19交通艇Crew Boats5.20浮式混凝土搅拌船Floating Concrete Plant5.21塔式起重机Tower Cranes5.22特种设备Specialized Equipment第6章海洋作业Marine Operations6.1拖曳Towing6.2系泊用具和锚Moorings and Anchors6.2.1系泊缆Mooring Lines6.2.2锚Anchors6.2.2.1浮锚Drag Anchors6.2.2.2桩锚Pile Anchors6.2.2.3推进锚Propellant Anchors6.2.2.4吸力锚Suction Anchors6.2.2.5驱动板锚Driven-Plate Anchors6.2.3系泊系统Mooring Systems6.3海上重载搬运Handling Heavy Loads at Sea6.3.1概述General6.4海上人员运输Personnel Transfer at Sea6.5水下干预、潜水、水下作业系统、遥控机器人和机械手Underwater Intervention,Diving,Underwater Work Systems,Remote-Operated Vehicles (ROVs),and Manipulators6.5.1潜水Diving6.5.2遥控机器人Remote-Operated Vehicles(ROVs)6.5.3机械手Manipulators6.6水下混凝土填筑和灌浆Underwater Concreting and Grouting6.6.1概述General6.6.2水下混凝土拌合料Underwater Concrete Mixes6.6.3混凝土的水下填筑Placement of Tremie Concrete6.6.4水下灌筑用的特殊外加剂Special Admixtures for Concreting Underwater6.6.5灰浆侵入聚集???Grout-Intruded Aggregate6.6.6泵送混凝土和砂浆Pumped Concrete and Mortar6.6.7基底灰浆Underbase Grout6.6.8用于将力从桩传递到套管和导管架腿柱的灰浆Grout for Transfer of Forces from Piles to Sleeves and Jacket Legs6.6.9低强度水下混凝土Low-Strength Underwater Concrete6.6.10小结Summary6.7近海测量、导航和海底测量Offshore Surveying,Navigation,and Seafloor Surveys6.8暂时性浮力增大Temporary Buoyancy Augmentation第7章海底改造和改良Seafloor Modifications and Improvements7.1概述General7.2坡度和位置的控制Controls for Grade and Position7.2.1现有条件的确定Determination of Existing Conditions7.3海底清淤、障碍物搬移和水准测量Seafloor Dredging,Obstruction Removal,and Leveling7.4坚硬物质和岩石的挖掘和搬移Dredging and Removal of Hard Material and Rock7.5水下装料的填筑Placement of Underwater Fills7.6松软土的固结和强化Consolidation and Strengthening of Weak Soils7.7预防液化Prevention of Liquefaction7.8冲刷保护Scour Protection7.9总结Concluding Remarks第8章海洋和离岸建筑物桩柱的安装施工Installation of Piles in Marine and Offshore Structure8.1概述General8.2钢管桩的制造Fabrication of Tubular Steel Piles8.3桩的运输Transportation of Piling8.4桩柱的安装施工Installing Piles8.5增强穿透深度的方法Methods of Increasing Penetration8.6插入桩Insert Piles8.7锚固于岩石或硬质地层Anchoring into Rock or Hardpan8.8高承载力桩测试Testing High Capacity Piles8.9H型钢桩Steel H Piles8.10增强桩的刚度和承载力Enhancing Stiffness and Capacity of Piles8.11预应力混凝土圆筒桩Prestressed Concrete Cylinder Piles8.12海上中转站的桩的搬运和定位Handling and Positioning of Piles for Offshore Terminals 8.13钻孔桩和灌浆桩Drilled and Grouted Piles8.14引孔沉管灌注桩、竖井Cast-in-Drilled-Hole Piles,Drilled Shafts8.15其他施工经验Other Installation Experience8.16特殊土中的施工Installation in Difficult Soils8.17改进打入桩承载力的其他方法Other Methods of Improving the Capacity of Driven Piles 8.18槽壁、正割壁和切线壁Slurry Walls,Secant Walls,and Tangent Walls8.19钢板桩Steel Sheet Piles8.20振动打桩机Vibratory Pile Hammers8.21微型桩Micropiles第9章港口、河流和港湾建筑物Harbor,River,and Estuary Structures9.1概述General9.2港口建筑物Harbor Structures9.2.1类型Types9.2.2桩支撑建筑物Pile-Supported Structures9.2.2.1钢桩Steel Piles9.2.2.2混凝土桩Concrete Piles9.2.2.3沉桩施工Installation9.2.2.4斜桩Batter(Raker)Piles9.2.2.5桩定位Pile Location9.2.2.6水力打桩Jetting9.2.2.7打桩穿过障碍物或坚硬物质Driving Through Obstructions or Very Hard Material9.2.2.8固定桩Staying of Piles9.2.2.9桩头连接物Head Connections9.2.2.10混凝土甲板Concrete Deck9.2.2.11防护装置Fender System9.2.3隔板、???Bulkheads,Quay Walls9.2.3.1说明Description9.2.3.2板桩隔板Sheet Pile Bulkheads9.2.3.3沉箱???隔板Caisson Quay Walls9.3河流建筑物River Structures9.3.1说明Description9.3.2板桩格形结构Sheet Pile Cellular Structures9.3.3“提升安装”预浇筑混凝土壳体——“在潮湿中”施工“Lift-In”Precast Concrete Shells—“In-the-Wet”Construction9.3.4浮动安装混凝土建筑物Float-In Concrete Structures9.3.4.1概述General9.3.4.2预制Prefabrication9.3.4.3下水Launching9.3.4.4施工Installation9.3.4.5水准基座Leveling Pads9.3.4.6底层填料Underfill9.4水上桥墩的基础Foundations for Overwater Bridge Piers9.4.1概述General9.4.2开口沉箱Open Caissons9.4.3气动沉箱Pneumatic Caissons9.4.4重力基座沉箱(箱形沉箱)Gravity-Base Caissons(Box Caissons)9.4.5桩支撑箱形沉箱Pile-Supported Box Caissons9.4.6大直径管桩Large-Diameter Tubular Piles9.4.6.1钢制管桩Steel Tubular Piles9.4.6.2预应力混凝土管桩Prestressed Concrete Tubular Piles9.4.7桩至基础座(桩冒)的连接Connection of Piles to Footing Block(Pile Cap)9.4.8引孔沉管灌注竖井(桩)CIDH Drilled Shafts(Piles)9.4.9围堰Cofferdams9.4.9.1钢制板桩围堰Steel Sheet Pile Cofferdams9.4.9.2围堰施工期间的液化作用Liquefaction During Cofferdam Construction9.4.9.3斜坡上的围堰Cofferdams on Slope9.4.9.4深水围堰Deep Cofferdams9.4.9.5轻便式围堰Portable Cofferdams9.4.10桥墩的保护结构Protective Structures for Bridge Piers9.4.11钟状墩Belled Piers9.5水底预制隧道(管)Submerged Prefabricated Tunnels(Tubes)9.5.1说明Description9.5.2钢-混凝土复合式隧道管片的预制Prefabrication of Steel-Concrete Composite Tunnel Segments9.5.3全混凝土管片的预制Prefabrication of All-Concrete Tube Segments9.5.4槽沟的处理Preparation of Trench9.5.5管片安装Installing the Segments9.5.6底层填料和回填材料Underfill and Backfill9.5.7入口连接Portal Connections9.5.8桩支撑隧道Pile-Supported Tunnels9.5.9水底悬浮隧道Submerged Floating Tunnels9.6风暴潮挡闸Storm Surge Barriers9.6.1说明Description9.6.2“威尼斯”风暴潮挡闸Venice Storm Surge Barrier9.6.3“东斯凯尔德”风暴潮挡闸Oosterschelde Storm Surge Barrier9.7水流控制建筑物Flow-Control Structures9.7.1说明Description9.7.2温度控制仪Temperature Control Devices第10章沿岸建筑物Coastal Structures10.1概述General10.2出海与入海Ocean Outfalls and Intakes10.3防波堤Breakwaters10.3.1概述General10.3.2抛石防波堤Rubble-Mound Breakwaters10.3.3沉箱式防波堤和沉箱式人工岛Caisson-Type Breakwaters and Caisson-Retained Islands10.3.4板桩格形防波堤Sheet Pile Cellular Breakwaters10.4海上中转站Offshore Terminals第11章离岸平台:钢导管架和芯桩???Offshore Platforms:Steel Jackets and Pin Piles11.1概述General11.2钢导管架的装配Fabrication of Steel Jackets11.3卸载、固定和运输Load-Out,Tie-Down,and Transport11.4从运输驳船上搬动钢导管架;吊起;下水Removal of Jacket from Transport Barge;Lifting;Launching 11.5导管架的倒转Upending of Jacket11.6海底安装Installation on the Seafloor11.7桩和导管的安装Pile and Conductor Installation11.8甲板安装Deck Installation11.9实例Examples11.9.1实例1——皇都Example1—Hondo11.9.2实例2——科纳克Example2—Cognac11.9.3实例3——赛尔维扎Example3—Cerveza第12章混凝土离岸平台:重力基座建筑物Concrete Offshore Platforms:Gravity-Base Structures12.1概述General12.2施工建造的各阶段Stages of Construction12.2.1阶段1——施工建造水池Stage1—Construction Basin12.2.2阶段2——基础木阀的施工建造Stage2—Construction of Base Raft12.2.3阶段3——驳出Stage3—Float-Out12.2.4阶段4——深水施工位置的系泊Stage4—Mooring at Deep-Water Construction Site12.2.5阶段5——深水位置处的施工建造Stage5—Construction at Deep-Water Site12.2.6阶段6——竖井的施工建造Stage6—Shaft Construction12.2.7阶段7——拖曳至深水配合位置Stage7—Towing to Deep-Water Mating Site12.2.8阶段8——甲板建筑物的施工建造Stage8—Construction of Deck Structure12.2.9阶段9——甲板的运输Stage9—Deck Transport12.2.10阶段10——为甲板配合而将下部结构沉入水中Stage10—Submergence of Substructure for Deck Mating12.2.11阶段11——甲板配合Stage11—Deck Mating12.2.12阶段12——连接Stage12—Hookup12.2.13阶段13——拖曳至安装施工位置Stage13—Towing to Installation Site12.2.14阶段14——现场安装施工Stage14—Installation at Site12.2.15阶段15——导管的安装施工Stage15—Installation of Conductors12.3施工建造的替代概念Alternative Concepts for Construction12.4底基层施工建造Sub-Base Construction12.5平台重新安置Platform Relocation12.6混凝土-钢混合平台Hybrid Concrete-Steel Platforms第13章永久性浮式建筑物Permanently Floating Structures13.1概述General13.2混凝土浮式建筑物的预制Fabrication of Concrete Floating Structures13.3混凝土性能对浮式建筑物的特殊重要性Concrete Properties of Special Importance to Floating Structures13.4施工建造和下水Construction and Launching13.5浮式混凝土桥梁Floating Concrete Bridges13.6浮式隧道Floating Tunnels13.7半潜平台Semi-Submersibles13.8驳船Barges13.9浮式飞机场Floating Airfields13.10永久性浮式服务建筑物Structures for Permanently Floating Service13.11小游艇船坞Marinas13.12大型船舶停泊码头Piers for Berthing Large Ships13.13浮式防波堤Floating Breakwaters13.14浮标配合Mating Afloat第14章海洋和离岸施工建造技术的其他应用Other Applications of Marine and Offshore Construction Technology 14.1概述General14.2单点系泊Single-Point Moorings14.3铰接柱Articulated Columns14.4海底基盘Seafloor Templates14.5水下储油船Underwater Oil Storage Vessels14.6拖缆布置、系泊浮标和海底部署Cable Arrays,Moored Buoys,and Seafloor Deployment14.7海洋热能变换Ocean Thermal Energy Conversion14.8低温液化天然气和液化石油气的海上进出口中转站Offshore Export and Import Terminals for Cryogenic Gas-LNG and LPG14.8.1概述General14.9海上风能基础Offshore Wind-Power Foundations14.10波浪发电建筑物Wave-Power Structures14.11潮汐发电站Tidal Power Stations14.12屏障墙Barrier Walls14.13防波堤Breakwaters第15章海底管路的铺设Installation of Submarine Pipelines15.1概述General15.2常规S形铺管船Conventional S-Lay Barge15.3底拖法Bottom-Pull Method15.4卷筒式铺管船Reel Barge15.5水面浮标Surface Float15.6受控式水下悬浮(受控式海面浮标)Controlled Underwater Flotation(Controlled Subsurface Float)15.7受控式底拖曳Controlled Above-Bottom Pull15.8平台的J形管法J-Tube Method from Platform15.9驳船J形铺管J-Lay from Barge15.10包含可折叠式浮标的S形曲线S-Curve with Collapsible Floats15.11束管Bundled Pipes15.12定向钻井(水平钻井)Directional Drilling(Horizontal Drilling)15.13冰下铺管Laying Under Ice15.14管路的保护:掩埋和覆盖岩石Protection of Pipelines:Burial and Covering with Rock 15.15管路的支撑Support of Pipelines15.16液化天然气和液化石油气的低温管路Cryogenic Pipelines for LNG and LPG第16章塑料及复合管路和电缆Plastic and Composite Pipelines and Cables16.1复合材料和塑料制海底管路Submarine Pipelines of Composite Materials and Plastics16.1.1高密度聚乙烯管路High Density Polyethylene Pipelines16.1.2纤维增强玻璃管Fiber-Reinforced Glass Pipes16.1.3复合柔性管路和立管Composite Flexible Pipelines and Risers16.2电缆铺设Cable Laying第17章干舷施工Topside Installation17.1概述General17.2模块装配Module Erection17.3连接装置Hookup17.4全甲板的巨型模块和运输Giant Modules and Transfer of Complete Deck17.5浮标上甲板建筑物Float-Over Deck Structures17.5.1输送和安装施工Delivery and Installation17.5.2Hi甲板方式???Hi-Deck Method17.5.3法国“智能”系统French"Smart"System17.5.4万都平台The Wandoo Platform17.5.5其他方式Other Methods第18章海洋建筑物的维修Repairs to Marine Structures18.1概述General18.2管理维修的原则Principles Governing Repairs18.3钢制建筑物的维修Repairs to Steel Structures18.4锈蚀钢制构件的维修Repairs to Corroded Steel Members18.5混凝土建筑物的维修Repairs to Concrete Structures18.6基础的维修Repairs to Foundations18.7火灾破损Fire Damage18.8管路维修Pipeline Repairs第19章加固现有建筑物Strengthening Existing Structures19.1概述General19.2离岸平台、中转站、构件和装配件的加固Strengthening of Offshore Platforms,Terminals,Members and Assemblies 19.3增加现有桩的轴向承载力Increasing Capacity of Existing Piles for Axial Loads19.4在土壤和建筑物的相互作用中增加桩和建筑物的横向承载力Increasing Lateral Capacity of Piles and Structures in Soil-Structure Interaction 19.5混凝土壁的穿透深度Penetrations Through Concrete Walls19.6抗震改进Seismic Retrofit第20章拆除和救捞Removal and Salvage20.1离岸平台的拆除Removal of Offshore Platforms20.2带桩建筑物的拆除(中转站、栈桥、浅水平台)Removal of Piled Structures(Terminals,Trestles,Shallow-Water Platforms) 20.3桩支撑钢制平台的拆除Removal of Pile-Supported Steel Platforms20.4混凝土重力基座离岸平台的拆除Removal of Concrete Gravity-Base Offshore Platforms20.5救助技术的新发展New Developments in Salvage Techniques20.6港口建筑物的拆除Removal of Harbor Structures20.7沿岸建筑物的拆除Removal of Coastal Structures第21章可构造性Constructibility21.1概述General21.2离岸建筑物的施工建造阶段Construction Stages for Offshore Structures21.3可构造性原理Principles of Constructibility21.4制造的设施和方法Facilities and Methods for Fabrication21.5下水Launching21.5.1下水驳船Launch Barges21.5.2运输提升Lifting for Transport21.5.3干船坞内的施工Construction in a Graving Dock or Drydock21.5.4水坞中的施工Construction in a Basin21.5.5从船台或下水驳船中下水Launching from a Ways or a Launch Barge21.5.6压砂Sand Jacking21.5.7转入Rolling-In21.5.8牵引减弱Jacking Down21.5.9通过压舱法使驳船下水Barge Launching by Ballasting21.6浮标式装配和接合Assembly and Jointing Afloat21.7材料选择及程序Material Selection and Procedures21.8施工建造程序Construction Procedures21.9通道Access21.10公差Tolerances21.11测量控制Survey Control21.12质量控制和保证Quality Control and Assurance21.13安全性Safety21.14施工建造的控制:反馈和修正Control of Construction:Feedback and Modification 21.15应变规划Contingency Planning21.16手册Manuals21.17现场施工建造参照表On-Site Instruction Sheets21.18风险和可靠性评价Risk and Reliability Evaluation第22章深海中的施工建造Construction in the Deep Sea22.1概述General22.2对深海作业的思考及其现象Considerations and Phenomena for Deep-Sea Operations 22.3深海施工建造技术Techniques for Deep-Sea Construction22.4用于深海的材料性能Properties of Materials for the Deep Sea22.5深海平台:顺应式建筑物Platforms in the Deep Sea:Compliant Structures22.5.1说明Description22.5.2拉索塔Guyed Towers22.5.3顺应式(柔性)塔Compliant(Flexible)Tower22.5.4铰接塔Articulated Towers22.6张力腿平台Tension-Leg Platforms(TLP's)22.7SPAR平台SPARS22.8船形浮式生产储卸装置Ship-Shaped FPSOs22.9深海系泊Deep-Water Moorings22.10深海海底的施工建造作业Construction Operations on the Deep Seafloor22.11深海管道铺设Deep-Water Pipe Laying22.12海底完井Seafloor Well Completions22.13深海桥墩Deep-Water Bridge Piers第23章北极海洋建筑物Arctic Marine Structures23.1概述General23.2海冰和冰山Sea Ice and Icebergs23.3大气条件Atmospheric Conditions23.4北极海底和土工技术Arctic Seafloor and Geotechnics23.5海洋学内容Oceanographic23.6生态思考Ecological Considerations23.7物流与作业Logistics and Operations23.8北极近海中的土方工程Earthwork in the Arctic Offshore23.9冰结构Ice Structures23.10北极的钢制和混凝土建筑物Steel and Concrete Structures for the Arctic23.10.1钢制塔平台Steel Tower Platforms23.10.2沉箱式人工岛Caisson-Retained Islands23.10.3浅水重力基座沉箱Shallow-Water Gravity-Base Caissons23.10.4自升式建筑物Jack-Up Structures23.10.5底部浇铸的深水建筑物Bottom-Founded Deep-Water Structures23.10.6浮式建筑物Floating Structures23.10.7油气井保护器和海底基盘Well Protectors and Seafloor Templates 23.11建筑物在北极的部署Deployment of Structures in the Arctic23.12现场安装施工Installation at Site23.13冰况测量与冰的管理Ice Condition Surveys and Ice Management23.14耐久性Durability23.15可构造性Constructibility23.16管路施工Pipeline Installation23.17北极动态Current Arctic DevelopmentsReferencesIndex。
考虑长周期涌浪影响散货船运动响应研究
第45卷第1期2021年2月武汉理工大学学报(交通科学与工程版)Journal of Wuhan University of Technology(Transportation Science & Engineering)Vol. 45 No. 1Feb. 2021考虑长周期涌浪影响散货船运动响应研究**收稿日期:2020-12-20李龙浩(1995-):男,硕士生,主要研究领域为智能航海*国家自然科学基金国际合作重点项目(51920105014)、国家自然科学基金青年项目(51809206)资助李龙浩1⑵支远哲° 严庆新「2)关宏旭(武汉理工大学航运学院d 武汉430063)(内河航运技术湖北省重点实验室"武汉430063)(中交上海航道勘察设计研究院有限公司° 上海200120)摘要:为准确的预报分析船舶在风浪和涌浪作用下运动响应,提升航道运力.文中以37 000吨级散货船为研究对象,利用挪威船级社认证的NT PRO-5000船舶仿真模拟软件,对在特定航道水深和 波浪条件下的多种工况进行了运动响应计算分析,从而得到船舶的垂向运动幅值、横摇幅值、纵摇幅值随波周期、波向角和水深的变化趋势,并对波周期和水深进行了敏感性分析,试验结果显示:涌浪环境中,迎浪和顺浪下纵摇是引起船体垂向运动的主导因素,且谱峰周期的敏感性较强,其数 值越接近船体自振周期及倍频周期,船体下沉幅值越大.关键词:涌浪;横摇摇幅角;纵摇摇幅角;下沉量;散货船;敏感性分析中图法分类号:U612doi :10. 3963/j. issn. 2095-3844. 2021. 01. 0260引 言大型散货船进出港时遭遇长周期涌浪侵袭, 会导致垂向运动的异常增大,涌浪频率与船舶航行振动频率接近而产生共振,极易发生中拱、中 垂、螺旋桨空转等危险现象E ,严重时可能导致船舶触底,损坏车舵.有关波浪造成的船舶下沉量的研究是属于流体动力学方面的范畴,通过船池物模试验获取船体运动响应数据•冯铁城等⑵借助43艘船模在规则波中进行迎浪自航试验,通过回归分析将有义纵摇幅值、有义垂荡幅值表示为主尺度及航速的多项式;黄宣军等⑶通过观测打桩船模型在规则波涌浪条件下的运动响应,发现波浪周期接近 船舶自振周期或锚泊系统自振周期时,船舶运动量明显增大.物理模型所得到的试验数据更 精准,但耗费的时间和费用较高,相对而言数值模拟所需要的成本更小曲.随着计算机水平的 发展,学者们开始借助计算机仿真软件计算船舶运动响应,Kim 等皈借助WASIM 软件对两艘船舶的运动响应进行求解,并与线性方法的计算结果进行对比;Feng 等闵通过分离入射波和散射波改进了传统完全非线性势流理论以提高 计算效率,并采用这一方法对并列驳船间的水动力共振问题进行研究;Hannan 等⑺基于完全非线性水波理论,借助数值模拟的方法研究了海上起重驳船的有效工作载荷和非线性运动特性;Jiang 等同采用数值模拟的方法研究了波浪作用下并排异形箱体的波浪载荷;杨波等⑹基 于流体力学的方法,给出船舶在波浪中运动的 数值模拟方式,求取垂荡和纵摇运动的响应幅 值算子,并验证了数值模拟方法的精确性;谢海波等[诃借助SES AM 软件计算了锚泊船在波浪 中的下沉量,给出了波高小于2. 5 m 的风浪环境中,锚泊船的下沉幅值与船舶吃水的关系;杨明等口□利用BV 船级社的HydroSTAR 软件计算了 FPSO 在双方向风浪及涌浪作用下的运动及载荷响应与浪向的变化特点,并进行了谱峰周期和航道水深的敏感性分析.以上研究中并未对波浪的详细要素诸如波周 期、船浪向角和航道水深进行系统的分析和敏感 性分析,本文借助经挪威船级社认证的NT PRO-• 138 •武汉理工大学学报(交通科学与工程版)2021年第45卷5000船舶仿真模拟软件对船舶在规则波涌浪作用下散货船横摇幅值、纵摇幅值和垂向运动幅值进行了研究.2计算工况1基本参数及计算模型1.1基本参数目标散货船主尺度见表1.表1散货船主尺度2.1海况计算中的波浪要素组成包含短周期风浪和长 周期涌浪,短周期波浪采用JONSWAP 波谱模拟 随机波环境中的海浪,长周期涌浪采用规则波叠加的方式模拟随机波环境,风浪和涌浪的参数见表3.参数数值排水量/t37 330总长/m 222. 6船宽/m22. 9船首吃水(满载)/m 7.9船尾吃水(满载)/m7.91.2水动力参数散货船横摇周期为丁2C • B 1 =--------(1)式中:C = 0. 373 + 0. 023 (B/d)—0. 043 (L w i/100),其中:Lwi 为水线长度,为船宽,m ;d 为平均吃水,m ;丽为稳心高度;m.散货船纵摇周期为T P = C P /L(2)式中:L 为船长;Cp 为纵摇周期系数,这里取0.6.散货船垂荡周期为T h = 2. 4(3)船体各固有摇荡周期见表2.表2散货船固有摇荡周期单位:s参数 横摇周期纵摇周期垂荡周期数值10.7 & 9 6.7表3波浪参数短周期波(风浪)_______________长周期波(涌浪)有义 谱峰 航道 有义 谱峰 航道波高/m 周期/s 水深/m 波高/m 周期/s 水深/m2.2 5 11. 9 225 11.92.2海况环境组合考虑到散货船水下结构对称,因此试验将涌浪方向规定为0°〜180°, 30。
基于PID算法的船舶动力定位数值模拟研究
基于PID算法的船舶动力定位数值模拟研究李欣;谢芃;骆寒冰;刘鑫;尹汉军【摘要】The ship dynamic positioning technology makes the ship especially engineering ship more flexible position and control on the sea. The ship dynamic positioning technology has developing some kinds of control methods. This article simulated a dynamic positioned ship base on the PID -control method, considers the ocean environment about wind, current and wave loads on the ship and simulated the ship dynamic positioning response. We also can evaluate the ship dynamic positioning capability and reliability, and which sea condition is suit the engineering ship work on the sea by the simulated result.%船舶动力定位技术可以使船舶,尤其是工程船舶更具有机动性,船舶可以机动灵活地进行机动控制和定位。
动力定位发展至今,已经发展了多种定位方法。
本文主要针对较为经典的PID控制算法,对船舶进行动力定位控制的时域模拟,计算风、浪、流影响下船舶的动力定位和运动情况,分析各个推进器的推力输出和角度变化,评估船舶动力定位的能力和动力定位的可靠性。
【期刊名称】《舰船科学技术》【年(卷),期】2014(000)010【总页数】5页(P13-17)【关键词】动力定位;SIMO;PID控制【作者】李欣;谢芃;骆寒冰;刘鑫;尹汉军【作者单位】海洋石油工程股份有限公司,天津300461;天津大学建筑工程学院,天津300072;天津大学建筑工程学院,天津300072;天津大学建筑工程学院,天津300072;海洋石油工程股份有限公司,天津300461【正文语种】中文【中图分类】U6610 引言随着经济发展对能源的使用需求,石油资源成为经济发展的重要因素之一。
- 1、下载文档前请自行甄别文档内容的完整性,平台不提供额外的编辑、内容补充、找答案等附加服务。
- 2、"仅部分预览"的文档,不可在线预览部分如存在完整性等问题,可反馈申请退款(可完整预览的文档不适用该条件!)。
- 3、如文档侵犯您的权益,请联系客服反馈,我们会尽快为您处理(人工客服工作时间:9:00-18:30)。
*Corresponding author.Tel.:00351-1-841-7607;fax:00351-1-847-4015.Marine Structures 12(1999)199}209Wind loads on marine structuresM.R.Haddara ,C.Guedes Soares *Memorial Uni v ersity of Newfoundland,Faculty of Engineering and Applied Science,St.John 's,N y d,Canada A1B 3X5Unit of Marine Technology and Engineering,Technical Uni v ersity of Lisbon,Instituto Superior Te &cnico,A v .Ro v isco Pais,1049-001Lisboa,Codex,PortugalReceived 29January 1999;received in revised form 15March 1999;accepted 9April 1999AbstractA review of the available methods for the calculation of wind loads on ships and o !shore structures is presented.Based on the review,four methods were selected and implemented in order to carry out a comparative study of the wind loads on ly,the ahead force,the side force and the yawing moment were calculated and compared.A large tanker both in the loaded and ballast conditions was analysed using the four methods.In the second part,an expression for the estimation of wind loads on ships is proposed and compared with the experimental data.A neural network technique was used to obtain this expression. 1999Elsevier Science Ltd.All rights reserved.Keywords:Wind loads;Loads on ships1.GeneralThe wind loads do not usually play a major role in the structural design of ships and o !shore structures.The magnitude of the mean static forces and the moments caused by the wind amount to only a fraction of the total loading on the structure.However,there are instances when the e !ects of these forces and moments become critical.Cracks occurring in #are booms due to dynamic wind loading have been reported in the literature [1].Wind loads play important roles in the e $cient operation of a ship 's propulsion plant or on her manoeuvrability.Also in certain particular situations such as the towing of ships,moored ships and dynamic positioning,wind loads play an important role.200M.R.Haddara,C.Guedes Soares/Marine Structures12(1999)199}209Wind tunnel tests are the most accurate procedure to estimate the wind forces on ships and o!shore structures.However,these tests are time consuming and very expensive,thus the prediction methods are generally used complementary or alterna-tively to wind tunnel tests.Several numerical methods have been developed for the prediction of wind forces on#oating structures without recurring to direct model testing.Isherwood[2]proposed expressions for the forces and moment coe$cients,derived from multiple regression analysis of previously published experimental results.The wind coe$cients are given by equations,depending on the basic characteristics of the water above the hull.This method can be applied to a wide range of ship types and con"gurations and for all angles of the wind relative to the bow.Gould[3]presented a numerical procedure for the estimation of the wind forces and moment on the superstructures of ships.The e!ect of wind speed over the sea on the e!ective relative wind speed acting on the ship is discussed.In fact,the wind pro"le over the sea depends on the sea surface,which moves itself and presents increasing roughness with increasing wind speed.A logarithmic pro"le for wind speed is proposed by the author.The e!ective wind speed and the lateral centre of pressure for a gradient wind,is then estimated by subdividing the frontal and lateral projections into`universal elements a.The wind tunnel data for ships covering a wide range of designs are given with advice on their application to other ships.This data can be used to estimate the forces and moment coe$cients for a wide range of ship types.Blendermann[4]has presented a systematic collection of wind load data.Continu-ing this work,Blendermann[5,6]derived expressions for the coe$cients of the wind forces acting in the longitudinal and transverse directions and the yaw and rolling moments.These expressions are functions of a drag coe$cient,the angle of attack,the frontal and transverse areas subject to wind,the coordinates of the centre of area and a parameter called the cross-force parameter.This parameter is obtained statistically from the experimental data.Blendermann[7]also proposed a method for the prediction of wind loads on ships in a non-uniform air#ow using experimental data.The non-uniformity of the air#ow is accounted for an e!ective dynamic pressure.Brix[8,9]has presented a selection of the wind load data from Blendermann[4,5], together with methods for their use in manoeuvring problems.Lee and Low[10]obtained results of wind tunnel tests on models of rigid o!shore platforms.The pressure transducers located at141locations on the1:268scale model were used to measure wind loads.The wind velocity was measured using hot wire anemometer.The wind tunnel results show an overriding in#uence of the legs.They accounted for about70%of all drag and about80%of all over turning moments in the#oating mode.OCIMF[11]presented coe$cients and procedures for computing wind loads on very large crude carriers(VLCCs),i.e.tankers in the150,000}500,000DWT range. However,the coe$cients and procedures can be applied to smaller tankers with similar geometry.The wind coe$cients are based upon data obtained from windM.R.Haddara,C.Guedes Soares/Marine Structures12(1999)199}209201 A very long mat-like platform was used to study the wind forces on a#oating airport by Ohmatsu et al.[12].Experiments were conducted in a closed-return wind tunnel.A distorted model was used where only the fore and aft parts were accurately scaled.Wind pressure distribution,wind forces and wind velocity distribution around the model were measured.It has been found that the total drag force coe$cient increases with the increase in the model length and decreases with the increase in draft. Chen et al.[13]carried out preliminary experiments to study the wind environment over the helideck of an o!shore platform in the Beihai sea,China.Tests were carried out in an atmospheric boundary layer wind tunnel using a1:100scale model.A hot-wire anemometer was used to measure the velocity over the helideck.The velocity was measured at equally spaced stations,ten in the horizontal direction and eight in the vertical direction.The results for"ve di!erent angles of attack were obtained.These experiments indicate that the distributions of the mean as well as the#uctuating velocities are quite sensitive to the direction of the wind.They also found that the separation occurs generally at the front edge of the helideck.In some cases,the mean velocity distribution at the centre of the deck has a turning point,which may suggest an instability.The vibration characteristics of several Norwegian o!shore#are booms have been discussed by Oppen and Kvitrud[13].A survey of the cracks produced by this resonant vibration was also given.The cross wind vortex-induced vibration and wake interaction with the chord members were the main causes for cracks.The methods for mitigating these e!ects were described and a recommended design practice was suggested.parative study on wind loadsThree methods available in the literature were used to estimate the wind loads on a351.0meter tanker,in the loaded and ballast conditions.Table1shows the principal dimensions of the tanker.The methods applied are those described in[2,3,11].The results of the calculations are shown in Figs.2}4for the loaded tanker and in Figs.5}7 for the tanker in ballast.The experimental data obtained by Blendermann[4]is plotted together for comparative purposes.Table1Main particulars of the tankerLoaded In ballastOverall length(m)351.40Beam(m)55.40Draft(m)23.5010.625Lateral projected area(m )3401.477839.63Height of centre of lateral area above 6.8312.34Distance of centre of lateral from midship24.45(forward)8.32(forward) Transverse area(m )1131.791803.93Fig.1.Convention for positivequantities.Fig.2.Longitudinal force coe $cient,loaded tanker.The convention for positive forces and moment are presented in Fig.1,where F V ,F W and N represent,respectively,the longitudinal force,side force and yaw moment and is the angle between the wind speed and the ship bow.Fig.2represents the longitudinal force coe $cient for the loaded tanker.Although one can observe some dispersion on the numerical results,in general the predictions compare well with the experimental results.For wind coming from the stern,all methods tend to overpredict the experimental results.Among the three methods,the OCIMF is the one which compares better with experiments.Fig.3,shows the results of the side force coe $cients for the loaded ship.One can observe that both Isherwood 's and the OCIMF methods agree with the experimental values obtained for the side force by Blendermann over the whole range of the wind angle.Values for the lateral force coe $cient obtained by Gould 's method are highly overestimated.In Fig.4the yaw moment coe $cients results are presented.One can "nd qualitative di !erences between Blendermann 's experimental results and OCIMF values for the yaw moment coe $cient on one side and estimates obtained by Gould 's and Isher-wood 's methods on the other side.The yaw moment coe $cients obtained using the 202M.R.Haddara,C.Guedes Soares /Marine Structures 12(1999)199}209Fig.3.Side force coe $cient,loadedtanker.Fig.4.Yaw moment coe $cient,loaded tanker.values obtained using Gould 's and Isherwood 's methods display a change in sign of the coe $cient around a wind angle of rge quantitative discrepancies exist between the results obtained using the three methods and Blendermann 's experi-mental results.Figs.5}7represent comparisons between the numerical predictions and experi-mental results,respectively of the longitudinal force,side force and yaw moment coe $cients for the tanker in the ballast condition.The conclusions for the longitudi-nal force coe $cients are similar to those obtained for the loaded condition.Again the OCIMF method tends to agree better with the experiments than the other methods.In the case of the side force coe $cients all methods overestimate the experimental data,the Isherwood results being closer to the experiments than the Gould and OCIMF results.The numerical results for the yaw moment coe $cients agree qualitat-ively with those obtained from Blendermann 's experimental values.For wind angles below 803,OCIMF is the closest to Blendermann 's experimental values.For angles M.R.Haddara,C.Guedes Soares /Marine Structures 12(1999)199}209203Fig.5.Longitudinal force coe $cient,tanker inballast.Fig.6.Side force coe $cient,tanker inballast.204M.R.Haddara,C.Guedes Soares /Marine Structures 12(1999)199}209In conclusion,it seems that this comparative study indicates that there is no general agreement between the four methods available for the estimation of wind forces on ships.The discrepancy between the estimates obtained using the other three methods and Blendermann 's experimental results may be caused by the limited range of experiments carried out in these studies and the statistical analysis carried on the data to obtain formulas for the estimation of the forces.3.An universal model for the estimation of wind loads on shipsThe trend of using neural network techniques in the parametric identi "cation of mathematical models using measured input and output of the system is growing.One of the main advantages of this method is that no functional relationship between the dependent and the independent variables has to be assumed a priori.This technique was used to obtain a universal expression for the wind loads.Blendermann 's [4]experimental data were used for training a feed-forward neural network.Optimisation of the network was obtained using the back-propagation method.The data for a tanker,which were not used in the training of the network,was used to test the ability of the network to predict wind loads for a new ship.This approach yields a mathematical expression which can be used to estimate loads on any ship.This means that this is a universal mathematical expression which does not depend on the type of ship.The following expressions are used to calculate the coe $cients of the wind forces:C I "K GIG H IG ,k "1,2,3,(1)where k "1,2,3refer to the longitudinal force,transverse force and yaw moment,respectively,andH IG "[1!e \%IG ][1#e \%IG ],G IG " H Jw IGH x H ,k "1,2,3(2)andx "A *¸ ,x "A P B ,x "¸B,x "S ¸,x " ,x "1,(3)where A *is the lateral projected area,A 2is the transverse projected area,s is the distance between the centre of the lateral projected area and the midship section of M.R.Haddara,C.Guedes Soares /Marine Structures 12(1999)199}209205Table 2Ships used in the training of the neural networkShipLoad (m)B (m)D (m)Container ship (full)210.7530.5011.6Container ship (empty)210.7530.509.6Container ship (loaded)210.7530.509.6Container ship (empty)216.4023.77 6.94Drill ship150.121.357.00Cruise ship143.9017.35 5.90Cruise ship161.0029.00 6.05Cutter25.05 5.80 2.50Cargo ship (loaded)141.118.507.32Cargo ship (empty)141.118.50 4.43Cargo ship (loaded)155.4523.108.69Cargo ship (container on deck)155.4523.108.69Research vessel:Wind from Port55.0012.50 3.95Research vessel:Wind from Starboard55.0012.50 3.95Speed boat53.609.20 2.50O !shore supply vessel61.9513.00 4.85O !shore supply vessel61.0013.00 4.85Gas tanker (loaded)274.0047.2010.95Gas tanker (ballast)274.0047.208.04the ship 's length and B is the ship 's beam.The values for the weights, IG and w IGH ,are calculated by the neural network.A neural network having one hidden layer was used.The input layer has six inputs as shown in Eq.(3).The hidden layer has 11nodes.The experimental data for 19ships were used to train the network.Table 2shows a list of the ships used in the training of the network.The weights,which were calculated by the neural network,are used to predict the wind forces acting on the same tanker that has been used in the compara-tive study in the previous section.This ship was not included in the data used to train the network.It should be noted that the training data did not include any tankers.Furthermore,all the ships used in the training of the network were smaller than the tanker used to test the generalisation ability of the network.Figs.8}13show a comparison between the experimental and the predicted wind forces coe $cients for the tanker.The predicted data agreed qualitatively with the experimental data in all cases.The errors in estimating the maximum forces on the tanker using the neural network are much smaller than those produced by the other methods.These results show that this method produces much better predictions than that given by the methods currently available in the literature.4.ConclusionsA review of the available methods for the calculation of wind loads on ships and o !shore structures is presented.A comparative study was carried out,where the206M.R.Haddara,C.Guedes Soares /Marine Structures 12(1999)199}209Fig.8.Predicted and measured longitudinal force coe $cient (loadedtanker).Fig.9.Predicted and measured side force coe $cient (loadedtanker).M.R.Haddara,C.Guedes Soares /Marine Structures 12(1999)199}209207Fig.11.Predicted and measured longitudinal force coe$cient(tanker inballast).Fig.12.Predicted and measured side force coe$cient(tanker inballast).208M.R.Haddara,C.Guedes Soares/Marine Structures12(1999)199}209M.R.Haddara,C.Guedes Soares/Marine Structures12(1999)199}209209 ahead force,side force and yawing moment were calculated for a tanker in loaded and ballast conditions using four methods.The quality of the predictions is assessed by comparing the numerical results with experimentally obtained results.Generally speaking the comparative study indicates that there is no general agree-ment between the methods used for the estimation of wind forces on ships.The experimental results obtained by Blendermann are the most comprehensive and reliable among the four methods.The discrepancy between the estimates obtained using the other three methods and Blendermann's experimental results may be caused by the limited range of experiments carried out in these studies and the statistical analysis carried on the data to obtain formulas for the estimation of the forces.In the second part of the paper,a neural network technique was used to obtain a universal expression for the estimation of wind loads on ships.The tanker,which was used for the comparative study,was chosen to test the ability of the network to predict wind loads on ships.It should be noted that this tanker was not used in the training of the network.It was found that the numerical predictions agree well with the experimental results,suggesting that the neural network technique can be used to generate expressions,which produce better results than those given by the methods currently available in the literature.References[1]Oppen,AN,Kvitrud A.Wind induced resonant cross#ow vibrations on Norwegian o!shore#arebooms.Proceedings of the14th International Conference on O!shore Mechanics and Arctic Engin-eering(OMAE),v1-A,New York:ASME,1995,p.341}54.[2]Isherwood RM.Wind resistance of merchant ships.Trans.Roy.Inst.Naval Architects1972;114:327}38.[3]Gould RWF.The estimation of wind loads on ship superstructures.The Royal Institution of NavalArchitects,monograph,No.8,1982.p.34.[4]Blendermann W.Schi!sform und Windlast-Korrelations-und Regressionanalyse von Windkanalmes-sungen am Modell.Report No.533.Institut fur Schi!bau der Universitat Hamburg,1993a.99pages plus Appendix.[5]Blendermann W.Wind loads on moored and manoeuvring vessels.Proceedings12th InternationalConference on O!shore Mechanics and Arctic Engineering(OMAE),New York:ASME,1993,v1,p.183.[6]Blendermann W.Parameter identi"cation of wind loads on ships.J.Wind Engng.Ind.Aerodyn.1994;51:339}51.[7]Blendermann W.Estimation of wind loads on ships in wind with a strong gradient.Proceedings of the14th International Conference on O!shore Mechanics and Arctic Engineering(OMAE),New York: ASME,1995,v1-A,p.271}7.[8]Brix J.editor.Manoeuvring Technical Manual.Appendix I:Wind forces and moments in dimension-less form,Part1,Schi!&Hafen42,1990.No2,p.41,No3,p.55,No4,p.47.[9]Brix J.editor.Manoeuvring technical manual.Hamburg:Seehafen,1993.p.147and236.[10]Lee TS,Low HT.Wind e!ects on o!shore platforms:a wind tunnel model study.Proceedings of theThird International O!shore and Polar Engineering Conference,Singapore,1993.p.466}470.[11]OCIMF.Prediction of wind loads and current loads on VLCCs.1994.[12]Ohmatsu S,Takai R,Sato H.On the wind and current forces acting on a ultra large#oating platform.Proceedings of the14th International Conference on O!shore Mechanics and Arctic Engineering (OMAE),New York:ASME,1995,v1-A,p.475}81.[13]Chen Q,Gu Z,Sun T,Song S.Wind environment over the Helideck of an o!shore platform.J WindEngng Ind Aerodyn.1995;54/55:621}31.。