高考英语图表作文讲解解析
高考英语图表类作文写作技巧讲解

高考英语图表类作文写作技巧讲解一、考点分析图表作文以说明文和议论文为主。
考查时要求学生根据所给的图表、数据等进行分析,阅读文字和说明,然后组织语言进行写作,得出令人信服的结论,必要时还要加入个人观点。
二、专题详解1)文体一:说明文文体特点:(重事实)说明文是以说明为主要表达方式,用简洁明了的语言来解释说明事物,阐明事理。
它要求语言要简明扼要,客观准确。
框架:第一段:概括说明内容常用的词有:1.table, a pie chart饼图, a bar chart柱状图, graph, survey, picture2.describe, show, represent, illustrate, reveal,3. figure, statistic, number, percentage, proportion常用的开篇句型(即概述图表内容时常用的表达法):1.The graph/chart/table above shows / describes / illustrates that...2. From the above graph/chart, it can be seen that…3. As shown in the graph / survey, …4.The chart/table shows the differences between…5. I launched an inquiry into… / I conducted a survey on… / to…第二段:描述变化情况并分析引起变化的因素A. 写作关键:1.对比分析,寻找数据的变化规律;2.筛选数据这些数据是否具有典型代表性、是否需要一一列出?一般而言首尾数字以及增减值是必需的;3.强调数据间的关系,突出变化。
B. 常用词汇和套语:a.描写数据变化常用套语:增加:1.There was a great / stable / slight increase /rise in…倍数:2.The number /rate has nearly doubled, compared with that of last year.3.The number is …times as much as that of….保持不变:4.In 1985, the number remained the same.减少:5. There was a gradual/sharp decline in 1989.分别列举:6. The numbers / percentages are… and…respectively.b.说明因果关系表示原因:as / since / due to / owning to / thanks to / because (of)进一步解释:that is to say / to put it another way表示结果:therefore / thus / as a result ( consequence), so that提示例证:(take…)for example / instance, …such as (一般不用于句首),常用套语:提出第一个原因:The first reason can be seen by every person.The first and most impo rtant reason / One of the premier causes is that…解释某一种现象:…is the cause of ……mainly / partially contribute(s) to the tendency of……account(s) for the fact / phenomenon…总括性解释原因:There exist… reasons, which may account for this difference.The reasons for the phenomenon may be as follows:There are several causes for this significant growth in….例证:This point can be confirmed by the fact / example of + nn + is a case in point.第三段:总结归纳/提议/提出解决办法结尾常用套语1.In my opinion / Perso nally / As far as I’m concerned2.In short/ In brief/ In a word/ In conclusion /In summary/ To sum up,3. From what has been discussed above, we can draw the conclusion that…4. Obviously, if we want to…, it is necessary…/ There is no doubt that atten tion must be paid…2)文体二:议论文文体特点:(重说理)议论文是以议论为主要表达方式的一种文体。
高中英语:图表类书面表达专项讲解

高中英语:图表类书面表达专项讲解【基础回顾】考点归纳:图表式作文在高考这出现的机会较小。
尽管如此,我们还是应对此类作文予以重视,因为图表式作文是通过提供的一组或几组数据来反映某个趋势或某一问题、现象。
要求考生图表中的相关数据进行描述、分析和评论,并得出合乎逻辑的结论。
它是将数据、形象信息转换为文字信息的过程,此类作文最能考查考生逻辑推理的能力。
图表作文命题常用的形式:①数据表格:矩形的竖行和横行进行排列的表格,它反映的是多种事物的相互关系;②饼状图:它用来表示各事物在总体中所占的比例及相互关系;③柱状图:它用来表示几种事物的变化情况及相互关系;④曲线图:它常用来表示事物的变化趋势;⑤混合式:既有柱形图又有饼状图或表格或曲线图等。
基础必读:图表式作文的写作必读第一步审题图表类作文的审题与其他类型的作文相比难度较大,主要表现在考生不易准确、全面地把握图表显示的信息。
因此要通过审题抓住主要数据反映的主要问题即所要表达的要点;通过审题确立表达时所要用的时态:特定时间用过去时;经常出现的情况或自己的评述用一般现在时。
第二步谋篇做图表类书面表达时,常采用三段式的谋篇方法:Para1概述图表所反映的信息;Para2分析现象产生的原因或根据题中所提供的原因进行叙述;Para3展望未来或提出问题的方法、建议或希望。
第三步表达1.概述图表所反映的信息时要注意就图表中那些最有代表性、规律性的数字,或变化大的数字进行重点阐述。
尽量避免简单罗列数据,报流水账;2.善于抓住总的规律、趋势对现象产生到的原因利用合理想象来进行分析或据题中所提供的原因进行叙述。
如利用数据进行有力的论证;3.展望未来或提出解决问题的方法、建议或希望时要紧紧围绕主题去展开。
切忌游离主题而任意发挥;4.适当运用高级词汇并灵活运用图表类写作常用的经典句型。
图表式作文的描述方法第一种情况:横向对比。
描述这种图表需要对比各种数据间的差别,主要以数值、倍数、排列等方式来描述。
高中英语 高考图表作文专项讲解及练习(有答案)

图表作文本节内容一)图表作文写作要求图表作文就是把非文字信息(通常为各种图表表示的数字信息等)转换成文字信息的一种作文。
它要求我们用文字来描述非文字性的图表或对图表显示的关系作解释说明。
图表作文一般在题目中给出作文的标题和一个或几个统计表格、圆图形、曲线图或条形图,有时还用英文或中文提纲的形式给出提示,具体要求:1. 用文字描述图表,客观解释图表中所传递的信息,并找出某种规律或趋势;2. 就图表中所反映的某种趋势或问题分析其原因或后果。
图表作文着重说明事实,常常通过对图表中所反映的具体数据的说明、分析、比较,对某种事物或现象的事实或变化情况等加以说明,并提出结论或看法。
因此,图表作文常常采用议论文的写作方法。
二)写作步骤1.仔细阅读图表,了解图表所达的内容。
首先,用一句话概括图标的内容。
2.描写图表所反映的问题或规律3.结尾部分得出结论,表述自己的观点,结束全文。
(1)如果图表反映的是好的现象,首先要肯定、发表观点最后预测未来;(2)如果图表反映的是不好的现象,首先要否定、提出解决办法或建议三)写作实用表达(一)点明主题引用具体或粗略的数据,然后作出概括性分析,点名主题或引出需要论述的问题。
常用的词有:1.泛指一份数据图表:a data graph/chart/diagram/illustration/table饼图:pie chart 表格图:table 柱形图:bar chart趋势曲线图:line chart / curve diagram2.describe, show, represent, illustrate, reveal等等。
3. figure, statistic, number, percentage, proportion常用的开篇句型(即概述图表内容时常用的表达法)1.The graph/chart/table above shows / describes / illustrates that.....2. From the above graph/chart, it can be seen that…3. As is shown in the graph…4.The chart/table shows the differences between…5. According to the table/pie chart/ graph/bar graph, we can see/conclude that …(二)分析差异描写变化及总趋势特征、分析差异:数据说明常用套语:1.There was a great /slight increase /rise in…2.The number /rate has nearly doubled, compared with that of last year.3.The number is …times as much as that of….原因说明常用套语:1.The reason for…is that…2.The change results from the fact that…3.There are several causes for this significant growth in…. To begin with .... In addition/ Furthermore/ Moreover,...4. There are many factors that may account for...but the following are...(三)得出结论结尾常用套语1. Personally/ as far as I’m concerned/ in short/ in brief/ in conclusion /in summary2. It’s clear/evident from the chart that… / We can draw the conclusion that…3. From what has been discussed above/Taking into account all these factors, we can draw the conclusion that…4. There is no doubt that special attention must be paid to the problem of...5. It is high time that we put an end to the tendency of...图表作文常用单词、词组和句型总结:1)表示数据变化的单词或词组rapid/ rapidly 迅速的,飞快的,dramatic/ dramatically 急剧的sharp /sharply 明显的,急剧的significant/ significantly 重大的sradual/ gradually 渐进的,逐渐的steady / steadily 稳固的stable / stably 稳定的slow /slowly 缓慢的slight / slightly 略微的2)在描述中常用到的词汇significant changes 图中一些较大变化noticeable trend 明显趋势distribute 分配in terms of/ regarding/ with regard to/ as far as sth is concerned 关于,就...而言3) 描述增减变化常用的句型Compared with … is still increased by …The number of … grew/rose from … to …An increase is shown in …; then came a sharp increase of …In … the number remains the same/drops to …There was a very slight (small/slow/gradual) rise/increase in ......There was a very steady (marked/sharp/rapid/sudden/dramatic) drop (decrease/decline/fall/reduction) in ....../ compared with that of last year).4) 图表作文常用句型精选1. The table shows the changes in the number of.....over the period from....to......该表格描述了在...年至...年间...数量的变化。
高考英语作文题型分析讲解

作文题型分析讲解一.专题知识梳理——图表作文、图片作文知识点1:图表作文一. 图表作文考查形式:1. 是以表格形式,将统计的数据或被说明的事物直接用表格形式体现出来,即统计表。
2. 是以图形形式◆表示数据变化的曲线图;◆表示数据的大小或数量之间的差异的条形图;◆表示总体内部结构变化的扇形图。
二. 图表作文常用的写作模板参考模板一:As is shown/indicated/illustrated by the figure/percentage in the table(graph/picture/pie/chart), ______ (作文题目的议题) has been on rise/ decrease (goes up /increases / drops / decreases),significantly /dramatically /steadily rising /decreasing from ______ in ______ to______ in ______. From the sharp/marked decline/ rise in the chart, it goes without saying that______.There are at least two good reasons accounting for ______. On the one hand, ______. On the other hand, ______ is due to the fact that ______. In addition, ______ is …参考模板二:According to the graph, ______ (图表结果). The ______ amount rises from _____ to______ while ______ climbs from ______ to ______(数据), both of which demand our prompt attention. As a citizen/student, my suggestions to ______ (点出主题)are listed as follows.To begin with, ______ (建议一). ______(观点). In addition, ______ (建议二). ______(观点). Thirdly, ______ (建议三). ______(观点).In a word, only if we pay much attention to our everyday behavior and take actions to _________(重申主题), can we make contributions to __________.(美好生活的向往)三. 图表写作常用句型及短语1.The data from the pie chart shows that _______ ranks first at 58%, which is followed by_____ at 33%. However, the least proportion goes to _________ at only 9%.(图表数据类文章第一段可能遇到的经典句型)2. The graph/chart/table above shows…3. From the above graph/chart, it can be seen that...4. As (正如) is shown in the graph, ...5. It has been shown from the table that…Facts1. There was a great /slight increase /rise in…2. There has been a sudden/slow/rapid fall/drop in…3. The rate dropped slightly from 38%in…to 31% in…4. By comparison with, it decreased/increased/fell from…to…5. Statistics show a 20% rise/reduction in traffic accidents compared with last year.6. The population owning mobile phones increased by 10% in 1999.Reasons:1. The reason why/for…is that…2. One may think of the change as a result of…3. The change in … largely results from the fact that…4. This brings out the important fact that…5. ... is the key factor (因素) in…6. There are several causes for this significant growth in….First,….Second,…总结归纳:1. in a word ,/ in short,(简而言之)/ generally speaking(总的来说)2. In summary, it is important…3. From what has been discussed above, we can draw the conclusion (得出结论)that…4. Obviously/Apparently 很明显地), if we want to…, it is necessary…提出建议:1. There is no doubt that (毫无疑问) attention must be paid to…2. I suggest (建议)the government take effective measures to …3. Personally, I think(就我来看) the “golden week” should remain, for…逻辑过渡词:常用转折,对比及比较的词汇:While, but, on the contrary, however, compare with, in contrast to ,as…as, the same as, be similar to, more than, less than常用描写趋势变化的词汇:表示上升的动词increase, rise, go up,表示下降的动词reduce, drop, go down, fall,表示平稳及其他remain, slowly, slightly, gradually, sharply, rapidly, the number of…, from…to 及比较级,倍数句型等。
高考英语写作题型全面突破专题30 图表作文详细指南-讲义
图表作文详细指南图表作文一般是对某个具体问题的调查或统计,通常以表格或图形来呈现,常常反映出一个普遍的问题。
体裁多为说明文、议论文。
考生需根据图片提供的数据和文字进行分析,并过渡到普遍现象。
常见的命题形式有表格、柱状图、饼状图、曲线图等。
写作时需要介绍图表中数据有什么变动,反映了哪些问题和趋势,并分析问题或数据背后的原因, 结合自己的看法谈谈解决措施或给出观点。
近三年考情风向标年份卷别话题命题形式20232022全国乙卷如何在课堂外学英语图表半开放式2021看图可知,图表类作文考试频率不算高,但是我们还是要了解基本写作方法,有备无患。
写作技巧点拨I.审题1.审读图表,比较数据,得出变化规律,提炼要点2.分析要点,确立主题;3.灵活运用横向对比,即描述数据的变化;纵向说明,反映出问题。
II.三步成文第一步:开门见山,点明图表所反映的现象第二步:分析图表所示内容的原因或进行评论第三步:归纳总结或发表评论,提供建议等语料赋能1.图表类型graph 曲线图figure 几何图形pie chart 饼状图bar chart 柱状图diagram 平面图、示意图table 表格2.数据表达50% of...../fifty percent of .... ...的百分之五十Half of the ... 一半A quater of 四分之一3 quaters of 四分之三Nine out of ten / nine in ten 十个中有九个The majority of ... 大多数the minority of 少数Account for 70 percent 占百分之703.常用句型开头:1.As can be indicated in the table... 正如表格所表明2.As is revealed in the table... 如图所示3.According to the figures given in the table... 根据表中的数据4.This chart shows that... 图表表明5.As is clearly shown by the graph... 正如图像所示6.It can be seen/concluded from the statistics that... 从数据可知7. from the chart , we can see that...主体:(数据描述)1.A is by far the largest... A是目前最大的.....2.The figure has nearly doubled/tripled, as against that of last year. 与去年相比,数据几乎翻了两倍/三倍3.There is a slight/slow/steady/rapid rise in population. 在人口方面有轻微的/缓慢的/稳定的/迅速的增长.4.As is shown/demonstrated in the graph , great changes have taken place in... 如图所示,....发生了巨大变化5.Sth.be on the increase//rise/decline/ decrease ....正在增长/减少6.It has decreased /increased by 30% compared with last year. 与去年相比,已经增长了30%。
高考英语数据图表分析类小作文课件

HOMEWORK
1、背诵例句 2、润色文章
第二段可背例句
1、 These figures may reflect … 这些数据可能反映出了… 2、on one hand, on the other hand 一方面,另一方面… 3、The figures of the chart suggest that 图表中的数据表明…
注意要点
3、到了最后一段,考生可以发表个人看法。 既然图表的数据反映了吃货的注意要点
2、来到中间段,考生需要分析这些数据。 它们反映了消费者就餐时的顾虑和喜好。消 费者最关注的因素是特色,那么考生就需要 解释为什么如此。考生不应该泛泛而谈,而 应指出具体的原因,比如人们在很多方面都 追求特色(个性),就餐时也是如此。至于服 务和环境,试想,谁不希望得到良好的服务 以及在友善的环境下消费呢?公务宴席就餐 者喜欢安静的环境,追求时尚的年轻食客喜 欢高大上的环境等。
分析图表,数据呈现
The chart shows the result of a citywide survey on
factors that influence its residents' restaurant
selection.
第一段要说明这个图表是干嘛的
The data shows that specialty, chosen by more than 1/3 of respondents, is what residents care most about now. Expectation on great service is also high (26.8%), as well as better environment(24.2%). In contrast, It seems that price, with the proportion dropping to a mere 8%, is no longer customers primary concern.
高中英语新高考-英语作文:图表题指导与解读(热点话题:消费)
高中英语新高考-英语作文:图表题指导与解读(热点话题:消费)考查图表的描述一般还是要慎重地,因为图表描述属于相当高层次地写作了,多出现在雅思托福写作中。
一方面要考查读图能力,另外一方面要把图转换成文,比较耽误时间的。
所以江苏在用图表加文字的形式,这样通过文字的描述也很大程度上辅助考生转换图表。
但下面作文就是一张图,然后让概括。
而概括和描述还有区别。
我以为单纯考数据图表不是和高考命题思想一致的。
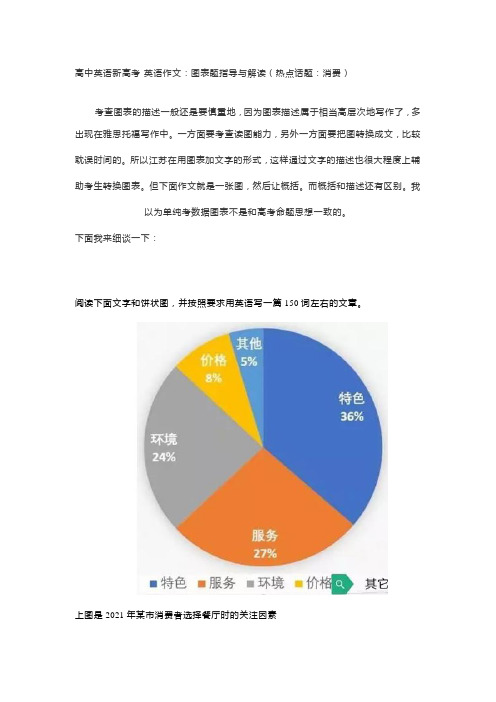
下面我来细谈一下:阅读下面文字和饼状图,并按照要求用英语写一篇150词左右的文章。
上图是2021年某市消费者选择餐厅时的关注因素1.用约30个词概括上图内容;2.请简要分析以上因素影响消费者选择的原因;3.谈谈你就餐的关注因素,并用2-3个理由或论据支撑你的看法。
注意:作文中不能出现真实姓名和学校名称。
第一部分30个词的概括图表描述,关键是找准比例的主体,请思考:36%的主体:消费者还是特色?选择前者:36%的消费者选择特色选择后者:特色在所有的因素中占36%结合提示信息:2017年某市消费者选择餐厅时的关注因素,应该取后者。
如果有学生取前者,也没问题。
其次要会基本的数据表达,再复杂的数据,也要简化成:在……中,A占多少比例。
这就是:Among …, A makes up / accounts for …%.注意:Among后一定是一个名词,这个名词后会可能带上一个后置定语或定语从句。
分析:核心词为“因素”,后面带上后置定语:消费者选择餐厅时的。
这样就可以写成:As is illustrated in the chart, among factors influencing diners’ choice of a restaurant, distinctive features rank first, accounting for 36%. Next come service and the dining environment, 27% and 24% respectively. Others like price make up the least proportion.这样描述是详细描述图表,但是根据要求“概括”,所以还要去掉细节:As is illustrated in the chart, among factors influencing diners’ choice of a restaurant, distinctive features rank first. Next come service and the dining environment. Others like price make up the least proportion.积累词汇:占据:make up, account for分别是:… and … respectively占据首位:rank first, take a lion’s share, be in the lead; top the list其次是:Next comes…对比范文:A survey was conducted in a city in 2017 about factors contributing to diners’ preference of a restaurant. Flavor features, service and the dining environment made up the biggest proportion.个人之见:这个描述完全忽略了最小值,但是熟悉雅思图表描述的都知道,图表描述一般抓两头,即最大和最小,这样才能形成对比,从而挖掘规律。
高考英语图表作文详解+万能必背模板

(万能模板+模板句型+详细指导+举例范文+满分范文)
目录
一.万能模板 .............................................................................................................................................. 2 二.模板表述方法 .............................................................................................................................能模板
As is shown/ indicated/illustrated by the figure/percentage in the table (graph/picture/pie/chart), __作文题目的议题__has been on rise/ decrease (goes up/increases/drops/decreases), significantly/ dramatically /steadily rising/decreasing from__ in __ to __ in __. From the sharp/marked decline/ rise in the chart, it goes without saying that (毫无疑 问的看出) _________________________. There are at least two good reasons accounting for (这里至少有两个原因可以对 X X 作出解释) ______________________. On the one hand(一方面), ______. On the other hand(另一方面), ______ is due to the fact that ________(原因是). In addition(而且), _______ is responsible for _______. Maybe there are some other reasons to show (也许有其他原因要展示)_______. But it is generally believed that the above mentioned reasons are commonly convincing. As far as I am concerned, I hold the point of view that _______. I am sure my opinion is both sound and well-grounded.
- 1、下载文档前请自行甄别文档内容的完整性,平台不提供额外的编辑、内容补充、找答案等附加服务。
- 2、"仅部分预览"的文档,不可在线预览部分如存在完整性等问题,可反馈申请退款(可完整预览的文档不适用该条件!)。
- 3、如文档侵犯您的权益,请联系客服反馈,我们会尽快为您处理(人工客服工作时间:9:00-18:30)。
8).The figures peaked at……in(month/year) ……的数目在……月(年)达到顶点,为…… 9).The percentage of……is slightly larger/smaller than that of…… ……的比例比……的比例略高(低) 10). ……decreased year by year while……increased steadily. ……逐年减少,而……逐步上升。
2、表示数据变化的单词或者词组 迅速的,飞快的,险峻的 rapid/rapidly 戏剧性的,生动的 dramatic/dramatically 意义重大的,重要的 significant/significantly 明显的,急剧的 sharp/sharply 急剧升降的 steep/steeply 稳固的,坚定不移的 steady/steadily 渐进的,逐渐的 gradual/gradually 缓慢的,不活跃的 slow/slowly 轻微的、略微地 slight/slightly 稳定的 stable/stably
14). from……to……the rate of decrease slow down. 从……到……,下降速率减慢。
15). from this year on,there was a gradual decline /reduction in the……,reaching a figure of…… 从这年起,……逐渐下降至……
Model Answer
• The pie charts show changes in American spending patterns between 1966 and 1996. • Food and cars made up the two biggest items of expenditure in both years. Together they comprised over half of household spending. Food accounted for 44% of spending in 1966, but this dropped by two thirds to 14% in 1996. However, the outlay on cars doubled, rising from 23% in 1966 to 45% in 1996.
Pie Chart Description
IELTS Exam Writing task one: pie charts
• Write a report for a university lecturer describing the information below. • You should write at least 150 words. • You should spend about 20 minutes on this task.
4).The data/statistics/figures lead us to the conclusion that…… 这些数据资料令我们得出结论…… 5).The graph,presented in a pie chart, shows the general trend in…… 该图以圆形图形式描述了……总的趋势 6)……(year)witnessed/saw a sharp rise in…… ……年……急剧上升 7) The number sharply went up to…… 数字急剧上升至……
• The pie charts compare the highest level of education achieved by women in Someland across two years, 1945 and 1995. It can be clearly seen that women received a much higher level of education in Someland in 1995 than they did in 1945.
平面图、示意图、图底或外形图
Graph
表示两组数的关系-通常为函数关系图
图表作文写作常用的描述用法 1.句型
The table/graph/chart shows (that) According to the table/chart diagram/graph As is shown in the table/chart, …… As can be seen from the table/chart/diagram/graph/figures……
3、其它在描述中的常用到的词 noticeable / obvious trend 明显的趋势 a downward trend in sth a general trend in sth show an upward tendency distribute 分布,区别 unequally 不相等地 in the case of 在……的情况下
11).The situation reached a peak(a high point at) of[%]. ……的情况(局势)到达顶(高)点,为……百 分点
12).The figures/situation bottomed out in…… 数字(情况)在……达到底部 13). The figures reached the bottom/a low point/hit a trough. 数字(情况)达到底部(低谷)。
书面表达 (满分20分) 假如你叫 Jim Lee,你最近对你们学校 100名同学 (男女各半)进行了上网目的的调查。现将调 查结果(如下表所示)用英语给某报社的编辑 写一封信,报告此事。注意: 1. 报告应包括图表所示全部内容,但可以不涉 及具体数字。 2.叙述过程中可以适当添加评 语(120字)
It can be seen from the figures/statistics that We can see from the figures/statistics
It is clear / apparent from the figures/statistics(that) …… The table/chart/diagram/graph shows/describes/illustrates how……
图表作文分 table 几何图形 figure 图形表:饼状图 pie chart 条状图 bar chart 平面图, 示意图,外形图 diagram
Bar Chart / Graph
柱状图
Pie Chart
饼状图
1994
1995 60%
1996 48%
• In conclusion, increased amounts spent on cars, computers, and eating out were made up for by drops in expenditure on food and books.
Sample answer
1997 42%
1998 35%
Item
Food 65%
Clothing
8%
9%
5% 26% 100%
12%
7% 33% 100%
15%
8% 35% 100%
17%
10% 38% 100%
Recreation 3% Others Total 24% 100%
Table
矩形的竖行和横行进行排列的表格
Diagram
in terms of / in respect of / regarding 在……方面 in contrast government policy forecast n.先见,预见v.预测 70 percent / 70% of the students X times as large as X times larger than 20 percent more / less than
4、图表写作套句精选 1).The table shows the changes in the number of……over the period from……to…… 该表格描述了在……年之……年间……数量的变 化。 2).The graph provides some interesting data regarding…… 该图为我们提供了有关……有趣数据。 3).This is a graph which describes the trend of…… 这个曲线图描述了……的趋势。
图表中的数据(Data)具体表达法:
数据(Data)在某一个时间段固定不变:
fixed in time
在一系列的时间段中转变:
changes over time
持续变化的data在不同情况下:
增加:increase / rise / go up …… 减少:decrease / go down / drop / fall …… 稳定: remain stable / steady/ level / stabilize 波动:fluctuate / rebound / undulate / wave ……
图表作文三个层次要求
图表作文模板 ①As can be clearly seen from the graph/table/chart, great changed have taken place in __________ ①图表显示 的情况 Or: As is shown in the table/figure, . ②The __________ have/has skyrocketed/jumped from _____ to _____. ② 描述变化 ③When it comes to the reasons for the changes, different people give different explanations. Here I shall just give a few. ③ 概述原因 ④To begin with, . ④ 原因之一 ⑤What’s more, . ⑤原因之二 ⑥Last but not least, . ⑥ 原因之三 ⑦While it is desirable that ___________, there are still some problems and difficulties for __________ ⑦话题转移 ⑧Firstly, __________ ⑧要点一 ⑨In addition, __________ ⑨要点二 ⑩In a word, __________ ⑩总结