FTTH Worldwide Status 2009
中华人民共和国2009年国民经济和社会发展统计公报(英文)

Statistical Communiqué of the People's Republic of China on the 2009 National Economic and Social DevelopmentNational Bureau of Statistics of ChinaFebruary 25, 2010In 2009, under the leadership of the CPC Central Committee and the State Council, the people of all nationalities of China, taking as the guidance of Deng Xiaoping Theory and the important thought of “Three Represents”, implemented earnestly the scientific approach to the economic and social development, carefully put into effect the proactive fiscal policy and moderately easy monetary policy, carried out the package of plans and policies aiming at dealing with the international financial crisis in an all round way, national economic performance recovered and posed to the good direction and all social undertakings achieved new progress.I. General OutlookIn 2009, the gross domestic product (GDP) of the year was 33,535.3 billion yuan, up by 8.7 percent over the previous year. Analyzed by different industries, the value added of the primary industry was 3,547.7 billion yuan, up by 4.2 percent, that of the secondary industry was 15,695.8 billion yuan, up by 9.5 percent and the tertiary industry was 14,291.8 billion yuan, up by 8.9 percent. The value added of the primary industry accounted for 10.6 percent of the GDP, dropped by 0.1 percentage point over that in the pervious year, that of the secondary industry accounted for 46.8 percent, down by 0.7 percentage point, and that of the tertiary industry accounted for 42.6 percent, up by 0.8 percentage point.The general level of consumer prices in China was down by 0.7 percent over the previous year. Of this total, the prices for food went up by 0.7 percent. The prices for investment in fixed assets were down by 2.4 percent. The producer prices for manufactured goods dropped by 5.4 percent, of which, the prices for means of production down by 6.7 percent, and for means of subsistence decreased by 1.2 percent. The purchasing prices for raw materials, fuels and power went down by 7.9 percent. The producer prices for farm products were down by 2.4 percent. The prices for means of agricultural production were down by 2.5 percent. The sales prices for housing in 70 large andmedium-sized cities were up by 1.5 percent, of which, that for new residential buildings went up by 1.3 percent, for second hand housing grew by 2.4 percent, and the prices for rental and leasing were down by 0.6 percent.Table 1: General Level of Consumer Prices in 2009Unit: % Item NationalAverage Urban Rural General level of consumer prices -0.7 -0.9 -0.3 Food 0.7 1.0 0.1 Of Which: Grain 5.6 5.7 5.5 Meat, poultry and related products -8.7 -8.5 -9.2Oil -18.3 -17.9 -18.8Fresh eggs 1.5 1.3 2.0Fresh vegetables 15.4 15.0 16.7Fresh fruits 9.1 9.0 9.5 Tobaccos and alcohols 1.5 1.7 1.3 Clothing -2.0 -2.2 -1.6 Household appliances and services 0.2 0.3 0.0 Medical, health and personal articles 1.2 1.1 1.5 Transportation and telecommunications -2.4 -2.7 -1.8-0.7 -1.2 0.6 Recreational, educational, cultural articles andservicesHousing -3.6 -4.6 -1.5At the end of 2009, the total of employed people in China numbered 779.95 million, 5.15 million more than that of 2008. Of this total, 311.20 million were employed in urban areas, a net increase of 9.10 million, a newly increase of 11.02 million. The urban unemployment rate through unemployment registration was 4.3 percent at the end of 2009, an increase of 0.1 percentage point over that of 2008.At the end of 2009, China’s foreign exchange reserves reached 2,399.2 billion US dollars, an increase of 453.1 billion US dollars as compared with that at the end of the pervious year. At the end of the year, the exchange rate was 6.8282 RMB to 1 USD, an appreciation by 0.1 percent over that at the end of 2008.In 2009, the total fiscal revenue reached 6,847.7 billion yuan, up by 11.7 percent or an increase of 714.7 billion yuan over that in the previous year. Of this total, the taxes collected in the whole year reached 5,951.5 billion yuan, up by 9.8 percent or an increase of 529.1 billion yuan over 2008.II. AgricultureIn 2009, the sown area of grain was 108.97 million hectares, an increase of 2.17 million hectares as compared with that in the previous year; the sown area of cotton was 4.95 million hectares, a decline of 800 thousand hectares; the sown area of oil-bearing crops was 13.60 million hectares, an increase of 760 thousand hectares; the sown area of sugar crops was 1.88 million hectares, a drop of 110 thousand hectares.The total output of grain in 2009 was 530.82 million tons, an increase of 2.11 million tons or up by 0.4 percent over the previous year. Of this total, the output of summer crops was 123.35 million tons, up by 2.2 percent, and that of theearly rice was 33.27 million tons, up by 5.3 percent over the previous year. The output of autumn grain was 374.20 million tons, a drop of 0.6 percent.In 2009, the output of cotton was 6.40 million tons, a decrease of 14.6 percent over the previous year, that of oil-bearing crops was 31.00 million tons, up by 5.0 percent and that of sugar crops was 122.00 million tons, a drop of 9.1 percent, that of tobacco was 2.80 million tons, up by 6.7 percent, and that of tea was 1.35 million tons, up by 7.1 percent.The total output of meat for the year reached 76.42 million tons, up by 5.0 percent. Of this total, the output of pork was 48.89 million tons, up by 5.8 percent, and that of beef and mutton was 6.36 and 3.89 million tons, up by 3.6 percent and 2.4 percent respectively. At the end of the year, 469.85 million pigs are registered in the total stocks, up by 1.5 percent, and 645.07 million pigs are slaughtered, up by 5.7 percent. The production of milk was 35.18 million tons, down by 1.1 percent; the total output of eggs was 27.41 million tons, up by 1.4 percent.The total output of aquatic products was 51.20 million tons, up by 4.6 percent. Of this total, the output of cultured aquatic products was 36.35 million tons, up by 6.5 percent; and that of fished aquatic products was 14.85 million tons, up by 0.1 percent over the previous year.The total production of timber for the year 2009 reached 69.38 million cubic meters, a drop of 14.4 percent.Over 1.471 million hectares of farmland was increased with effective irrigation systems and another additional 1.826 million hectares of farmland was guaranteed by water-saving irrigation systems.III. Industry and ConstructionIn 2009, the total value added of the industrial sector was 13,462.5 billion yuan, up by 8.3 percent over the previous year. The value added of industrial enterprises above the designated size was up by 11.0 percent. Of this total, thatof the state-owned and state-holding enterprises grew by 6.9 percent, that of the collective enterprises went up by 10.2 percent, that of the share-holding enterprises increased by 13.3 percent, that of the enterprises by foreign investors and investors from Hong Kong, Macao and Taiwan soared by 6.2 percent and 18.7 percent growth for private enterprises. Analyzed by light and heavy industries, the growth of the light industry was 9.7 percent and that of the heavy industry was 11.5 percent.In 2009, of the industrial enterprises above designated size, the growth of value added for the mining and washing of coal industry was 8.3 percent over the previous year; for the extraction of petroleum and natural gas was 4.8 percent; for processing of food from agricultural product 15.9 percent; for textile industry 8.5 percent; for manufacture of general machinery 11.0 percent; for manufacture of special purpose machinery 13.0 percent; for manufacture of transport equipment 18.4 percent, of which, 20.3 percent for automobile manufacturing, and 20.7 percent for ship manufacturing; for manufacture of communication equipment, computers and other electronic equipment 5.3 percent and for manufacture of electrical machinery and equipment 12.0 percent. The growth of the value added for the major six high energy consuming industries were 10.6 percent, of which, that of the manufacture of non-metallic mineral products was 14.7 percent, manufacture of raw chemical materials and chemical products 14.6 percent, smelting and pressing of ferrous metals 12.8 percent, smelting and pressing of non-ferrous metals 9.9 percent, production and supply of electric power and heat power 6.0 percent and 5.2 percent for processing of petroleum, coking, processing of nuclear fuel. The value added growth for the high-tech industry was 7.7 percent over the previous year.Table 2: Output of Major Industrial Products and the Growth Rates in 2009Product Unit Output Increaseover2008 (%) Yarn10000 tons2393.5 12.7Cloth100 million meters740.0 4.2 Chemical fibers10000 tons2730.0 13.0Sugar (final product)10000 tons1321.2 -8.9 Cigarettes100 million22901.5 3.2Color TV sets100009898.8 9.6 Of which: LCD TV sets100006765.3 85.2 Household refrigerators 10000 5930.5 24.7 Room air conditioners 100008078.2 -1.9Total primary energy production100 million tons of28.0 5.8standard coal equivalentCoal100 million tons30.50 8.8Crude oil100 million tons 1.89 -3.1Natural gas100 million cubic851.7 6.1metersElectricity100 million 37146.5 6.3The profits made by the industrial enterprises above the designated size in the first 11 months of 2009 were 2,589.1 billion yuan, an increase of 7.8 percent over the same period of last year.Table 3: Profits and Growth of Industrial Enterprises above the DesignatedSize in the First Eleven Months of 2009Unit: 100million yuansame periodlast year (%) Industrial enterprises above designated size 25891 7.8Of which: State-owned and state-holding7514 -4.5enterprisesOf which: Collective enterprises 545 10.3 Share-holding enterprises 13890 4.2 Enterprises by foreign investors or7511 16.9 investors from Hong Kong, Macaoand TaiwanOf which: Private enterprises 6849 17.4In 2009, the value added of construction enterprises in China was 2,233.3 billion yuan, up by 18.2 percent over the previous year. The profits made by construction enterprises qualified for general contracts and specialized contracts reached 266.3 billion yuan, up by 21.0 percent, of which the profits made by the state-owned and state-holding enterprises were 69.7 billion yuan, up by 23.9 percent.IV. Investment in Fixed AssetsThe completed investment in fixed assets of the country in 2009 was 22,484.6 billion yuan, up by 30.1 percent over the previous year. Of the total investment, that in urban areas was 19,413.9 billon yuan, up by 30.5 percent; and that in rural areas reached 3,070.7 billion yuan, up by 27.5 percent. An analysis by regions showed that the investment in eastern areas was 9,565.3 billion yuan, up by 23.0 percent over the previous year, in central areas was 4,984.6 billion yuan, a growth of 35.8 percent, in western areas 4,966.2 billion yuan, a growth of 38.1 percent, and in northeastern areas 2,373.3 billion yuan, up by 26.8 percent.In the urban areas, the investment in the primary industry was 337.3 billion yuan, up by 49.9 percent; that in the secondary industry was 8,227.7 billion yuan, up by 26.8 percent; and that in the tertiary industry was 10,848.9 billion yuan, up by 33.0 percent.Table 4: Fixed Assets Investment in Urban Areas and Its Growth by Sector in 2009Unit: 100 million yuanTable 5: Newly Increased Production Capacity through Fixed Assets Investment in2009In 2009, the investment in real estate development was 3,623.2 billion yuan, up by 16.1 percent. Of this total, the investment in commercial residential buildings reached 2,561.9 billion yuan, an increase of 14.2 percent, that in office buildings was 137.8 billion yuan, up by 18.1 percent, and that in buildings for commercial business was 417.2 billion yuan, up by 24.4 percent.Table 6: Main Indicators for Real Estate Development and Sales in 2009V. Domestic TradeIn 2009, the total retail sales of consumer goods reached 12,534.3 billion yuan, up by 15.5 percent over the previous year. An analysis on different areas showed that the retail sales of consumer goods in cities reached 8,513.3 billion yuan, up by 15.5 percent and the retail sales of consumer goods at and below county level was 4,021.0 billion yuan, up by 15.7 percent. Analyzed by different sectors, the sales of the wholesales and retail trade reached 10,541.3 billion yuan, up 15.6 percent; the sales of the lodging and catering industry was 1,799.8 billion yuan, up 16.8 percent, and the sales of the other industries was 193.2 billion yuan, up 2.5 percent.Of the total retail sales by wholesale and retail enterprises above designated size, the year-on-year growth of sales for motor vehicles was 32.3 percent, that for grain and oil was 13.0 percent, for meat and eggs 8.3 percent, for clothing 20.8 percent, for daily necessities 15.6 percent, for cultural and office goods 6.7 percent. The sales of telecommunication equipment dropped by 1.3 percent. Theyear-on-year growth of sales for cosmetics 16.9 percent, for gold, silver and jewelry 15.9 percent, for traditional Chinese drugs and western drugs 21.7 percent, for electric and electronic appliances for household use and audio-video equipment 12.3 percent, for furniture 35.5 percent and building and decoration materials 26.6 percent.VI. Foreign Economic RelationsThe total value of imports and exports in 2009 reached 2,207.2 billion US dollars, down by 13.9 percent over the previous year. Of this total, the value of goods export was 1,201.7 billion US dollars, down by 16.0 percent, and the value of goods import was 1,005.6 billion US dollars, down by 11.2 percent. The balance of imports and exports was (exports minus imports) 196.1 billion US dollars, a decrease of 102.0 billion US dollars over the previous year.Table 7: Total Value of Imports and Exports and the Growth Rates in 2009Unit: 100 million USDTable 8: Main Export Commodities in Volume and Value and the Growth Rates in2009Table 9: Main Import Commodities in Volume and Value and the Growth Rates in2009Table 10: Imports and Exports by Major Countries and Regions and the GrowthRates in 2009Unit: 100 million USDThe year 2009 witnessed the establishment of 23,435 enterprises with foreign direct investment in non-financial sectors, down by 14.8 percent; and the foreign capital actually utilized was 90.0 billion US dollars, down by 2.6 percent. Of the total foreign direct investment actually utilized, the share of investment in manufacturing was 52.0 percent over the pervious year, the real estate 18.7 percent, leasing and business service 6.8 percent, wholesales and retail trade 6.0 percent and transportation, storage and post service 2.8 percent.Table 11: Total Value of Foreign Direct Investment and the Growth Rates in 2009In 2009, the overseas direct investment (non-financial sectors) by Chinese investors was 43.3 billion US dollars, up by 6.5 percent over the previous year. In 2009, the accomplished business revenue through contracted overseas engineering projects was 77.7 billion US dollars, up by 37.3 percent, and the business revenue through overseas labor contracts was 8.9 billion US dollars, up by 10.6 percent over the previous year.VII. Transportation, Post, Telecommunications and TourismThe value added of the transportation, storage, post and telecommunication sectors reached 1,705.8 billion yuan in 2009, up 3.7 percent over the previous year.Table 12: Freight Traffic by All Means of Transportation and the Growth Ratesin 2009Table 13: Passenger Traffic by All Means of Transportation and the GrowthRates in 2009Waterways 100 million persons 2.2 2.9 Civil aviation 100 million persons 2.3 19.7Passenger flows 100 million24773.6 6.8person-kilometersRailways 100 million7878.9 1.3person-kilometersHighways 100 million13450.7 7.8person-kilometersWaterways 100 million69.1 5.8person-kilometersCivil aviation 100 million3374.9 17.1person-kilometersThe volume of freight handled by ports above the designated size throughout the year totaled 6.91 billion tons, up 8.2 percent over the previous year, of which freight for foreign trade was 2.14 billion tons, up 8.6 percent. Container shipping handled 120.82 million standard containers, down by 5.8 percent. The total number of motor vehicles for civilian use reached 76.19 million (including 13.31 million tri-wheel motor vehicles and low-speed trucks) by the end of 2009, up 17.8 percent, of which private-owned vehicles numbered 52.18 million, up 25.0 percent. The total number of cars for civilian use stood at 31.36 million, up by 28.6 percent, of which private-owned cars numbered 26.05 million, up by 33.8 percent.The turnover of post and telecommunication services totaled 2,731.3 billion yuan, up 14.6 percent over the previous year. Of this total, post services accounted for 163.2 billion yuan, up 16.4 percent, and telecommunication services 2,568.1 billion yuan, up 14.4 percent. By the end of 2009, with a decrease of 16.44 million lines of office switchboards, the total capacity stood at 492.19 million lines. The newly increased capacity of mobile phone switchboard was 275.80 million lines with the total capacity reaching 1,421.11 million lines. The year also saw 313.69 million fixed telephone subscribers. This included 211.78 million urban subscribers and 101.91 million rural subscribers. Mobile phone users numbered 747.38 million by the end of 2009, with 106.14 million new subscribers in the year. In total, the number of fixed and mobile phone users reached 1,061.07 million, an increase of 79.47 million as compared with that at the end of 2008. Phone coverage is 79.9 sets per 100 persons. The number of Internet users was 380 million, of which wide-band users were 350 million, and the coverage rate of Internet was 28.9 percent.The year 2009 saw 1.90 billion domestic tourists, up 11.1 percent over the previous year. The revenue from domestic tourism totaled 1,018.4 billion yuan, up 16.4 percent. The number of inbound visitors to China totaled 126.48 million, a year-on-year decline of 2.7 percent. Of this total, 21.94 million were foreigners, down 9.8 percent; and 104.54 million were Chinese compatriotsfrom Hong Kong, Macao and Taiwan, down 1.1 percent. Of all the inbound tourists, overnight visitors counted 50.88 million, down 4.1 percent. Foreign exchange earnings from international tourism topped 39.7 billion US dollars, down 2.9 percent. The number of China’s outbound visitors totaled 47.66 million, up 4.0 percent. Of this total, 42.21 million were on private visits, a year-on-year rise of 5.2 percent, or 88.6 percent of all outgoing visitors.VIII. Financial IntermediationBy the end of 2009, money supply of broad sense (M2) was 60.6 trillion yuan, reflecting a year-on-year increase of 27.7 percent. Money supply of narrow sense (M1) was 22.0 trillion yuan, up 32.4 percent. Cash in circulation (M0) was 3.8 trillion yuan, up 11.8 percent.Savings deposit in Renminbi and foreign currencies in all items of financial institutions totaled 61.2 trillion yuan at the end of 2009, an increase of 13.2 tirllion yuan. Of this total, the savings deposit in Renminbi stood at 59.8 trillion yuan, an increase of 13.1 trillionyuan. Loans in Renminbi and foreign currencies in all items of financial institutions reached 42.6 trillion yuan, an increase of 10.5 trillion yuan. Of this total, that in Renminbi was 40.0 trillion yuan, an increase of 9.6 trillion yuan.Table 14: Savings Deposit and Loans in RMB and Foreign Currencies in All Financial Institutions and the Growth Rates in 2009Unit: 100 million yuanItem Year-end figure Increase over 2008 (%)Savings deposit 612006 27.7Of which: By enterprises 224357 36.5 By urban and rural households 264761 19.5Of which: Deposits in RMB 260772 19.7 Loans 425597 33.0Of which: Short-term 151353 17.7 Medium and long-term 235579 43.5Loans in Renminbi from rural financial cooperation institutions (i.e. rural credit cooperatives, rural cooperation banks, and rural commercial banks) totaled 4.7 trillion yuan by the end of 2009, an increase of 972.7 billion yuan as compared with the beginning of 2009. The loans in Renminbi for consumption use from all financial institutions totaled 5.5 trillion yuan, an increase of 1,797.6 billion yuan. Of all consumption loans, short-term loans for individuals totaled 0.6 trillion yuan,an increase of 246.5 billion yuan, and medium- and long-term loans for individuals reached 4.9 trillion yuan, an increase of 1,551.1 billion yuan.Funds raised in 2009 by enterprises through issuing stocks and share rights on stock market amounted to 365.3 billion yuan, an increase of 125.5 billion yuan over the previous year. Of this total, 99 A-shares were issued, receiving 206.2 billion yuan worth of capital altogether, an increase of 99.5 billion yuan. The refinancing of A-shares (including rationing shares, public newly issued, nonpublic newly issued and warrants) received 159.1 billion yuan worth of capital altogether, an increase of 25.9 billion yuan over 2008. The listed companies financed 81.3 billion yuan through convertible bonds, bonds with attached warrants and corporate bonds, a decrease of 18.5 billion yuan. A total of 36 growth enterprise board stocks were issued for the first time, receiving 20.4 billion yuan.In 2009, corporate funds raised by the non-listed companies reached 425.2 billion yuan, an increase of 188.5 billion yuan over that in the previous year. The short-term financing funds of enterprises were 461.2 billion yuan, an increase of 28.1 billion yuan; and the medium-term notes were 698.7 billion yuan, an increase of 525.0 billion yuan. Funds raised by medium- and small-sized enterprises through collection notes reached 1.27 billion yuan.The premium received by the insurance companies totaled 1,113.7 billion yuan in 2009, up 13.8 percent over the previous year. Of this total, life insurance premium amounted to 745.7 billion yuan, health and casualty insurance premium 80.4 billion yuan, and property insurance premium 287.6 billion yuan. Insurance companies paid an indemnity worth of 312.5 billion yuan, of which, life insurance indemnity was 126.9 billion yuan, health and casualty insurance indemnity 28.1 billion yuan, and property insurance indemnity 157.6 billion yuan.IX. Education, Science and TechnologyIn 2009, the post-graduate education enrollment was 1.405 million students with 511 thousand new students and 371 thousand graduates. The general tertiary education enrollment was 21.447 million students with 6.395 million new students and 5.311 million graduates. Vocational secondary schools of various types had 21.787 million enrolled students, including 8.736 million new entrants, and 6.192 million graduates. Senior secondary schools had 24.343 million enrolled students, including 8.303 million new entrants, and 8.237 million graduates. Students enrolled in junior secondary schools totaled 54.409 million, including 17.885 million new entrants, and 17.977 million graduates. The country had a primary education enrollment of 100.715 million students, including 16.378 million new entrants, and 18.052 million graduates. There were 428 thousand students enrolled in special education schools, with 64 thousand new entrants. Kindergartens accommodated 26.578 million children.The amount of expenditures on research and development activities (R&D) was worth 543.3 billion yuan in 2009, up 17.7 percent over 2008, accounting for 1.62 percent of GDP. Of this total, 27.2 billion yuan was appropriated for fundamental research programs. A total number of 639 projects under the National Key Technology Research and Development Program and 1,328 projects under the Hi-tech Research and Development Program (the 863 Program) were implemented. The year 2009 saw a total of 127 national engineering research centers and 85 national engineering laboratories. The number of state validated enterprise technical centers reached 636 by the end of the year. The technical centers at the provincial level numbered 5,011. Venture capital investment plan had been initiated and implemented to boostnew emerging industries, and 20 venture investment funds were established. Some 977 thousand patent applications were accepted from home and abroad, of which 878 thousand were domestic applications, accounting for 89.9 percent of the total. A total number of 315 thousand patent applications for new inventions were accepted, of which 229 thousand were from domestic applicants or 72.8 percent of the total. A total of 582 thousand patents were authorized in 2009, of which 502 thousand were domestic patents, accounting for 86.2 percent of the total. A total of 128 thousand patents for new inventions were authorized, of which 65 thousand were domestic ones, accounting for 50.9 percent. Till the end of year 2009, the number of patents in force was1.520 million, of which 1.193 million patents were domestic ones, accounting for 78.5 percent; the number of patents in force for inventions was 438 thousand, of which 180 thousand was domestic ones, accounting for 41.1 percent. A total of 214 thousand technology transfer contracts were signed, representing 303.9 billion yuan in value, up 14.0 percent over the previous year. The year 2009 saw 6 times of successful launch of satellites. The first petaflop super computer Galaxy 1 was developed successfully, and ChangEr 1 satellite hit moon successfully.By the end of 2009, there were altogether 25,000 laboratories for product inspection, including 414 national inspection centers. There were 168 organizations for product certification and management system certification, which accumulatively certified products in 41 thousand enterprises. A total of 3,760 authorized measurement institutions enforced compulsory inspection on 45.60 million measurement instruments in the year. A total of 3,158 national standards were developed or revised in the year, including 2,102 new standards. There were 2,737 weather warning signals sent by national and provincial meteorological stations, and 3,950 weather alerts. There were1,457 seismological monitor stations and 32 seismological remote monitor network stations. The numbers of oceanic observation stations were 66. Mapping departments published 2,060 maps and 307 mapping books.X. Culture, Public Health and SportsAt the end of 2009, there were 2,478 art-performing groups, 3,214 culture centers, 2,833 public libraries, 1,996 museums, 251 radio broadcasting stations, 272 television stations, 2,087 radio broadcasting and television stations and 44 educational television stations throughout China. Subscribers to cable television programs numbered 173.98 million. Subscribers to digital cable television programs were 62.00 million. Radio broadcasting and television broadcasting coverage rates were 96.3 percent and 97.2 percent respectively. The country produced 456 feature movies and 102 science, educational, documentary, cartoon and special movies. A total of 43.7 billion copies of newspapers and 3.1 billion copies of magazines were issued, and 7.0 billion copies of books published. By the end of the year, there were 4,035 archives in China and 79.91 million documents were made accessible to the public.By the end of 2009, there were 289 thousand health institutions in China, including 60 thousand general hospitals and health centers, 26 thousand community health service centers, 3,013 maternal and child health-care institutions, 1,315 specialized health institutions, 3,543 epidemic disease prevention centers (stations) and 2,706 health monitoring institutions and 193 thousand clinics. There were 5.22 million health workers in China, including 2.16 million practicing doctors and assistant practicing doctors and 1.74 million registered nurses. General hospitals and health centers in China possessed 3.96 million beds. The number of rural health care centers was 39 thousand, possessing 910 thousand beds and employing 898 thousand health care。
2009年度卫星电视列表
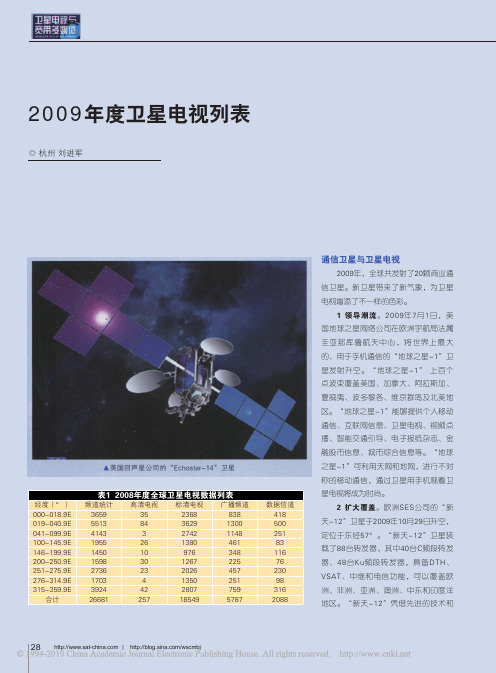
通信卫星与卫星电视2009年,全球共发射了20颗商业通信卫星。
新卫星带来了新气象,为卫星电视增添了不一样的色彩。
1 领导潮流。
2009年7月1日,美国地球之星网络公司在欧洲宇航局法属圭亚那库鲁航天中心,将世界上最大的、用于手机通信的“地球之星-1”卫星发射升空。
“地球之星-1” 上百个点波束覆盖美国、加拿大、阿拉斯加、夏威夷、波多黎各、维京群岛及北美地区。
“地球之星-1”能够提供个人移动通信、互联网信息、卫星电视、视频点播、智能交通引导、电子报纸杂志、金融股市信息、城市综合信息等。
“地球之星-1”可利用天网和地网,进行不对称的移动通信,通过卫星用手机观看卫星电视将成为时尚。
2 扩大覆盖。
欧洲SES公司的“新天-12”卫星于2009年10月29日升空,定位于东经57°。
“新天-12”卫星装载了88台转发器,其中40台C频段转发器、48台Ku频段转发器,具备DTH、VSAT、中继和电信功能,可以覆盖欧洲、非洲、亚洲、澳洲、中东和印度洋地区。
“新天-12”凭借先进的技术和2009年度卫星电视列表◎ 杭州 刘进军表1 2008年度全球卫星电视数据列表经度(°)频道统计高清电视标清电视广播频道数据信道000-018.9E 3659352368838418019-040.9E 55138436291300500041-099.9E 4143327421148251100-145.9E 195526138046183146-199.9E 145010976348116200-250.9E 159830126722576251-275.9E 2736232026457230276-314.9E 17034135025198315-359.9E3924422807759316合计266812571854957872088▲美国回声星公司的“Echostar-14”卫星专题报道2010年第2期覆盖能力,提供世界一流的通信服务,覆盖世界人口的三分之二,服务几乎整个东半球。
2009年上半年全球电信行业热点回顾
2009年上半年全球电信行业热点回顾中国移动研究院产业市场研究所2009年6月目录一、行业环境 (4)1、金融危机对电信业的影响逐步显现 (4)1)08年第四季度的裁员风波仍在延续 (4)2)09年上半年的电信市场资本运作活跃度明显下降 (5)2、欧美加速宽带部署,抵御经济危机同时提升未来技术实力 (6)1)美国政府签署刺激计划,高速网络接入领域是重点之一 (6)2)宽带互联网成欧盟经济刺激重点,扩大和升级基础设施成当务之急 (6)3、LTE作为4G主流通信技术正在迅速迈向商用,WIMAX成为发展无线宽带业务的选择之一 (7)1)瑞典启动全球首个LTE商用站点 (7)2)日本正式发放LTE牌照,计划2011年投入使用 (7)3)Verizon将率先在美国实现LTE商用 (7)4)WIMAX成为运营商发展宽带业务的选择之一 (8)5)Alvarion为中华电信布建WiMAX网络 (8)二、政策监管 (9)1、光纤宽带接入的定价监管框架趋于明朗 (9)1)Ofcom调整线路批发价格,英国电信仍不满意 (9)2)英国电信赢得了光纤宽带的定价权 (9)2、互联网内容监管更加严格,运营商或成为内容监管的重要执行者 (10)1)DoCoMo对未成年人手机屏蔽交友网站 (10)2)英国提出在线视频监管框架 (10)3)英国政府计划建立网络反盗版中间机构 (10)4)EU对互联网隐私保护下最后通牒 (10)三、产业格局 (11)3、传统互联网冲击与日俱增,运营商采用三类典型战略应对模式 (11)1)Docomo提供个性化业务,进行精细化运营 (11)2)Vodafone立足合作,加强运营 (11)3)和黄3继续引进传统互联网应用,管道化趋势加强 (12)4、深化运营、明确重点,Nokia、Microsoft等谋求互联网布局 (13)1)Nokia继续深化运营 (13)2)微软Bing搜索品牌独立,正式挑战Google (13)四、业务动态 (14)1、运营商限制大带宽业务,以缓解移动数据流量猛增带来的网络压力 (14)1)全球移动数据流量猛增,运营商网络压力加大 (14)2)AT&T限制Slingplayer使用3G网络,避免造成网络堵塞 (15)2、各大巨头扎堆应用程序商店,第三方应用平台掀起新的竞争热潮 (15)1)终端厂商纷纷发力第三方应用平台 (15)2)互联网公司纷纷涉足 (16)3)电信运营商亦加入角逐 (16)五、终端趋势 (17)1、手机操作系统向互联网终端全面渗透,“管理型终端平台”成移动互联网发展重要趋势 (17)1)几大手机操作系统正在向移动互联网终端全面“攻城略地” (17)2)基于各类手机操作系统的应用程序商店陆续亮相 (18)2、运营商争相定制,上网本将成为运营商3G竞争的重要棋子 (19)1)运营商纷纷介入上网本市场 (19)2)全球上网本销量剧增 (19)3、高端手机销量逆势而上,成终端市场未来竞争焦点 (20)1)高端智能手机销量坚挺,利润丰富 (20)2)苹果、G1手机争相升级,引领智能手机潮流发展 (20)3)老牌厂商发力智能手机,欲重夺高端市场霸主地位 (20)4)PC厂商集体试水,介入智能手机领域 (20)4、移动互联网功能成为标准配置,智能终端不断探索最佳融合点 (21)1)无线通信模块将成为各类终端“标准配置” (21)2)终端产品融合趋势继续,各种形态产品层出不穷 (21)一、行业环境1、金融危机对电信业的影响逐步显现1)08年第四季度的裁员风波仍在延续金融危机导致的经济衰退影响了电信运营商盈利能力。
摩托罗拉
FTTH 资料从头端到家庭娱乐及通信,摩托罗拉提供成熟、具创新性的接入解决方案,帮助服务供应商提供语音、视频和数据服务,并通过网络演进支持超宽带服务的推出。
作为接入网络技术的全球领导者,摩托罗拉为全球不同规模的运营商提供服务。
凭借能够支持最复杂的宽带视频和娱乐网络的FTTH 部署解决方案,摩托罗拉能够显著简化超宽带网络部署。
摩托罗拉的FTTH 解决方案,利用千兆无源光网络(GPON )技术来消除接入网络中的有源网络部分,从而提供巨大的可扩展潜能,并能降低运营成本。
运营商可在降低外部设备的维护成本的同时,推出一系列具独特竞争优势的“三网融合”服务。
摩托罗拉提供经过实地验证的GPON 接入解决方案,能够有效提供可扩展的住宅和商业服务。
此外,摩托罗拉还提供经过验证、成熟的客户端设备和基础设施解决方案,使服务供应商能够通过GPON 技术来优化FTTH 的创收能力。
用户在选择服务供应商时面临许多选择。
那些能够满足当今带宽需求,同时又可以承诺在将来提供更高带宽的运营商,能够藉此机会提高自身的市场占有率,创造更高的每用户平均收入(ARPU ),减少用户流失。
摩托罗拉提供集中式的光线路终端(OLT )和一系列专为家庭、商业、企业和多住户单元(MDU )环境而设计的光网络终端(ONT ),填补GPON 技术和客户端设备之间的空白,从而帮助服务供应商推出可盈利的FTTH 服务,并在日益激烈的市场环境中得以发展。
摩托罗拉具创新性的GPON ONT 和OLT ,将光纤延伸至服务供应商网络的边缘,从而保证用户在任何地方都能享用端到端的超宽带服务。
摩托罗拉的FTTH 网元管理系统AXSvision ,通过简化和加速新型、丰富的个性化娱乐以及通信服务的创建及推出,充分释放了摩托罗拉下一代FTTH 解决方案的能量。
全球运营商信赖摩托罗拉在运营商级网络和数字视频娱乐技术方面的核心能力,能提供可靠的FTTH 解决方案,帮助运营商面向住宅和商业用户推出可盈利的可扩展超宽带服务。
康宁何思道:中国FTTH前景看好

康宁何思道:中国FTTH前景看好罗茜文【摘要】@@ 经过2007~2009年的复元式发展,中国光纤到户彻底步出IT泡沫期以来的低谷,并因为宽带应用的需求,和三网融合的政策驱动,有望在2010年进入规模商用阶段."三网融合的政策将给中国的光纤到户带来很好的发展方向.网络视频、数据传输、音频上传等消费者上网习惯的改变也促使网络承载和带宽增长的需求.在中国,光纤到户不仅发展良好,发展前景也会很好."康宁通信(大中华区)市场与战略副总裁何思道(Doug Harshbarger)在接受媒体专访时表示.【期刊名称】《移动通信》【年(卷),期】2010(034)011【总页数】2页(P89-90)【作者】罗茜文【作者单位】【正文语种】中文经过2007~2009年的复元式发展,中国光纤到户彻底步出IT泡沫期以来的低谷,并因为宽带应用的需求,和三网融合的政策驱动,有望在2010年进入规模商用阶段。
“三网融合的政策将给中国的光纤到户带来很好的发展方向。
网络视频、数据传输、音频上传等消费者上网习惯的改变也促使网络承载和带宽增长的需求。
在中国,光纤到户不仅发展良好,发展前景也会很好。
”康宁通信(大中华区)市场与战略副总裁何思道(Doug Harshbarger)在接受媒体专访时表示。
今年5月份以来,康宁公司在华举行了一系列的活动,庆祝第一根低损耗商用光纤发明40周年。
1970年,三位科学家唐纳德.凯克、罗伯特.莫勒(Robert Maurer)、彼德.舒尔茨(Peter Schulez)利用熔融石英进行传输的方法,发明出全球第一条损耗低于20dB/km的光纤。
康宁公司在此基础上发明了大规模生产光纤的工艺,从而使低成本、高容量光纤传输系统的部署进入人类的日常生活。
低损耗光纤的光明引领了全球通信产业的变革。
在这之后的40年,康宁公司从没停止过在光纤技术方面的创新,以帮助客户应对光纤到户建设中的各种挑战,加快光纤到户在全球的发展。
1 FTTH网络发展介绍

2012-5-7
18
用户数最多的5个经济体是:中国大陆、日本、 韩国、美国和台湾,这5个经济体的用户数占全 球总数的90%。
国际FTTH FTTH发展情况 FTTH
19
亚洲FTTH用户分布
20
日本FTTH发展历程
21
韩国FTTH发展简介
22
北美FTTH发展简介
北美的FTTH 依然在不断发展
至2010 年12 月已经有2064万个家庭通达光纤, 占北美家庭数的20% 超过700 万的家庭用光纤连接到互联网、电话和 CATV等业务 2010年底北美的FTTH用户数超过700万 2010年北美宽带用户的下行速率平均增长了34%
Multiple Play Coming
技术驱动:新接入技术的逐步商用和FTTx工程部署的快速成熟
ADSL2+ VDSL2 PON NG PON
运营商社会责任
FTTH发展动力
FTTX用户分布 中国FTTX用户数 欧洲7.2% 其它2.2% 年份 2008 2009 2010 用户数(含FTTB) 北美8.3% 800万 2000万 3000万 亚洲82.3%
3
FTTH组网
4
FTTH应用场景
5
FTTH发展历程
FTTH并不是一种新概念,已有28年历史,二 次发展契机。
第一 次:1978年主要在法国、加拿大和日本三国 进行 第二次:1995年左右主要是美国和日本。
失败原因:两次发展机遇全都由于成本太高,缺乏市场 需求而夭折。
Hale Waihona Puke 第三次2004年起FTTH进入了第三次发展机遇期
2009年全国电信业统计公报2
首 页要 闻滚 动观 察头 条排 行网 讯图 集国 内财 经国 际政 策环 境教 育文 化天台 湾法 治军 事评 论健 康科 技娱 乐旅快讯·罗本“替身”非他莫属 埃利亚距豪门仅一步之遥·C罗:非洲能助葡萄牙夺冠 纳尼缺席是每日回顾>>首页 >> 新闻中心 字号:大 中 小2009年全国电信业统计公报时间: 2010-02-03 10:56:43 来源: 工业与信息化部发表评论>>关键词: 2009年用户电信业移动电话统计公报内容摘要: 长途通话中,固定传统长途电话通话时长825.6亿分钟,下降6.3%;移动长途电话通话时长2376.4亿分钟,增长31.8%;IP电话通话时长1185.6亿分钟,下降15.1%。
预计全年实现电信主营业务收入8800亿元,同比增长4.5%;电信业务总量28762亿元,同比增长12%;固定电话用户减少0.28亿户,达到2.85亿户;移动电话用户净增1.08亿户,达到8.55亿户;互联网宽带接入用户净增0.2亿户,达到1.23亿户。
大中小2009年,在党中央、国务院的正确领导下,我国电信业紧紧围绕“保增长、扩内需、调结构、惠民生”的目标,认真落实应对国际金融危机的各项政策措施,积极开展3G 建设及业务应用,大力推进TD产业化、商业化进程,加快通信业转型步伐,市场竞争格局得到进一步优化,全行业保持平稳健康发展。
一、总体情况初步核算,2009年累计完成电信业务总量25680.6亿元,同比增长14.4%;实现电信主营业务收入8424.3亿元,同比增长3.9%;完成电信固定资产投资3724.9亿元,同比增长26.1%;实现电信增加值5012.2亿元,同比增长7.0%。
2009年,电信综合价格水平同比下降了9.0%。
图1. 2005-2009年电信综合价格水平下降情况二、电信用户2009年,全国电话用户净增7946.7万户,总数达到106107.2万户。
国外运营商力挺光纤接入网建设FTTH业务拉动ARPU提升
国外运营商力挺光纤接入网建设FTTH业务拉动ARPU提升龚政霞2013-2-20 15:25:24 来源:《世界电信》2012年第09期目前,全球越来越多的国家推出宽带战略,光网络成为促进经济发展和提升国家竞争力的重要基础设施,光纤接入网络建设及业务拓展进入一个新的高速发展阶段。
截至2011年年底,全球FTTx用户达到近1亿,比2010年净增2480万,是历年来净增用户最多的一年。
同样,全球领先运营商的FTTH部署效果初显,ARPU值远远高于固网整体业务,FTTH业务收入不断增长,2011年,运营商的FTTH业务收入首次实现年度盈利,同时FTTH业务服务质量也高于其他技术。
国外运营商大力建设光纤接入网络目前,NTT DoCoMo、Verizon等全球领先的运营商如积极采用FTTH/FTTB建设光纤接入网络,使得光纤越来越靠近用户,运营商通常采用FTTC模式为用户提供的带宽约为40Mbit/s左右,采用FTTB/FTTH模式可为用户提供100Mbit/s 以及更高的速率。
EPON技术主要被一些亚太地区的运营商选用,欧洲、北美的运营商则大多选择GPON技术。
运营商分步骤推进光纤到家由于用户需求不同,各国国情不同,各国运营商采取了分步骤推进光纤到家的策略。
日本NTT DoCoMo的光纤接入建设主要采用FTTB/FTTH模式。
NTT DoCoMo的FTTB/FTTH建设最早采用STMPON技术,2002年开始引入BPON技术,2004年开始采用EPON技术。
NTT DoCoMo采用动态带宽分配技术对每个ONU的上行带宽需求区分,根据业务量的需求动态分配带宽,从而提高网络效率。
对于多住户楼宇的FTTTH铺设,NTT DoCoMo采用1︰32的一级分光结构;对于单住户公寓的FTTH 铺设,NTT DoCoMo采用1︰8及1︰4的二级分光结构,以提高光缆资源利用率和PON的使用效率。
到2007年,NTT DoCoMo公司光纤接入网络覆盖率达到近90%(到馈线点),2010年基本完成了网络的大规模建设。
FT2009年年报
press releaseParis, 25 February 2010France Telecom achieved its 2009 commercial and financial objectives, with an organic cash flow of 8.35 billion eurosNote: the reported figures exclude activities in the United Kingdom, which are no longer consolidated following the announcement in September 2009 of the planned merger of the Orange and T-Mobile operations in the United Kingdom. The United Kingdom segment is now treated as a discontinued operation in the financial statements.• •193 strong growth in the total number of customers, with 193 million customers at 31 December 2009 (+5.7%) consolidated revenues of 45.944 billion euros, down 1.8% on a comparable basis UK). measures, (50.952 billion euros including the UK). Excluding the impact of regulatory measures, revenues revenues rose 0.1% for 2009 restated EBITDA of 16.327 billion euros with a margin of 35.5%, a decrease of 0.5 points points UK). on a comparable basis (17.254 billion euros including the UK). Excluding the impact of 1 margin points regulatory measures and new taxes, the restated EBITDA margin rose 0.1 points. The net income Group share was 4.849 billion euros on a comparable basis, a decrease of 6.4% (2.997 billion euros on a reported basis) capital expenditure of 5.3 billion euros, for a CAPEX rate of 11.5% of revenues organic cash flow of 8.35 billion euros, better than the announced objective 2009, proposed dividend of 1.40 euros per share for 2009, of which the remaining 0.8 euros will be paid on 17 June 2010 2011 the Group maintains its ambitions for organic cash flow generation for 2010 and 2011•• • • • •an increase in the overall customer base of 5.7% year on year (192.7 million customers at 31 December 2009) 8.8% growth in the mobile customer base (132.6 million customers) 4.1% rise in ADSL broadband subscribers (13.5 million customers) and very rapid growth of digital TV, with 3.2 million subscribers at 31 December 2009 for a year-on-year increase of 53%1 Adjusted EBITDA excludes the following two non-recurring items for 2009, which had no impact on the Group’s cash position in 2009: (i) an expense of 964 million euros linked to the decision by the General Court of the European Union (also known as the Court of First Instance) pertaining to the special corporate tax regime (Tax Professionelle) applied to France Telecom in France prior to 2003, and (ii) the provision of 569 million euros for the establishment of the “part time for seniors” plan which is part of the general agreement concerning personnel close to retirement age which was signed in November 2009.•revenue growth of 0.1%, excluding regulatory impact: 1.6% growth of operations in France, including a 5.0% increase in mobile services revenues 5.8% growth in Africa and the Middle East 3.1% growth in Western Europe, driven by Belgium other operations continued to be affected by the deterioration in the economic environment, particularly Romania where revenues were down 16.7% and the Enterprise segment which was down 3.5% th revenues improved in the 4 quarter of 2009, driven by Western Europe, Spain, Africa and the Middle East 35.5% 5%, restated EBITDA margin of 35.5% a 0.5-point decrease compared with 2008, reflecting the impact of regulatory measures and new taxes excluding the provision for the “part time for seniors” plan, EBITDA margins for France and the Enterprise segment are stable significantly improved profitability of mobile services in Spain (+1.1 points) the EBITDA margin trend for the Rest of World was impacted both by new operations and the economic environment in Central Europe (-2.5 points)••revenues), capital expenditure was 5.3 billion euros (11.5% of revenues) compared with 6.3 billion euros in 2008 (13.4% of revenues) on a comparable basis. (CAPEX including the United Kingdom was 5.66 billion euros versus 6.87 billion euros in 2008). This reduction related to: - the non-recurrence of real estate investments of 163 million euros in 2008 - CAPEX optimization and adjustment to reflect business volumes, particularly relating to 2G networks, IT and fixed legacy services th CAPEX for the 4 quarter was significantly higher than the average level for the first three quarters of the year, in line with seasonal trends seen in previous years•euros, 4.2% growth in organic cash flow, to 8.35 billion euros compared with 8.016 billion euros in 2008 This increase in organic cash flow reflects the improvement of the financial results, the decrease in corporate taxes paid, as well as the decline in expenses related to the acquisition of telecommunications licenses•net financial debt down to 33.9 billion euros at 31 December 2009 (for a net debt to restated EBITDA ratio of 1.97), compared with 35.9 billion euros at 31 December 2008 (a ratio of 1.96). Excluding the impact of the public offer for ECMS shares currently underway (1.082 billion euros), net financial debt was 32.9 billion euros at 31 December 2009, for a net debt to restated EBITDA ratio of 1.90, in line with the Group’s financial policy•net income Group share (attributable to equity holders of France Telecom) declined 6.4% on a comparable share (attributable Telecom) 2 basis , to 4.849 billion euros; on a reported basis, it fell to 2.997 billion euros, compared with 4.069 billion euros in 20082 The main non-recurring items used to establish net income attributable to equity holders of France Telecom in comparable terms are indicated on page 9 under the heading “Net income”.2Commenting on the Group’s 2009 consolidated results, Didier Lombard Chairman and Chief Executive Officer of France Lombard, Telecom, said: “The Group’s performance in 2009 confirms the strategy undertaken in 2005 to position the company as an integrated operator. Since then, the Group has significantly increased its customer base and its geographical footprint while capitalizing on new technologies, thus enabling the Group to look to the future with confidence. As I hand over to Stéphane Richard, I would like to express my gratitude towards all of the Group’s employees for this shared success.” Richard, Stéphane Richard Chief Executive Officer designate of France Telecom, added: “I would first like to thank Didier Lombard for leading the Group’s transformation from being a national monopoly to a robust multi-national group that can boast more than 190 million customers and 180,000 employees in 32 countries, all while keeping a tight reign on its financial performance. It is an outstanding group blessed with many excellent qualities, even as it faces a crisis of confidence in France. We are working to recenter the business to provide a renewed outlook for the Group as a whole. This new project, which will be announced before the summer, aims to reposition both customers and employees firmly at the heart of the executive management’s priorities in a way that balances economic performance with social considerations while retaining our leadership position in innovation. This is the exciting task that lies ahead for me and the new management team.”additional information The Board of Directors of France Telecom SA met on 24 February 2010 and examined the Group’s consolidated and non-consolidated financial statements. The Group’s statutory auditors carried out their audit of these financial statements and the audit reports pertaining to their certification are in the process of being issued. More information is available on France Telecom's websites: 3key figures3•full year data2009 2008 comparable basis(unaudited)in millions of euros2008 historical basischange comparable basis (in %)change historical basis (in %)impact of change in exchange rates(in %)impact of change in consolidated group (in %)Consolidated revenuesFrance United Kingdom Spain Poland Rest of World Enterprise International Carriers and Shared ServicesEliminations Revenues including United Kingdom23 639 5 108 3 887 3 831 8 308 7 559 1 388-2 76823 627 5 289 4 067 4 202 8 409 7 834 1 345-2 81623 726 5 926 4 067 5 184 8 322 7 785 1 349-2 8710.1 -3.4 -4.4 -8.8 -1.2 -3.5 3.2--0.4 -13.8 -4.4 -26.1 -0.2 -2.9 2.9--10.7 -18.9 1.3 0.6 --0.4 -0.2 -0.3-50 95251 95753 488-1.9-4.7-2.7-0.1Consolidated Consolidated revenuesexcluding United Kingdom4 Restated EBITDA 445 94446 80047 699-1.8-3.7-1.7-0.2France4 United Kingdom Spain Poland Rest of World Entreprise4 International Carriers and Shared services4Eliminations9 713 939 729 1 462 3 237 1 529 -355-9 781 1 080 614 1 740 3 491 1 578 -371-9 854 1 204 614 2 146 3 446 1 508 -444--0.7 -13.1 18.8 -16.0 -7.3 -3.1 -4.3--1.4 -22.0 18.8 -31.9 -6.0 1.4 -20.0--13.7 -19.0 1.4 4.7 -4.1--0.7 3.4 0.1 -12.0-EBITDA4 including the UnitedKingdom in % of revenues17 25433.9%17 91334.5%18 32834.3%-3.7-0.6 pt-5.9-0.4 pt-2.40.1Consolidated EBITDA4(excluding United Kingdom) in % of revenues16 32735.5%16 83236.0%17 08335.8%-3.0-0.5 pt-4.4-0.3 pt-1.60.1Operating income Net income Group share Net income Group shareComparable basis CAPEX (excluding licenses)7 859 2 997 849 4 849 5 30411.5%9 9109 945 4 069 181 5 181 6 41413.4%283 6 28313.4%At 31 Dec. 20095-15.6-1.9 pt-17.3-1.9 pt-2.10.0in % of revenuesOrganic cash flow8 350At 31 Dec. 20098 016At 31 Dec. 20084.2Net financial debtRatio of net financial debt / restated EBITDA including United Kingdom33 9411.9732 8591.9035 8591.963 Following the announcement in September 2009 of the merger of the Orange and T-Mobile operations in the United Kingdom, the United Kingdom segment is treated as a discontinued operation in the financial statements. However, it is still presented as a business segment in the business segment report of the consolidated financial statements (see review by business segment, page 17). 4 Restated EBITDA for 2009 excludes (i) the provision linked to the “part time for seniors” plan of 461 million euros for France, 28 million euros for Enterprise and 80 million euros for Operators and Shared Services, and (ii) expense of 964 million euros linked to the dispute pertaining to the special corporate tax regime applied to France Telecom in France prior to 2003 borne by the Operators and Shared Services segment. 5 Excluding the impact of the public offer for ECMS shares currently underway for 1.082 billion euros.4•quarterly data64th quarter 20094th quarter 2008 comparable basis(unaudited)4th quarter 2008 historical basisChange comparable basis(in %)change historical basis(in %)impact of change in exchange rates(in %)impact of change in consolidated group(in %)in millions of eurosConsolidated revenuesFrance United Kingdom Spain Poland Rest of World Enterprise International Carriers and Shared ServicesEliminations5 919 1 290 961 961 2 118 1 900 349-6896 013 1 305 994 1 097 2 140 2 010 380-7356 056 1 410 994 1 218 2 287 2 042 375-748-1.6 -1.2 -3.3 -12.4 -1.0 -5.5 -8.3--2.3 -8.5 -3.3 -21.1 -7.4 -6.9 -7.2--7.4 -10.0 -2.7 -1.4 -0.4--0.7 -3.8 -0.1 1.6-Revenues including United KingdomConsolidated revenues(excluding United Kingdom)12 80813 20413 634-3.0-6.1-2.3-0.911 540 3 67431.8%11 929 3 70731.1%12 254 3 72230.4%-3.3 -0.90.7 pt-5.8 -1.31.4 pt-1.7 -1.2-0.9 0.8Consolidated 7 restated EBITDA :in % of revenuesCAPEX (excluding licenses)France Spain Poland Rest of World Enterprise International Carriers and Shared Services 747 153 232 485 102 99 711 173 193 607 116 235 708 173 221 642 117 238 4.9 -11.6 20.1 -20.0 -12.4 -57.9 5.4 -11.6 5.1 -24.4 -12.9 -58.5 -12.5 -2.6 -0.5 -0.1 0.5 -2.8 -1.4CAPEX (excluding licenses)in % of revenues7 Restated EBITDA – CAPEX 71 81715.7%2 03517.1%2 09917.1%-10.7-1.4 pt-13.4-1.4 pt-2.2-0.81 8561 6711 62411.114.36 7Quarterly data unaudited Consolidated restated EBITDA excludes (i) the impact of the expense related to the special corporate tax regime applied to France Telecom in France prior to 2003 (964 million euros), and (ii) the provision pertaining to the “part time for seniors” plan (569 million euros).5figures comments on key Group figuresrevenuesfullfull-year 2009 Consolidated revenues for the France Telecom group (excluding the United Kingdom) were 45.944 billion euros in 2009, a decrease of 1.8% on a comparable basis and 3.7% on an historical basis. Excluding the impact of regulatory measures (-924 million euros), revenues increased 0.1%. 8 Including the United Kingdom, consolidated revenues were 50.952 billion euros, a 1.9% decline compared with the previous year on a comparable basis. Excluding the impact of regulatory measures (-1.116 billion euros), revenues increased 0.2%. Excluding regulatory measures: - France was up 1.6%: mobile services were up 5.0%, while fixed services were steady with a decline limited to -0.4%; - Africa and the Middle East posted strong growth (+5.8%), driven in particular by Egypt (+8.2%) and new 9 operations in Africa (+23.1%); 10 - Western Europe rose 3.1%, driven by Belgium (+4.2%) and Luxembourg (+16.1%); th - the United Kingdom regained positive annual growth (+0.2%), due to a particularly buoyant 4 quarter in mobile services; th - in Spain, 4 quarter business was more on track, which limited the annual decline to 0.1%, compared with a decrease of 0.7% for the first nine months of the year; - in Poland, the decline for the year was 3.3%, reflecting the downward trend in fixed services and, to a lesser extent, the leveling-off of prepaid mobile services offers; - the Enterprise segment recorded a 2.3% decline (excluding network equipment sales), reflecting the widespread economic slowdown; and - in Central Europe, the 9.7% decline was primarily tied to the deterioration of the economic environment in Romania (-16.7%). On an historical basis, revenues fell 4.7% (including the United Kingdom). More than half of this decline (2.7 points) was from the unfavorable impact of exchange rates, reflecting in particular the depreciation of the Polish zloty (-1.8 points) and the pound sterling (-1.2 points), partially offset by an increase in value of other currencies (+0.3 point). On an historical basis, the change also includes the impact of changes in the scope of consolidation (-0.1 point), in particular the discontinuation of e-commerce operations in France (TopAchat and Alapage).th 4 quarter 2009 Consolidated revenues for the France Telecom group (excluding the United Kingdom) were 11.540 billion euros th in the 4 quarter of 2009, a decrease of 3.3% on a comparable basis and 5.8% on an historical basis. th Including the United Kingdom, consolidated revenues were 12.808 billion euros, a 3.0% decline versus the 4 quarter of 2008 on a comparable basis. Excluding regulatory measures (-364 million euros), the decrease was limited to -0.2%, a 0.7-point improvement compared with the previous quarter (-0.9%). This concerns: th rd - Western Europe, which increased 6.4% in the 4 quarter after gaining 1.7% in the 3 quarter, related to growth in Belgium (sales growth for mobile handsets and improvement in voice services); rd - the United Kingdom with 3.7% growth after a 2.4% decline in the 3 quarter; th rd - Spain, which reported 4 quarter growth of 1.9% after a 0.2% decline in the 3 quarter, due to the increase in the customer base (contract and prepaid) and strong growth in data services; and th rd - Africa and the Middle East, with 4 quarter growth of 6.0% (following 3 quarter growth of 4.8%) reflecting a stronger upturn in Senegal and Côte d’Ivoire, while Egypt, Mali and new operations in Africa continued to climb. th8 Before deconsolidation of companies in the United Kingdom that will be contributed to the joint venture with Deutsche Telekom and which, in the 2009 financial statements, are treated as discontinued operations. 9 New operations in Africa: Kenya, Guinea, Guinea-Bissau, Niger, Central African Republic and Uganda. 10 Western Europe: Belgium, Luxembourg and Switzerland.6In France, operations remained on track with a 2.7% upturn in revenues from mobile services (excluding regulatory measures), driven by growth in the customer base and the development of data services. th The Enterprise segment fell 4.2% in the 4 quarter (excluding equipment sales), which was comparable to the rd 3.9% decline in the 3 quarter. th In Poland, the 6.1% decline in the 4 quarter (excluding regulatory measures) reflected slower growth in ADSL 11 broadband services and the leveling-off of ARPU in mobile services. Central Europe was down substantially (-13.1%, excluding regulatory measures) due to the trend in operations in Romania (-20.5%) and, to a lesser extent, in Slovakia (-5.3%).customer base growthThe Group had 192.7 million customers at 31 December 2009 (excluding MVNOs), with 10.4 million additional customers year on year (net of terminations), an increase of 5.7% compared to 31 December 2008. The number of mobile customers continued to rise reaching 132.6 million customers at 31 December 2009 th (excluding MVNOs), a year-on-year increase of 8.8% or 10.8 million customers (net of terminations). The 4 quarter continued to be very active, with 3.8 million mobile customers added. The MVNO customer base in Europe rose 25% to 4.0 million customers at 31 December 2009 (including 2.4 million customers in France), compared with 3.2 million customers a year earlier (including 1.8 million customers in France). 13 ADSL broadband services continued to grow, reaching 13.5 million customers at 31 December 2009, a year-on-year increase of 4.1%. Broadband usage rose sharply. At 31 December 2009, there were: 3.2 million digital TV (IPTV and satellite) subscribers, a 53% increase in one year; 7.6 million Voice over IP subscribers, a year-on-year increase of 17%; and 8.8 million Livebox subscribers, a 12% increase in one year.12EBITDAfullfull-year 2009 EBITDA (excluding the United Kingdom) was 14.794 billion euros. It included the following non-recurring items, th recognized in the 4 quarter: - an expense of 964 million euros related to the dispute concerning France Telecom’s special corporate tax regime in France prior to 2003; and 15 - a provision of 569 million euros for the establishment of the “part time for seniors” plan . Adjusted for these two items, EBITDA was 16.327 billion euros in 2009, for a restated EBITDA margin of 35.5%, compared with 36.0% in 2008 on a comparable basis. The 0.5-point decline between the two years reflects: - the impact of regulatory measures equal to -392 million euros (excluding the United Kingdom); and - the impact of the telecommunications tax instituted on 7 March 2009 (French audiovisual law) and, as of 1 June 2008, of the Chatel law (for a total impact of -178 million euros). On a comparable basis, the ratios of operating expenses (based on restated EBITDA) to revenues are as follows: - the ratio of labor expenses was 18.6%, a 0.6-point increase compared with 2008 (18.0%); - the ratio of service fees and inter-operator costs was 13.5%, a 0.3-point improvement. The decline in call termination fees (favorable impact of 532 million euros) was partially offset by growth in unlimited off-net mobile services offers; - the ratio of other network expenses and IT expenses was stable at 5.8%;See glossary. Including the United Kingdom Including FTTH, satellite and Wimax services 14 EBITDA: Earnings Before Interest, Taxes, Depreciation and Amortization. See glossary. 15 As part of the agreement concerning personnel close to retirement age signed on 26 November 2009 between France Telecom and its social partners, the “part time for seniors” plan allows employees eligible for retirement within three years to choose part time employment until they retire, without loss of benefits.12 13 11147the ratio of combined property, overhead and other expenses improved 0.2 points to 11.9%. The impact of cost savings programs, lower restructuring costs and increased income from associated companies were partially offset by the impact of the new telecommunications tax and the Chatel law; - before commercial expenses and content purchases, the EBITDA margin was 50.2%, a 0.2-point improvement compared with 2008; and - the ratio of commercial expenses and content purchases (14.7%) was up 0.2 points. The growth in content purchases, in particular for the sports TV and Orange cinema series channels that began operating in the second half of 2008, was offset to a large extent by the decline in commercial expenses linked to the business slowdown.th 4 quarter 2009 Restated EBITDA (excluding the United Kingdom) was 3.674 billion euros, a decrease of only 0.9% compared with the th th 4 quarter of 2008 on a comparable basis. The EBITDA margin for the 4 quarter (31.8%) improved by 0.7 points. This favorable change is related to: 17 th - the impact in 2008 of the impairment of Sonaecom shares, which reduced 4 quarter 2008 EBITDA by 199 million euros; - the effect in 2009 of cost reduction programs, particularly with respect to overheads and IT; and - optimization of commercial expenses and content purchases. These items were partially offset by the impact of regulatory measures (-121 million euros) and new taxes (-49 million euros). th16operating incomeFrance Telecom group’s operating income was 7.859 billion euros in 2009, compared with 9.945 billion euros in 2008 (on an historical basis), a decline of 2.086 billion euros between the two periods. About three-fourths of this decline corresponds to two previously mentioned non-recurring items: - a 964 million euro expense linked to the dispute pertaining to the special corporate tax regime prior to 2003; and - a 569 million euro provision for the establishment of the “part time for seniors” plan in France. Excluding these two items, there was a 553 million euro decrease between the two years, corresponding to the following changes: - a 756 million euro decline in EBITDA, adjusted for non-recurring items (including -272 million from changes in exchange rates); - a 442 million euro decrease in depreciation and amortization, particularly related to a favorable impact from exchange rates of 216 million euros; - a 179 million euro increase in goodwill impairment, mainly related to depreciation in Poland in 2009; and - a 60 million euro increase in impairment of non-current assets.net incomeConsolidated net income after tax for the France Telecom group was 3.465 billion euros in 2009, compared with 4.492 billion euros in 2008, a decrease of 1.027 billion euros. This reflects: - a 2.086 billion euro decrease in operating income; - a 658 million euro improvement in net financial income generated by (i) a 381 million euro expense in 2008 related to the liquidity mechanism, which was tied to the price guarantee given to minority shareholders of FT España and (ii) by the sharp reduction in the cost of net financial debt and a decline in the average cost of debt; - a 604 million euro decrease in corporate tax, related to a reduction in the level of deferred taxes in Spain and France; and - a 203 million euro decline in net income from discontinued operations (United Kingdom).16 17See glossary. Portuguese mobile telephone company.8Net income attributable to non-controlling interests (minority interests) rose to 468 million euros in 2009 from 423 million euros in 2008, an increase of 45 million euros year on year. Net income attributable to equity holders of France Telecom was 2.997 billion euros in 2009, compared with 4.069 billion euros in 2008, a decrease of 1.072 billion euros. In comparable terms, after adjustment for the main non-recurring items, this figure was 4.849 billion euros in 2009, compared with 5.181 billion euros in 2008, a decline of 6.4% (-332 million euros). The main non-recurring items taken into account concern: - a 964 million euro expense linked to the dispute pertaining to the special corporate tax regime prior to 2003; - the establishment of the “part time for seniors” plan in France, with an impact of 367 million euros (net of deferred tax); - the impact of the liquidity arrangement tied to the price guarantee given to the minority shareholders of FT España of 381 million euros in 2008; - certain non-recurring deferred income tax expenses of 181 million euros in 2008; - an impairment of loans granted to certain associates of 35 million euros in 2009; - a provision related to the free shares program of 41 million euros in 2009, compared with 57 million euros in 2008; and - gains on disposals and net income from discontinued operations of 4 million euros in 2009, compared with -11 million euros in 2008.capital expenditure on tangible and intangible assets (CAPEX)fullfull-year 2009 Capital expenditure on tangible and intangible assets (excluding the United Kingdom) were down 17.3% on an historical basis to 5.304 billion euros, including an unfavorable impact of 2.1% from exchange rates. On a comparable basis, and excluding the transaction to purchase operating premises in France in 2008 (163 million euros), CAPEX fell 13.3% while the comparable CAPEX to revenues ratio was 11.5% in 2009 compared with 13.1% in 2008, a decline of 1.6 points year on year. The decline in CAPEX reflects the slowdown in investments related to the expansion of 2G and 3G mobile network capacity and slower growth in fixed broadband services in the European countries. Investment in 3G was nonetheless strong in France, resulting in Orange having the best mobile broadband coverage according to the latest ARCEP report. Similarly, programs to roll out ADSL in Poland were accelerated in 2009. Added to this was increased investment in new operations (network deployment in Uganda and Armenia) and in undersea cables (Africa and Indian Ocean). In addition, CAPEX plans implemented in 2009 focused on sustaining investments related to strengthening transmission networks to support the growth in traffic in fixed and mobile data services (particularly in France and in Poland), to innovation and to new services (particularly content aggregation platforms).th 4 quarter 2009 CAPEX (excluding the United Kingdom) was 1.817 billion euros, 56% more than the quarterly average for the first nine months of the year (1.162 billion euros), reflecting seasonality comparable to that of previous years. Compared th with the 4 quarter of 2008, CAPEX was down 10.7% on a comparable basis (-13.4% on an historical basis) and the CAPEX to revenues rate (15.7%) was down 1.4 points. In addition to continued network deployment in Uganda and Armenia, capital expenditures were particularly focused on France (mobile services) and Poland (fixed and mobile services). thorganic cash flowOrganic cash flow for the Group was 8.350 billion euros in 2009, compared with 8.016 billion euros in 2008, an increase of 334 million euros. The organic cash flow Group share (attributable to equity holders of the Group) was 7.617 billion euros (a 364 million euro increase), whereas cash flow attributable to non-controlling interests (minority interests) was 733 million euros (down 30 million euros). The growth in the Group’s organic cash flow is primarily due to:9。
中国移动王建宙2009ITU世界电信展演讲
中国移动王建宙2009ITU世界电信展演讲时间:2009-10-22 16:10来源:口译网作者:口译网点击:1176次2009年10月5日,ITU世界电信展在瑞士日内瓦拉开帷幕,在开幕式上,中国移动总裁王建宙发表了演讲,以下为讲话全文:中国移动总裁王建宙在2009国际电联世界电信展开幕式上的演讲瑞士日内瓦,2009年10月5日Speech by Mr. Wang Jianzhou, CEO of China Mobile, on ITU Telecom World 20095 Ocotober, 2009, Geneva女士们,先生们:Ladies and Gentlemen:非常荣幸参加2009国际电联(ITU)世界电信展。
我相信此次盛会将会对全球的ICT行业带来巨大的影响,从而推进ICT更好地为推进经济的重新起飞做出贡献,为解决我们面临的全球气候变化的问题做出贡献。
It gives me great honor to participate in ITU Telecom World 2009. I believe this unique gathering will bring huge influence to global ICT sector, and thus promote the sector to make greater contribution in re-boosting economy and dealing with global climate change.今天,ICT已经成为人们生活中必不可少的一个部分,在中国,从偏远的海岛到喜马拉雅山区,最普通的农民也可以借助无线通信网络实时获取包括农产品价格在内各种各样他们所需要的信息。
Today, ICT has already become an indispensable part of people's life. In China, from the remote islands to the Himalayas, even the ordinary farmers can use wireless networks to get the real-time information they need, including prices of agricultural products.国际金融危机并没有阻挡ICT技术前进的步伐。
- 1、下载文档前请自行甄别文档内容的完整性,平台不提供额外的编辑、内容补充、找答案等附加服务。
- 2、"仅部分预览"的文档,不可在线预览部分如存在完整性等问题,可反馈申请退款(可完整预览的文档不适用该条件!)。
- 3、如文档侵犯您的权益,请联系客服反馈,我们会尽快为您处理(人工客服工作时间:9:00-18:30)。
FTTH Worldwide StatusBusiness Model issues & French case TVoverBroadband200922 January 2009, ParisRoland MONTAGNEHead of Broadband Practicer.montagne@+ 33 6 80 85 04 80Agenda►FTTH worldwide Status & Strategy►Leaders: US & Asia►European Situation►FTTN+VDSL vs FTTH: Key parameters –Countries►FTTH Business Model►General Structure of the Model►FTTH CAPEX variables►FTTH French Case►June 2008 Picture►Regulatory & Legislative actions for FTTH►Conclusion –Dynamics for FTTHFTTH: Leaders Status & StrategiesFTTH/B Global Picture: APAC Strong leadershipNearly 83% of Worldwide FTTH/B subscribers at June 2008 are in AsiaIn Asia at June2008, estimated figure for FTTH/B Homes Passed: 64 millions…. to be compared to the nearly 8.8 million in EuropeFTTx subscribers at June 2008Source: IDATE and FTTH Council EuropeJune 2008VDSL FTTH/B subscribersFTTLA subscribersTotal FTTx Europe 741 500 1 332 331na 2 073 831North America 549 000 3 051 000na 3 600 000Asia**na*21 170 000 1 350 00022 520 000Total1 290 50025 553 3311 350 00028 193 831FTTH: Worldwide Status & Strategies: leadersJapan: the FTTH leaderMore new FTTH/B subscribers than new DSL subscribers since April200513.08 Million FTTH/B subscribers at 2Q08and still around 800 000 new FTTHsubscribers each quarter …. Nearly 40% are FTTBAt 2Q08 total Broadband subscribers reached 29.33 Million with DSL counting now less subscribers (12.29 M) than FTTH/BAttractive prices, closing the gap with ADSL tariffs…aerial deploymentsGovernment’s proactive approach to FTTH deployments: 30 Million FTTH subscribers in 2010 as a ambitious initial objective…objective revised in November 2007 at 20 Million FTTH subscribers in 2010But….-A few IPTV subscribers in Japan (less than 250 000)-MIC to force NTT to open up it’s FTTH network at advantage prices for competitors: NTT market shares on FTTH is nearly 73% compared to 37% on DSL !FTTH/B in Japan : CoverageA FTTH/B coverage of 85% of the populationSource: MICHong Kong Broadband Study CaseHK BB will expand his network from 1.4 M Homes Passed today by mainly FTTB to 2 M Homes Passed by 2010 (90% of HK SAR population), deploying also FTTHHK BB as a new entrant in the market decided to launched FTTB to differentiate: “FTTH is the only solution to be more competitive than PCCW”HK BB wants to “inverse”the Digital Divide and his network is targeting mainly residential zones of HK SAR where the density is highHK BB’s objective is to “Commoditize”bandwidth, i.e make its 25-100 Mbps the mass market industry standard for HKTotal investment to build a 1.4 M household FTTB network: 2.5 billions HK$A 1 Gbps offers was launched in April 2005 and is available in all the networkARPU increased over 60% in 18 months, while churn rate reduced to 1%HK BB used perfectly HK SAR demography by deploying FTTB+Cat5e, now FTTH is needed to guaranty future services and keep going to differentiate on the marketHong Kong Broadband Study CaseMaintain “CAPEX level below EBTDA policyHong Kong demography allows EUR 88 per home passed!!Uplink traffic is 3 times of downlink trafficSource: Weekly statistics from HKBNSource: HKBNFTTH: Worldwide Status & Strategies: leadersUSA: FTTH is the unique solution for RBOC’sPower of Cable operators: Time Warner, Comcast, CableVision launching 30 or 50 Mbps offersAt end 2Q08 Verizon has signed 2 million FiOS FTTH subscriber and has nearly1.4 Million FiOS TV subscribersAt end 3Q07 Verizon has passed 8.5 M Homes,By 2010, the FiOS network will have passed 18 million homes, or about half the households Verizon servesAT&T (more FTTN oriented) and Verizon launched Fibre access for delivering HDTV & Triple PlayFioS ARPU of 130 USD –revenue up 53% compared to 1Q08Churn is very low for FiOS TV Subscribers: 1.12%FTTH: Worldwide Status & Strategies: leadersUSA: RBOC’s vs CableOn the last quarters, Cable is recruiting again more new subscribers than RBOC’s …and DOCSIS 3.0 is coming….But consumers like FiOS TV qualityVerizon Customer satisfaction survey –September 2007FTTH: European situationFTTH in Europe -Overview: Global FiguresJune 2008, nearly 1.4 Million FTTH/B subscribers in the EU 31 and around 8.8 Million Homes Passed (Source: IDATE for FTTH Council Europe)A growth of 52% in terms of subscribers and 129% in terms of Homes Passed compared to June 2007 (Source: IDATE for FTTH Council Europe)New FTTH/B subscribers in Europe by countryNew FTTH/B subscribers betw een June 07 and June 08140 000120 000100 00080 00060 00040 00020 000France Norw ay Sw eden Denmark Germany Slovenia Finland Italy Slovakia NetherlandSource: IDATE for FTTH Council EuropeFTTH in Europe: Open Access Model -SwedenSource: IDATEFamilje Bostader: Housing Company in StockholmExemple of Open Network Business Model: FamiljeBostaderCOCom.operatorCO Com.operator SERVICEPROV.SERVICE PROV.HOUSEOWNERTENANT STOKABSTOKAB OPTICAL FIBER NETWORK~7$ /paying customer/month~36 $ /month (SP)For Internet access~21 $ /month (ISP)PRICES INCL. VAT~ 3$ /tenant/monthSource: IDATE -FBFTTH in Europe: key points►The panorama of FTTx deployments in Europe as of June 2008 shows that the FTTH/B market in Europe continues to grow►Especially in terms of Homes Passed(+124%) reaching around 8.8 million►Subscribers shows a +35% growth but are concentrated in 6 countries►Dynamism of countries like France(FTTH/B subscribers x 7 in one year) with the leadership of FFTB + DOCSIS 3 by Numericable►But also Norway, Sweden& Denmark►Dynamic Eastern Europe countries like Slovenia (2 players involved), Slovakia►Major announcements in Greece, Portugal►Nevertheless►With nearly 1.4 million FTTH/B subscribers as of June 2008, Europe is still largely lagging behind the US and Japan (13 million FTTH/B subscribers)►Strong Barriers remains in Europe-Facilitate access to MDU for operators,-Mutualise Civil Engineering costs-The Business Case of FTTH outside Urban and Suburban areas?-“Regulation inertia”FTTH vs VDSL : Key parameters -CountriesFTTx Technology choice in France? Copper Loop►Subscribers’(d’) average distance from SC: 700 to 800 m; 300 m inGermany; 420 m in the UK►Subscribers’(d+d’) average distance from the local exchange:►29% of lines at less than 1 Km ►39% of lines at less than 1.5 Km ►52% of lines at less than 2 KmSource: IDATECopper Local Loop structure in FranceSource: IDATE Street PSTN COcabinetCP (7 to 14 pairs)subscribersdd’12,500 in France120,000 in FranceFTTx Technology choice in France? Copper LoopPerformances of the French copper network►If all the Central Office (CO) are equipped with ADSL2+: 50% of the population eligible at 10 Mbps►If all the CO are equipped with VDSL2: less than 10% of thepopulation eligible at 50 Mbps►If all the Street Cabinet (SC) are equipped with VDSL2: less than20% of the population eligible at 50 Mbps►The SC is not the right place of arrival for Fibre in a VDSLapproach in France; the «Curb»or the «Building»is betterFTTH vs VDSL –Italian VDSL particularitySource: Telecom Italia Average copper loop length boost VDSL potential in ItalyInternational benchmark – Dwelling Type in EuropeIn Europe, countries like Spain, Italy, Germany are well positioned for FTTH It will be more expansive to deploy FTTH in the UK for example21FTTx Business Model22General structure of the modelInterconnection, Backhaul, UnbundlingContent purchasesCAPEX Civil engineering, cable installation Final connections Electronic equipmentRevenue Retail (number of subscriber xARPU)WholesaleOPEX Marketing costs Network operations External purchasesAmortisationOperating profit23FTTH CAPEX Variable: Dwelling-unit typeDensity12001000-30%800600400Civil engineering and cable costsbased on population density for GPON technology (€ per outlet) Source : IDATE200 0 4 000 8 000 10 000 6 00012 00016 00018 00020 00022 000Vertical structures1400 12001000 800 600-30%Civil engineering and cable costsbased on average number of apartments per building for GPON technology (€ per outlet) Source: IDATE400200 0 12 14 18 10 16 20 8 22 24 4 614 00024 00024FTTH French case: picture25FTTH/B deployments and announced plans3 operators et 1 cable operator are involved in FTTH/B deploymentsTotal France as of June 2008: 138 000 FTTH/B subscribers and 3.36 M homes passed26Regulatory and Legislative actions for FTTH in FranceLegislative measures taken for access to buildings and the obligation to share the last part: Law LME since August 2008 ARCEP launched technical work to implement sharing and issued recommendations for landlords and building managers Access to France Telecom’s civil engineering has now entered the operational stage and a first reference offer available since September 2008 The measure will be evaluated beginning of 2009recommendations (guide, model agreement)sharing of the last partmultilateral technical work possible legislative measures publication of an offer2007access to France Telecom’s civil engineering2008operational monitoring of the civil engineering offerreviewexperiments market analysisSource: ARCEP27Conclusions28Conclusion – Dynamics for FTTHCompetitionPlatforms competition Cable vs DSL is a dynamic factor TV players & content providers will play a leading roleGovernments & Regulators roles are essential Maturity of technologiesPON & P2P technologies are deployed: Asia, US, Europe Dynamics/Complexity of the Digital HomeFTTx: ARPU potential & New playersNew players are coming : Housing companies, developers, Civil Engineering companies, Infrastructure companies,… VOD, SVOD, HDTV.. First services to leverage the ARPU… others to be invented … for Residential as well as for SMEs29Conclusion – Challenges for EuropeFTTH/B still limited in Europe compared to Asia Government role will be key: Ultra Broadband National Forum neededTo promote Ultra Broadband (FTTH/B) in the country A National Forum gathering all stakeholders – French exemple has been a successSource: IDATE30Thank You!Roland MONTAGNEHead of Broadband Practicer.montagne@31。