深圳机场:2010年第三季度报告全文 2010-10-27
03章-深圳机场现状解析
第三章机场现状第三章深圳机场现状3.1 机场的基本情况深圳宝安国际机场位于珠江口东岸,广深公路以西、宝安县黄田村和福永村之间的滨海平原上,跑道西侧为珠江海滨,平坦、开阔,东侧为丘陵地带。
1987年5月21日,国务院、中央军委批准新建深圳民用机场;1988年5月成立深圳机场建设领导小组,立即进行勘察设计、飞行区软土地基处理方案及试验等前期工作。
1989年5月20日正式动工,1991年10月12日建成通航。
深圳机场的飞行区场道、通讯、航管、气象、助航灯光及供油等主要保障设施是按国际民航组织要求和我国民用航空机场有关技术标准设计的。
按飞行等级4E标准进行规划和建设,可满足B747-400和同类型飞机的起降要求。
一期工程主要项目规模如下:跑道:长3400m,宽45m站坪面积:11.5万m2机位数:近机位8个(改建后近机位11个)停车场:面积24000 m2,设550个车位航站楼面积:38217 m2(改扩建后面积为74185 m2)航管楼面积:3775 m2气象楼面积:1060 m2通信:设有320门程控交换机供电:设有两路10kv架空供电线路供油:使用油库容量6×5000 m3导航:跑道两端进近方向设有Ⅱ类精密进近仪表着陆系统及相应的助航灯光系统车辆:特种车辆97台码头:1000吨级客货码头一座;5000吨级油码头一座进场道路:3.39km征地:用地面积8632.43亩(含场外用地831.15亩)根据深圳机场的发展需要,航站楼扩建工程于1997年2月21日正式动工,1998年11月建成启用。
作为民航总局、深圳市“九.五”期间重点建设项目,航站楼按满足旅客吞吐量1200万人次的需要进行扩建,并相应完善了站坪、停车场等配套设施。
其主要工程项目规模如下:航站楼:建筑面积72809 m2站坪:道面总面积200756 m2机位数:近机位13个高架桥:7900 m2停车场:34000 m2,停车位650个3.2 机场位置及与城市关系机场位于深圳市宝安区,基准点坐标为:东经113°48′30″,北纬22°38′24″,机场标高为3.72m。
2010年民航机场吞吐量和飞机起降架次统计

10.6 3 1,144,455.7 955,269.7
19.8
40,578,621 31,921,009
27.1 1 3,228,080.8 2,543,393.6
26.9
31,298,812 25,078,548
24.8 5
480,438.1 439,071.9
9.4
26,713,610 24,486,406
17,578.8 13,759.6
202271./84/24
九寨/黄龙
46
汕头/外砂
47
西宁/曹家堡
48
包头/二里半
49
拉萨/贡嘎
50
张家界/荷花
51
延吉/朝阳川
52
榆林/榆阳
53
威海/大水泊
54
鄂尔多斯/伊金霍洛 55
喀什
56
宜昌/三峡
57
义乌
58
北海/福成
59
徐州/观音
60
常州/奔牛
61
运城/张孝
机场
全国合计 北京/首都 广州/白云 上海/浦东 上海/虹桥 深圳/宝安 成都/双流 昆明/巫家坝 西安/咸阳 杭州/萧山 重庆/江北 厦门/高崎 长沙/黄花 南京/禄口 武汉/天河 青岛/流亭 大连/周水子 三亚/凤凰 乌鲁木齐/地窝堡 海口/美兰 郑州/新郑 沈阳/桃仙 天津/滨海 哈尔滨/太平 济南/遥墙 福州/长乐 贵阳/龙洞堡 南宁/吴圩 温州/永强 桂林/两江 太原/武宿 长春/龙嘉 南昌/昌北 宁波/栎社 合肥/骆岗 呼和浩特/白塔 兰州/中川 银川/河东 石家庄/正定 无锡/硕放 烟台/莱山 丽江/三义 北京/南苑 泉州/晋江 西双版纳/嘎洒 珠海/三灶
深圳机场:2009年年度审计报告 2010-03-05
91,701,293.75
8,778,919.72 100,480,213.47 932,816,678.97
1,690,243,200.00 886,986,919.63
280,931,293.75
13,147,514.37 294,078,808.12 756,841,503.92
1,690,243,200.00 901,060,901.06
59,530,761.75 66,771,334.83
230,147,641.11
48,832,493.50 45,819,438.50
655,308,850.74
24,342,695.23 72,932,347.18
4,193,808.65 224,090,980.53
16,469,248.25 59,092,626.09
审计工作涉及实施审计程序,以获取有关财务报表金额和披露的审计证据。选择的审计 程序取决于注册会计师的判断,包括对由于舞弊或错误导致的财务报表重大错报风险的评 估。在进行风险评估时,我们考虑与财务报表编制相关的内部控制,以设计恰当的审计程序, 但目的并非对内部控制的有效性发表意见。审计工作还包括评价管理层选用会计政策的恰当 性和作出会计估计的合理性,以及评价财务报表的总体列报。
655,028,018.38 599,340,749.64
4
保单红利支出 分保费用 营业税金及附加 销售费用 管理费用 财务费用 资产减值损失 加:公允价值变动收益(损失 以“-”号填列) 投资收益(损失以“-”号 填列)
其中:对联营企业和合 营企业的投资收益
汇兑收益(损失以“-”号填 列) 三、营业利润(亏损以“-”号填 列)
中国 深圳
中国注册会计师 中国注册会计师 二〇一〇年三月三日
中兴通讯:2010年第三季度报告正文 2010-10-28

证券代码(A/H):000063/763 证券简称(A/H):中兴通讯 公告编号:201086 债券代码:115003 债券简称:中兴债1ZTE中兴2010年第三季度报告正文中兴通讯股份有限公司ZTE CORPORATION本公告在境内和香港同步刊登。
本公告根据《深圳证券交易所股票上市规则》规定在境内刊登。
本公告乃依据《香港联合交易所有限公司证券上市规则》第13.09条的披露义务而公布。
§1 重要提示1.1中兴通讯股份有限公司(以下简称“本公司”)董事会、监事会及董事、监事、高级管理人员保证本报告所载资料不存在任何虚假记载、误导性陈述或者重大遗漏,并对其内容的真实性、准确性和完整性承担个别及连带责任。
1.2 没有董事、监事、高级管理人员对本季度报告内容的真实性、准确性和完整性无法保证或存在异议。
1.3 本公司第五届董事会第十二次会议已审议通过本季度报告。
副董事长雷凡培先生因工作原因未能出席本次会议,已书面委托董事长侯为贵先生行使董事会会议表决权;副董事长谢伟良先生因工作原因未能出席本次会议,已书面委托董事董联波先生行使董事会会议表决权;董事殷一民先生因工作原因未能出席本次会议,已书面委托董事史立荣先生行使董事会会议表决权;独立董事陈乃蔚先生因工作原因未能出席本次会议,已书面委托独立董事魏炜先生行使董事会会议表决权。
1.4本季度报告中的财务报表未经审计。
本季度报告所载的财务资料乃根据中国企业会计准则编制。
1.5本公司董事长侯为贵先生、财务总监韦在胜先生和会计机构负责人石春茂先生声明:保证本季度报告中财务报告真实、完整。
§2 公司基本情况2.1本集团(即“本公司及其附属公司”)报告期内经营活动总体状况的简要分析2010年1-9月,国内市场方面,光纤宽带网络建设大规模开展,但运营商在移动网络投资上保持谨慎,本集团积极配合运营商各类网络建设需求,继续巩固自身市场份额,同时深化研发,不断探索新的市场机会;国际市场方面,全球电信设备投资开始恢复增长,但印度、欧盟等地区的贸易政策变化对设备商的收入产生了一定的影响,本集团发挥优势,聚焦于客户需求,继续保持销售稳步增长。
农 产 品:第六届董事会第七次会议决议公告 2010-10-30
证券代码:000061 证券简称:农产品 公告编号:2010-23深圳市农产品股份有限公司第六届董事会第七次会议决议公告本公司及董事会全体成员保证信息披露的内容真实、准确、完整,没有虚假记载、误导性陈述或重大遗漏。
深圳市农产品股份有限公司第六届董事会第七次会议于2010年10月28日下午3:30在新办公地点深圳市福田区深南大道7028号时代科技大厦13楼农产品会议室召开。
会议通知于2010年10月26日以书面或电子邮件形式发出。
会议应到董事13人,实到董事9人,独立董事孙雄先生因公未能出席会议,委托独立董事肖幼美女士代为出席并表决;董事万筱宁先生、董事徐国荣先生、董事胡翔海先生因公未能出席会议,均委托董事长陈少群先生代为出席并表决。
公司监事及高级管理人员列席了本次会议。
本次会议的召开符合《公司法》及公司《章程》的规定。
会议由董事长陈少群先生主持,经全体与会董事认真审议并逐项表决,通过以下议案:一、公司2010年第三季度季度报告《2010年第三季度季度报告全文》刊登在巨潮资讯网()上,《2010年第三季度季度报告正文》(公告编号:2010-25)本日刊登在《证券时报》、《中国证券报》、《上海证券报》、《证券日报》上。
同意票数13票,反对票数0票,弃权票数0票。
二、关于增资深圳市农产品交易中心股份有限公司的议案为进一步提升深圳市农产品交易中心股份有限公司(以下简称“交易中心”)的经营能力,经与交易中心另一方股东深圳市海吉星投资管理股份有限公司(以下简称“海吉星投资”)协商,拟同意将原注册资本人民币8,000万元,增至人民币20,000万元,即增加注册资本人民币12,000万元。
本次拟新增股本12,000万股,由股东方按原出资比例,按每股1.00元价格以货币方式认购。
即公司以货币方式出资人民币11,400万元,认购11,400万股;海吉星投资以货币方式出资人民币600万元,认购600万股。
海吉星投资实质为公司全资子公司,交易中心实质亦为公司全资子公司。
深深房B:2010年第三季度报告全文(英文版) 2010-10-29
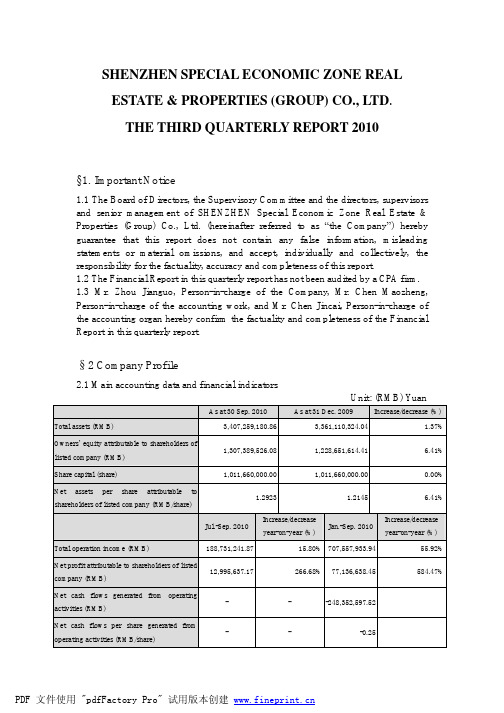
SHENZHEN SPECIAL ECONOMIC ZONE REALESTATE & PROPERTIES (GROUP) CO., LTD.THE THIRD QUARTERLY REPORT 2010§1. Important Notice1.1 The Board of Directors, the Supervisory Committee and the directors, supervisorsand senior management of SHENZHEN Special Economic Zone Real Estate & Properties (Group) Co., Ltd. (hereinafter referred to as “the Company”) hereby guarantee that this report does not contain any false information, misleading statements or material omissions, and accept, individually and collectively, the responsibility for the factuality, accuracy and completeness of this report.1.2 The Financial Report in this quarterly report has not been audited by a CPA firm.1.3 Mr. Zhou Jianguo, Person-in-charge of the Company, Mr. Chen Maozheng,Person-in-charge of the accounting work, and Mr. Chen Jincai, Person-in-charge of the accounting organ hereby confirm the factuality and completeness of the Financial Report in this quarterly report.§2 Company Profile2.1 Main accounting data and financial indicatorsUnit: (RMB) Y uanAs at 30 Sep. 2010 As at 31 Dec. 2009 Increase/decrease (%) Total assets (RMB) 3,407,259,180.86 3,361,110,324.04 1.37% Owners’ equity attributable to shareholders oflisted company (RMB)1,307,389,526.08 1,228,651,614.41 6.41% Share capital (share) 1,011,660,000.00 1,011,660,000.00 0.00% Net assets per share attributable toshareholders of listed company (RMB/share)1.2923 1.2145 6.41%Jul.-Sep. 2010 Increase/decreaseyear-on-year (%)Jan.-Sep. 2010Increase/decreaseyear-on-year (%)Total operation income (RMB) 188,731,241.87 15.80% 707,557,933.94 55.92% Net profit attributable to shareholders of listedcompany (RMB)12,995,637.17 266.68% 77,136,638.45 584.47% Net cash flows generated from operatingactivities (RMB)- - -248,352,597.52Net cash flows per share generated fromoperating activities (RMB/share)- - -0.25Basic earnings per share (RMB/share) 0.0128 265.71% 0.0762 586.49% Diluted earnings per share (RMB/share) 0.0128 265.71% 0.0762 586.49% Weighted average return on net assets (%) 1.00% 0.71% 6.09% 5.16% Weighted average return on net assets afterdeducting extraordinary gains and losses (%)1.00% 0.72% 5.33% 4.89%Items of non-recurring gains and losses Amount from year-begin to theend of this report periodNotesGains and losses from disposal of non-current assets 9,595,497.65Gains and losses from changes in fair value of the held tradablefinancial assets and liabilities, and investment income from disposal oftradable financial assets and liabilities and available-for-sale financialassets, excluding the effective hedging businesses related with thenormal operation of the Company188,148.35Other non-business income and expenses besides the above items 31,144.09Effect on income tax -7,786.00Total 9,807,004.09 -2.2 Total number of shareholders at period-end and shareholding of top tenshareholders holding tradable sharesUnit: share Total number of shareholders at the period-end 98,610Shareholding of top ten shareholders holding tradable sharesFull name of shareholderNumber of tradableshares held at period-endType of shareShenzhen Investment Holdings Co., Ltd. 642,884,262 RMB Ordinary SharesCPI Financial Co., Ltd. 3,336,701 RMB Ordinary Shares Banque Indosuez 1,310,800 RMB Ordinary Shares Wang Zhongming 1,095,408 Domestically listed foreign shares Guan Jinfeng 1,062,220 RMB Ordinary SharesXu Taiying 780,000 RMB Ordinary SharesXue Haoyuan 746,356 RMB Ordinary Shares Zhang Rui 730,700 RMB Ordinary Shares CHU KOON YUK 720,000 Domestically listed foreign shares ICBC-GF China Securities 500 Index SecuritiesInvestment Fund (LOF)678,580 RMB Ordinary Shares§ 3 Significant Events3.1 Particulars about major changes of main accounting statement items and financial indicators, as well as reasons for the changes√Applicable □InapplicableAs at 30 Sep. 2010, total assets of the Company was RMB 3,407,260,000, with an increase of 1.37% compared with RMB 3,361,110,000 at the year-begin, and liabilities totaled RMB 2,112,890,000, with a decrease of 1.52% compared with RMB 2,145,480,000 at the year-begin. Equity (net assets) attributable to shareholders of parent company was RMB 1,307,390,000, with an increase of 6.41% compared with RMB 1,228,650,000. Particulars about large changes in items and reason were as follows:Index of balance sheet: transactional financial assets was RMB 173,500, up by 101.08% compared with RMB 86,300 at the end of last year, mainly because the Company won the lot for new share in transaction; accounts receivable was RMB 27,366,200, up by 85.76% compared with RMB 14,732,400 at the end of last year, mainly because payment payable for constructional engineering and fund from sales of real estate increased; Payment in advance of RMB increased 32.72% compared with RMB 18,020,300 at the end of last year, mainly because payment for engineering in advance increased; short-term borrowing was RMB 14,800,000, down by 85.20% compared with RMB 100,000,000 at the end of last year, which was mainly due to return mature short-term borrowings from bank; Non-current liabilities due within one year was RMB 127,602,900, down by -44.43% compared with 229,607,200 at the end of last year, which was mainly due to return mature long-term borrowings from bank; long-term borrowing was RMB 1,070,218,200, up by 83.89% compared with RMB 581,986,500 at the end of last year, mainly because of new long-term borrowings from bank; accounts payable was RMB 146,875,700, down by -79.91% compared with RMB 730,944,400 at the end of last year, which was mainly because the Company paid the second installment fund for use right of two land in Guangming New District; Payment received in advance was RMB 406,039,600, with an increase of 158.43% compared with RMB 157,116,100 at the end of last year, mainly because the Company received fund for sales of 10th Phase of Jinye Island Project and fund for constructional engineering from Shenzhen Zhentong Engineering Co., Ltd; interest payable was RMB 41,059,800, with an increase of 66.32% compared with RMB 2468.77 at the end of last year, mainly because the Company withdrew interest for borrowings in advance.Index of incomes statement and cash flow statement: operating income was RMB 707557900, with an increase of 55.92% compared with RMB 453788400 at the same period of last year, mainly because income from sales of real estate and engineering increased; operating cost was RMB 469,522,200, with an increase of 36.87% compared with RMB 343,034,500 at the same period of last year, which was mainly due to increase with operating income; business taxes and surcharges were RMB 67,886,700, with an increase of 84.63% compared with RMB 36,768,700 at the same period of last year, which was due to increase with operating income; sales expense was RMB 8,453,800, with an increase of 68.36% compared with RMB 5,021,300 at the same period of last year, mainly because advertising and sales service expenseincreased; financial expense was RMB 453,59,300, with an increase of 181.29% compared with RMB 16,125,400 at the same period of last year, mainly because increase of borrowings caused interest expense increased; investment income was RMB 22,538,300, with an increase of 189.04% compared with RMB 7,797,700 at the same period of last year, which was mainly because income from share transferring and investment income from affiliated and jointed enterprises increased; net profit attributable to owners of parent company totaled RMB 77,136,700, with an increase of 584.47% compared with RMB 11,269,500 at the same period of last year, mainly because operating income increased, gross profit ratio rose and investment income increased; net cash flow from operating activities was RMB -248,352,600, with an increase of 56.10% compared with RMB -565,752,900 at the same period of last year, mainly because cash received from sales of goods and offering labor service increased; net cash flow from investing activities was RMB 10,515,300, with an increase of 39.20% compared with RMB 7,554,200 at the same period of last year, mainly because cash received from investment income increased; net cash flow from financing activities was RMB 261,373,600, with a decrease of 56.67% compared with RMB 603,193,900 at the same period of last year, mainly because cash paid for debt increased;3.2 Progress and influence of significant events, as well as the analysis on solutions 3.2.1 Non-standard audit opinion□Applicable √Inapplicable3.2.2 Whether the Company provided funds to the controlling shareholder or its related parties or provided guarantees to external parties in violation of the prescribed procedures□Applicable √Inapplicable3.2.3 Signing and execution of significant contracts concerning routine operations□Applicable √Inapplicable3.2.4 Others□Applicable √Inapplicable3.3 Fulfillment of commitments made by the Company, shareholders and the actual controller√Applicable □InapplicableCommitment CommitmentmakerContents of commitment ImplementationCommitment made in the share reformShenzhenInvestmentHoldings Co. LtdShenzhen Investment Holding Co., Ltd. madethe following commitments concerning therelevant matters of the share merger reform ofSPG: “①The Company shall abide by therelevant laws, regulations and rules, and fulfillthe legal commitments; ②The Companyhereby declares that: The promisor shallfaithfully fulfill its commitments and shoulderThe commitmentshave been fulfilledcorresponding responsibilities; Unless thetransferee agrees to and is able to fulfill thecommitments, the promisor shall not transferthe held shares. ③The Company herebydeclares that: Should the promisor fail tofulfill its commitments prescribed in therelevant documents, it shall compensate theother shareholders for their losses causedthereupon.”Commitment in the acquisition report orthe report on equity changesNaught Naught NaughtCommitment made in the significant asset reorganizationShenzhenInvestmentHoldings Co. LtdThe Shenzhen Sate-owned Assets Supervisionand Administration Commission issued theLetter on Relevant Matters ConcerningInformation Disclosure of SPG to ShenzhenInvestment Holdings Co., Ltd. in Oct. 2009,making a commitment that it would notconduct transfer of SPG share rights throughagreements, asset reorganization or othermatters (not including shareholding reductionin the secondary market) that have significantinfluence on SPG in the year and the nextyear.The commitmentis currently in theprocess ofexecution.Commitment made in the issuance Naught Naught NaughtOther commitments (includingsupplementary ones)Naught Naught Naught3.4 Warnings of possible losses or major changes of the accumulative net profitachieved during the period from year-begin to the end of the next report periodcompared with the same period of last year, as well as explanation on reasons√Applicable □InapplicablePerformance forecast Significant increase in the same directionFrom the year-begin to the endof the next report periodSame period of last year Increase/decrease (%) Estimatedaccumulative net profit(RMB Ten thousand)8,200.00 -- 8,700.00 2,021.74 Increase 305.59% -- 330.32%Basic earnings pershare (RMB/share)0.0811 -- 0.0860 0.0200 Increase 305.50% -- 330.00% Notes to performanceforecastMainly due to the increase of the real estate and construction project incomes3.5 Other significant events that need to be explained3.5.1 Investments into securities√Applicable □InapplicableUnit: RMB Y uanSerial No. Securities variety Stock codeShort form ofstockInitialinvestmentamount(Yuan)Shares heldat period-end(share)Book value atperiod-endProportion intotalsecuritiesinvestment atperiod-end(%)Gains or lossesin report period1 Stock 002137Sea StarTechnology5,150.00 975 10,773.75 6.21% 5,623.752 Stock 601857 China NationalPetroleum50,100.00 3,000 30,540.00 17.60% -19,560.003 Stock 601866ChinaShippingContainerLines13,240.00 2,000 7,360.00 4.24% -5,880.004 Stock 601898 China CoalEnergy16,830.00 1,000 9,920.00 5.72% -6,910.005 Stock 002440ZhejiangRuntu Co., Ltd31,200.00 1,000 28,520.00 16.44% -2,680.006 Stock 601000 Tangshan Port 16,400.00 2,000 15,060.00 8.68% -1,340.007 Stock 601018 Ningbo Port 22,200.00 6,000 21,300.00 12.28% -900.008 Stock 780377 Subscription ofIndustrialSecurities50,000.00 5,000 50,000.00 28.82% 0.00Other securities investments held at period-end 0.00 - 0.00 0.00% 0.00 Gains/ losses from securities investment sold in reportperiod- - - - 98,033.09 Total 205,120.00 - 173,473.75 100% 66,386.84 Explanation on securities investment:Stocks held by the Company were lottery of new shares, which has been sold incurrent day when benefit.3.5.2 Researches, interviews and visits received in report periodTime PlaceWay ofreceptionVisitorMain discussion and materials provided by theCompany15 Jul. 2010 CompanyOfficeFieldresearchDonghai Securities andGuodu SecuritiesA general visit, with no written materialsbeing provided by the Company28 Jul. 2010 CompanyOfficeBy phone Individual investorInquiring reasons for the Company’s stockprice fluctuations, with no written materialsbeing provided by the Company13 Aug. 2010 CompanyOfficeBy phone Individual investorInquiring the time for disclosure of theCompany’s semi-annual report, with nowritten materials being provided by theCompany30 Aug. 2010 CompanyOfficeBy phone Individual investorInquiring about the Company’s semi-annualreport, with no written materials beingprovided by the Company8 Sept. 2010 CompanyOfficeBy phone Individual investorInquiring about the Company’s projectdevelopment and the sales situation, with nowritten materials being provided by theCompany19 Sept. 2010 CompanyOfficeBy phone Individual investorInquiring about the Company’s projectdevelopment plans, with no written materialsbeing provided by the Company29 Sept. 2010 CompanyOfficeBy phone Individual investorInquiring the Company’s operations and itsopinion on the government’s macro-controlmeasures, with no written materials beingprovided by the Company3.6 Investments into derivatives□Applicable √Inapplicable3.6.1 Positions of derivatives investments held at period-end□Applicable √Inapplicable§ 4 Attachments4.1 Balance sheetPrepared by: SHENZHEN Special Economic Zone Real Estate & Properties (Group) Co., LtdAs at 30 Sept. 2010 Unit: (RMB) YuanClosing balance Opening balance ItemsConsolidation Parent company Consolidation Parent company Current assets:Monetary fund 409,288,416.91 73,513,808.35 386,102,533.51 73,508,120.37 Settlement fundLending to the bank andother institutionsTransaction financial assets 173,473.75 173,473.75 86,269.75 86,269.75 Notes receivableAccounts paid in advance 27,366,181.63 16,235,838.23 14,732,395.84 6,109,646.72 Prepayments 23,916,105.79 662,400.00 18,020,338.85Premium receivableReceivable from reinsuranceReinsurance contract reservereceivablesInterest receivableDividend receivableOther receivables 40,843,809.48 279,287,956.75 49,298,258.09 469,851,675.39 Financial assets purchasedunder agreements to resellInventory 2,173,985,693.15 1,396,794,665.21 2,088,298,946.63 1,414,914,758.68 Non-current assets duewithin 1 yearOther current assetsTotal current assets 2,675,573,680.71 1,766,668,142.29 2,556,538,742.67 1,964,470,470.91 Non-current assets:Loans advancesAvailable-for-sale financialassetsHeld-to-maturity investmentLong-term accountreceivablesLong-term equity investment 108,659,053.80 299,358,529.15 111,305,288.02 302,004,763.37 Investment property 536,499,293.58 468,944,832.81 604,153,453.42 534,718,105.50 Fixed assets 63,842,959.56 37,710,338.46 66,283,427.82 39,439,456.90 Construction in progress 150,000.00Engineering materialsDisposal of fixed assetsProduction biological assetsOil-air assetsIntangible assets 6,058,995.00 6,232,380.00Development expensesGoodwillLong-term deferred expenses 243,067.80 364,901.70Deferred income tax assets 16,232,130.41 95,455.46 16,232,130.41 95,455.46 Other non-current assetsTotal non-current assets 731,685,500.15 806,109,155.88 804,571,581.37 876,257,781.23Total assets 3,407,259,180.86 2,572,777,298.17 3,361,110,324.04 2,840,728,252.14Current liabilities:Short-term borrowing 14,800,000.00 100,000,000.00 100,000,000.00Borrowing from central bankDeposits received and heldfor othersInter-bank borrowingsTransaction financial liabilityNotes payableAccounts payable 146,875,671.15 20,722,187.73 730,944,352.56 621,374,407.44Advances from customers 406,039,630.00 7,530,925.60 157,116,052.15 10,696,023.60Financial assets sold underagreements to repurchaseHandling charges andcommissions receivablePaid for and to employees 16,919,147.23 5,024,719.83 24,499,493.75 9,066,342.19Taxes payable -12,371,432.34 3,068,546.58 -8,782,763.56 2,915,204.83Interest payable 41,059,804.98 41,059,804.98 24,687,711.65 24,687,711.65Dividend payableOther payables 292,165,142.08 380,108,483.29 297,237,215.73 383,176,088.95Accounts due to reinsuranceInsurance contract reservesReceiving from vicariouslytraded securitiesReceiving from vicariouslysold securitiesNon-current liabilities due127,602,898.26 127,602,898.26 229,607,155.48 206,407,155.48 within 1 yearOther current liabilitiesTotal current liabilities1,033,090,861.36 585,117,566.27 1,555,309,217.76 1,358,322,934.14Non-current liabilitiesLong-term borrowings 1,070,218,158.75 770,218,158.75 581,986,531.34 281,986,531.34Bonds payableLong-term payables 9,583,606.76 8,185,932.62Special payablesEstimated liabilitiesDeferred tax liabilitiesOther non-current liabilitiesTotal non-current liabilities 1,079,801,765.51 770,218,158.75 590,172,463.96 281,986,531.34Total liabilities 2,112,892,626.87 1,355,335,725.02 2,145,481,681.72 1,640,309,465.48Owners’ equity(or shareholders’equity)Paid-in capital (or share1,011,660,000.00 1,011,660,000.00 1,011,660,000.00 1,011,660,000.00 capital)Capital surplus 978,244,858.10 978,244,858.10 978,244,858.10 978,244,858.10Less: treasury stockSpecific reservesSurplus reserves 4,974,391.15 4,974,391.15General risk provisionRetained earnings -704,221,140.41 -772,463,284.95 -781,357,778.86 -789,486,071.44Foreign exchange difference 16,731,417.24 15,130,144.02Total owners’ equity1,307,389,526.08 1,217,441,573.15 1,228,651,614.41 1,200,418,786.66 attributable to holding companyMinority interest -13,022,972.09 -13,022,972.09Total owners’ equity 1,294,366,553.99 1,217,441,573.15 1,215,628,642.32 1,200,418,786.66Total liabilities and owners’3,407,259,180.86 2,572,777,298.17 3,361,110,324.04 2,840,728,252.14 equity4.2 Income Statement as of this report periodPrepared by: SHENZHEN Special Economic Zone Real Estate & Properties (Group) Co., LtdJul.-Sept. 2010 Unit: (RMB) YuanAmount of current period Amount of last period ItemsConsolidation Parent company Consolidation Parent companyI. Total operating revenue 188,731,241.87 61,081,444.24 162,976,794.33 25,134,528.39 Including: Sales income 188,731,241.87 61,081,444.24 162,976,794.33 25,134,528.39 Interest incomePremium incomeHandling charges andcommissions incomeII. Total operating cost 175,354,012.11 51,362,184.33 157,549,746.90 31,988,200.30Including: Operating cost 131,036,208.52 23,311,539.09 124,533,653.90 17,476,721.60Interest costService charges andcommission expensesPayments on surrendersClaim expenses-netProvision for insurancecontract reserve-netPolicyholder dividendsReinsurance expensesBusiness taxes and surcharges 12,274,668.51 7,045,135.09 11,983,042.32 3,524,990.34Selling expenses 3,260,686.82 17,828.60 1,132,805.14 353,263.06Administrative expenses 15,004,833.40 5,751,782.46 13,556,886.52 6,206,981.10Financial expenses 13,777,614.86 15,235,899.09 6,343,359.02 4,426,244.20Impairment loss 0.00 0.00Add: gain/loss from changes in-2,190.25 -2,190.25 -37,320.90 -37,320.90 fair value (“-” for loss)Gain/loss from investment98,280.43 98,280.43 105,396.59 105,396.59 (“-” for loss)Including: investmentgain from associates and jointventuresGain/loss from foreignexchange difference (“-” forloss)III. Operation profit (“-” for13,473,319.94 9,815,350.09 5,495,123.12 -6,785,596.22 loss)Add: non-operating incomes 18,246.37 85,842.71 71,597.38Less: non-operating expenses 50,644.27 24,178.76 19,000.20Including: loss from disposal26,700.50of non-current assetsIV. Total profit (“-” for total13,440,922.04 9,815,350.09 5,556,787.07 -6,732,999.04 loss)Less: income tax expenses 445,284.87 2,015,810.32V. Net profit (“-” for total loss) 12,995,637.17 9,815,350.09 3,540,976.75 -6,732,999.04Attributable to owners of12,995,637.17 9,815,350.09 3,544,156.91 -6,732,999.04 parent companyMinority interest -3,180.16VI. Earnings per share(1) Basic EPS 0.0128 0.0035(2) Diluted EPS 0.0128 0.0035VII. Other composite income 1,578,632.76 0.00 0.00 0.00VIII. Total composite income 14,574,269.93 9,815,350.09 3,540,976.75 -6,732,999.04Attributable to owners of14,574,269.93 9,815,350.09 3,544,156.91 -6,732,999.04 parent companyAttributable to minority-3,180.16shareholders4.3 Income statement as of the period from year-begin to the end of report period Prepared by: SHENZHEN Special Economic Zone Real Estate & Properties (Group) Co., LtdJan.-Sept. 2010 Unit: (RMB) YuanAmount of current period Amount of last period ItemsConsolidation Parent company Consolidation Parent companyI. Total operating revenue 707,557,933.94 217,122,116.69 453,788,395.82 81,089,507.31Including: Sales income 707,557,933.94 217,122,116.69 453,788,395.82 81,089,507.31Interest incomePremium incomeHandling charges andcommissions incomeII. Total operating cost 638,488,579.52 210,014,948.60 444,165,289.78 94,251,808.24Including: Operating cost 469,522,178.86 95,799,802.08 343,034,458.71 49,056,721.96Interest costService charges andcommission expensesPayments on surrendersClaim expenses-netProvision for insurance contractreserve-netPolicyholder dividendsReinsurance expensesBusiness taxes and surcharges 67,886,702.53 42,835,653.97 36,768,652.67 12,755,582.07Selling expenses 8,453,754.26 670,339.21 5,021,276.68 1,271,160.14Administrative expenses 47,266,606.44 22,856,606.52 43,215,455.63 19,211,313.77Financial expenses 45,359,337.43 47,852,546.82 16,125,446.09 11,957,030.30Impairment lossAdd: gain/loss from changes in-26,976.00 -26,976.00 96,515.50 96,515.50 fair value (“-” for loss)Gain/loss from investment22,538,341.32 9,851,732.00 7,797,741.73 113,929.17 (“-” for loss)Including: investment gain12,586,609.32 7,683,812.56from associates and joint venturesGain/loss from foreignexchange difference (“-” forloss)III. Operation profit (“-” for91,580,719.74 16,931,924.09 17,517,363.27 -12,951,856.26 loss)Add: non-operating incomes 141,546.09 90,862.40 116,767.80 71,597.38Less: non-operating expenses 151,512.00 110,029.80 20,319.04Including: loss from disposal41,110.00 48,532.00of non-current assetsIV. Total profit (“-” for total91,570,753.83 17,022,786.49 17,524,101.27 -12,900,577.92 loss)Less: income tax expenses 14,434,115.38 6,283,445.88 21,061.72V. Net profit (“-” for total loss) 77,136,638.45 17,022,786.49 11,240,655.39 -12,921,639.64Attributable to owners of parent77,136,638.45 17,022,786.49 11,269,480.88 -12,921,639.64 companyMinority interest -28,825.49VI. Earnings per share(1) Basic EPS 0.0762 0.0111(2) Diluted EPS 0.0762 0.0111VII. Other composite income 1,601,273.22 0.00 0.00VIII. Total composite income 78,737,911.67 17,022,786.49 11,240,655.39 -12,921,639.64Attributable to owners of parent78,737,911.67 17,022,786.49 11,269,480.88 -12,921,639.64 companyAttributable to minority-28,825.49shareholders4.4 Cash flow statement as of the period from year-begin to the end of report periodPrepared by: SHENZHEN Special Economic Zone Real Estate & Properties (Group) Co., LtdJan.-Sept. 2010 Unit: (RMB) YuanThis period Last periodItemsConsolidation Parent company Consolidation Parent companyI. Cash flow arising in operating activitiesCash received from sales of goods and880,715,940.54 195,182,777.95 446,290,801.67 80,082,392.42 rendering of servicesNet increase in deposit from customersand due from other institutionsNet increase in borrowings received fromcentral bankNet increase in loans from other financialunitsCash received from premium of originalinsurance contractNet cash received from reinsuranceNet increase in deposit from customersand investmentsNet increase in disposal of transactionfinancial assetsCash received from interests, handlingcharges and commissionsNet increase in inter-bank borrowed fundsNet increase in cash received underrepurchasingRefunds on taxOther cash received from operating106,513,588.23 373,609,186.81 64,759,641.88 150,688,813.42 activitiesSub-total of cash inflow from operating987,229,528.77 568,791,964.76 511,050,443.55 230,771,205.84 activitiesCash paid for purchase of goods and986,625,409.46 603,774,638.23 857,994,695.15 612,564,250.28 acceptation of serviceNet increase in loans and advancesNet increase of deposits in central bank,banks and other financial institutionsCash paid for premium of originalinsurance contractCash paid for interest, handling chargesand commissionsCash paid for policy dividendsCash paid for and to employees 67,214,608.81 24,530,630.50 53,348,347.33 13,949,022.96 Various taxes 78,459,202.03 37,386,809.63 56,937,589.03 15,205,421.44 Other cash paid for relating operatingactivities103,282,905.99 196,988,879.82 108,522,748.78 104,641,656.41Sub-total cash outflows in operating activities 1,235,582,126.29862,680,958.181,076,803,380.29746,360,351.09Net cash flow arising in operatingactivities-248,352,597.52 -293,888,993.42 -565,752,936.74 -515,589,145.25 II. Cash flow in investing activitiesCash received from return of investments 2,553,452.35 2,553,452.35 212,325.00 212,325.00 Cash received from investment income 10,151,732.00 10,051,732.00 7,797,741.73 113,929.17 Net cash received from disposal of fixedassets, intangible assets and other long-termassets41,110.00Net cash received from disposal ofsubsidiaries and other operating unitsOther cash received relating to investingactivitiesSub-total of cash inflows of investingactivities12,746,294.35 12,605,184.35 8,010,066.73 326,254.17 Cash paid for acquiring fixed assets,intangible assets and other long-term assets2,071,731.60 773,674.60 455,882.43 138,902.54 Cash paid for acquiring investments 159,240.00 159,240.00Net increase of pledge loansNet cash paid for acquisition ofsubsidiaries and other operating unitsOther cash paid to relating investingactivitiesSub-total of cash outflows of investingactivities2,230,971.60 932,914.60 455,882.43 138,902.54 Net cash flow from investingactivities10,515,322.75 11,672,269.75 7,554,184.30 187,351.63 III. Cash flows of financing activitiesCash received from absorbinginvestmentsIncluding: Cash received from minorityshareholders of subsidiariesCash received from borrowings 664,800,000.00 650,000,000.00 750,000,000.00 450,000,000.00。
ST零七:2010年第三季度报告全文 2010-10-27
深圳市零七股份有限公司2010年第三季度季度报告全文§1重要提示1.1本公司董事会、监事会及董事、监事、高级管理人员保证本报告所载资料不存在任何虚假记载、误导性陈述或者重大遗漏,并对其内容的真实性、准确性和完整性负个别及连带责任。
1.2公司第三季度财务报告未经会计师事务所审计。
1.3公司负责人练卫飞、主管会计工作负责人赵谦及会计机构负责人(会计主管人员)魏翔声明:保证季度报告中财务报告的真实、完整。
§2公司基本情况2.1主要会计数据及财务指标2.2报告期末股东总人数及前十名无限售条件股东持股情况表§3重要事项公司主要会计报表项目、、财务指标大幅度变动的情况及原因3.1公司主要会计报表项目√适用□不适用1、货币资金比上年度期末减少77.64%,为本期动用大部分资金偿还中国银行逾期贷款;2、预付账款比上年度期末减少95.69%,为本期厦门酒店公司结转预付采购金;3、其他应收款比上年度期末减少56.4%,为本期厦门酒店公司收回预付天下福公司工程款;4、短期借款比上年度末减少75.58%,为本期偿还中国银行逾期贷款本金;5、应付账款比上年度末减少37.81%,为本期支付采购原材料款;6、其他应付款比上年度末增加105.66%,为本期向关联方借款偿还逾期贷款;7、少数股东权益比上年度末减少163.62%,因本期无固定资产处置收益,本期所属子公司业绩下降;8、财务费用较上年同期下降35.95%,公司偿还了部分债务,本期利息费用降低;9、资产减值损失较上年同期下降549.66%,为本期厦门酒店公司收回其他应收款,转回已计提坏账准备;10、营业外收入较上年同期下降99.45%,为上年同期处置较多固定资产产生收益;11、利润总额较上年同期下降95.67%,为本期因没有处置固定资产收益,利润下降;12、净利润较上年同期下降97.69%,为本期因无处置固定资产收益,净利润下降;13、少数股东损益叫上年同期下降277.69%,为本期无固定资产处置收益,公司所属子公司业绩下降;3.2重大事项进展情况及其影响和解决方案的分析说明3.2.1非标意见情况√适用□不适用1、最近一期财务会计报告被注册会计师出具非标准无保留审计意见,且相关审计意见所涉事项在前次定期报告披露时尚未解决的,应当在此处说明2010年第三季度对相关事项的解决情况。
S轮机舱爆炸事故调查报告-中华人民共和国深圳海事局
MAIR140000201001深圳“1·6”S轮机舱爆炸事故调查报告一、事故概况及调查情况(一)事故概况2010年1月6日11:55时,靠泊在深圳港蛇口客运码头14#泊位进行船舶维修作业的港作拖轮S轮发生爆炸,造成机舱天窗损坏、船员生活区防火门、左舷干隔舱透气口、污水闸阀损坏;1人被气浪掀向岸壁撞击后溺水死亡,5人被烧伤;直接经济损失约人民币1万元。
事故发生后,在深圳海上搜救分中心的协调指挥下,在深圳海事局、南海救助局、深圳南山消防大队、深圳蛇口港公安局等单位和S轮船员的共同努力下,两名落水人员被先后救起,S轮轮机舱火势被控制。
经调查,爆炸的直接原因是S轮机舱内维修作业人员缺乏安全意识、违反船舶安全作业规程进行烧焊引起油气爆燃。
事故的间接原因包括:事故船S轮值班船员没有认真履行值班职责;施工作业单位深圳市***船舶服务有限公司与深圳市莫森机电设备有限公司没有认真落实安全责任制,对公司维修人员缺少必要的安全知识培训,对船舶维修作业活动缺少监督管理;生产经营单位深圳**有限公司缺乏对所属船舶靠泊修船期间的岸基安全管理,对船舶重大维修事项缺少安全监督;事发泊位的业主单位蛇口招港客运实业有限公司对事发泊位的营运缺乏安全管理。
(二)事故调查情况1、调查组见附件2、调查情况事发后,调查组先后三次登轮对事故现场进行勘查,提取了与事故有关的文书资料,对13名事故相关人员制作询问笔录14份;蛇口港公安局提供对事故中被烧伤的4名人员询问笔录4份;南海救助局深圳救助站提供救助报告1份。
二、事故船舶、船员和公司有关情况(一)S轮轮基本情况1、船舶资料图1S轮于2005年3月下水投入营运,主要作业水域为深圳港蛇口港区、SCT码头、一湾码头及珠江口附近海域。
经核查,S轮所持船舶证书齐全,且均在有效期内。
2、船舶检验情况S轮由江苏省镇江船厂有限责任公司建造,于2005年2月建造完成,中国船级社镇江国内船舶检验中心于2005年2月18日对其进行了检验发证(证书编号:2004ZH4000,船检登记号2005Q0000050)。
腾讯2010年第三季度财报
即时发布腾讯公布2010年第三季度业绩香港,2010年11月10日–中国领先的互联网服务和移动及电信增值服务供应商–腾讯控股有限公司(“腾讯”或“本公司”,香港联交所股票编号: 00700)今天公布截至2010年9月30日未经审计的第三季度综合业绩。
2010年第三季度业绩摘要:§总收入为人民币52.266亿元(7.800亿美元1),比上一季度增长11.9%,比去年同期增长55.1%。
§互联网增值服务收入为人民币41.290亿元(6.162亿美元),比上一季度增长15.3%,比去年同期增长57.4%。
§移动及电信增值服务收入为人民币6.951亿元(1.037亿美元),比上一季度增长3.1%,比去年同期增长55.8%。
§网络广告业务收入为人民币3.825亿元(5,710万美元),比上一季度下降3.8%,比去年同期增长30.3%。
§毛利为人民币35.501亿元(5.298亿美元),比上一季度增长11.4%,比去年同期增长51.4%。
毛利率由上一季度的68.2%降至67.9%。
§经营盈利为人民币26.659亿元(3.978亿美元),比上一季度增长12.4%,比去年同期增长58.7%。
经营盈利率由上一季度的50.8%升至51.0%。
§期内盈利为人民币21.683亿元(3.236亿美元),比上一季度增长12.3%,比去年同期增长51.3%。
净利率由上一季度的41.4%升至41.5%。
§本公司权益持有人应占盈利为人民币21.531亿元(3.213亿美元),比上一季度增长12.3%,比去年同期增长51.6%。
§主要平台数据:- 即时通信服务活跃帐户数达到6.366亿,比上一季度增长3.9%。
- 即时通信服务最高同时在线帐户数达到1.187亿,比上一季度增长8.5%。
- “QQ空间”活跃帐户数达到4.812亿,比上一季度增长5.0%。
发展战略-深发展A:XXXX年第三季度报告全文 XXXX-10-28
证券代码:000001 证券简称:深发展A 公告编号:2010-054深圳发展银行股份有限公司2010年第三季度报告§1 重要提示本行董事会、监事会及董事、监事、高级管理人员保证本报告所载资料不存在任何虚假记载、误导性陈述或者重大遗漏,并对其内容的真实性、准确性和完整性承担个别及连带责任。
本行第七届董事会第30次会议审议了本行2010年第三季度报告。
本次董事会会议实到董事12人。
董事姚波、叶素兰、李敬和、王开国、胡跃飞因事无法亲自参加会议,其中董事姚波、叶素兰、胡跃飞分别委托董事罗世礼、陈伟、理查德•杰克逊行使表决权,董事李敬和、王开国委托董事长肖遂宁行使表决权。
本行董事会会议一致同意此报告。
本行董事长肖遂宁、行长理查德·杰克逊、副行长兼首席财务官陈伟、会计机构负责人李伟权保证季度报告中财务报告的真实、完整。
本行本季度财务报告未经正式审计,但安永华明会计师事务所对个别项目及财务报表编制流程执行了商定程序。
§2 公司基本情况2.1 主要会计数据及财务指标 (货币单位:人民币千元)本报告期末上年度期末本报告期末比上年度期末增减(%)总资产 675,063,878587,811,03414.84%所有者权益(或股东权益) 32,144,13520,469,60957.03%股本 3,485,0143,105,43412.22%每股净资产(元) 9.22 6.5939.91%年初至报告期期末比上年同期增减(%)经营活动产生的现金流量净额10,579,7924203.35%每股经营活动产生的现金流量净额(元)3.043,900.00%报告期年初至报告期期末上年同期本报告期比上年同期增减(%)营业收入 4,663,52913,159,6393,623,10328.72%净利润 1,700,8214,733,9401,326,03128.26%基本每股收益(元) 0.49 1.460.4313.95%稀释每股收益(元) 0.49 1.460.4313.95%扣除非经常性损益后的基0.48 1.440.4214.29%本每股收益(元)平均资产利润率(未年化) 0.26%0.75%0.24%+0.02个百分点全面摊薄净资产收益率(未5.29%14.73%6.95%-1.66个百分点年化)平均净资产收益率(未年5.44%18.83%7.11%-1.67个百分点化)扣除非经常性损益后的净5.37%18.55%6.89%-1.52个百分点资产收益率(未年化)非经常性损益项目年初至报告期期末金额非流动性资产处置损益 82,412或有事项产生的损失 (87)投资性房地产公允价值变12,116动收益除上述各项以外的其他营4,768业外收入和支出以上调整对所得税的影响 (21,114)合计78,095注.:非经常性损益根据《中国证券监督管理委员会公告2008年第43号—公开发行证券的公司信息披露解释性公告第1号--非经常性损益》的定义计算。
- 1、下载文档前请自行甄别文档内容的完整性,平台不提供额外的编辑、内容补充、找答案等附加服务。
- 2、"仅部分预览"的文档,不可在线预览部分如存在完整性等问题,可反馈申请退款(可完整预览的文档不适用该条件!)。
- 3、如文档侵犯您的权益,请联系客服反馈,我们会尽快为您处理(人工客服工作时间:9:00-18:30)。
深圳市机场股份有限公司2010年第三季度季度报告全文§1 重要提示1.1 本公司董事会、监事会及董事、监事、高级管理人员保证本报告所载资料不存在任何虚假记载、误导性陈述或者重大遗漏,并对其内容的真实性、准确性和完整性负个别及连带责任。
1.2 公司第三季度财务报告未经会计师事务所审计。
1.3 公司负责人汪洋、主管会计工作负责人陈金祖及会计机构负责人(会计主管人员)史晓梅声明:保证季度报告中财务报告的真实、完整。
§2 公司基本情况2.1 主要会计数据及财务指标单位:元2010.9.30 2009.12.31 增减幅度(%)总资产(元)6,329,164,741.54 5,790,766,696.75 9.30% 归属于上市公司股东的所有者权益(元)5,655,687,309.91 5,167,702,590.64 9.44% 股本(股)1,690,243,200.00 1,690,243,200.00 0.00%归属于上市公司股东的每股净资产(元/股)3.35 3.06 9.48%2010年7-9月比上年同期增减(%)2010年1-9月比上年同期增减(%)营业总收入(元)473,672,239.09 9.83% 1,398,698,466.52 14.08% 归属于上市公司股东的净利润(元)171,895,406.69 2.21% 538,373,631.27 19.22% 经营活动产生的现金流量净额(元)- - 632,776,491.15 99.22% 每股经营活动产生的现金流量净额(元/股)- - 0.3744 99.22% 基本每股收益(元/股)0.1017 2.21% 0.3185 19.20% 稀释每股收益(元/股)0.1017 2.21% 0.3185 19.20% 加权平均净资产收益率(%) 3.04% -0.32% 9.52% 0.49% 扣除非经常性损益后的加权平均净资产收益率(%)3.03% -0.28% 9.33% 0.46%非经常性损益项目年初至报告期末金额附注非流动资产处置损益-110,514.79计入当期损益的政府补助,但与公司正常经营业务密切相关,符合国家政策规定、按照一定标准定额或定量持续享受的政府补助除外2,563,345.41与公司正常经营业务无关的或有事项产生的损益9,430,176.39 主要系根据浦发银行贷款合同案判决书,调整以前年度计提的贷款利息。
除上述各项之外的其他营业外收入和支出-418,981.76 所得税影响额-593,746.75少数股东权益影响额-29,458.65合计10,840,819.85 -2.2 报告期末股东总人数及前十名无限售条件股东持股情况表单位:股报告期末股东总数(户)131,103前十名无限售条件流通股股东持股情况股东名称(全称)期末持有无限售条件流通股的数量种类中国建设银行-长城品牌优选股票型证券投资基金33,231,904 人民币普通股中国再保险(集团)股份有限公司-传统-普通保险产品11,910,106 人民币普通股瑞银环球资产管理(新加坡)-瑞银卢森堡机构SICA VII中国A股6,529,335 境内上市外资股中国银行-嘉实沪深300指数证券投资基金4,280,231 人民币普通股中国银行-嘉实稳健开放式证券投资基金3,999,912 人民币普通股TEMASEK FULLERTON ALPHA PTE LTD 2,999,977 境内上市外资股中国工商银行-华夏沪深300指数证券投资基金2,968,750 人民币普通股全国社保基金一一一组合2,659,000 人民币普通股三星投资信托运用株式会社-QFII母基金2,600,000 境内上市外资股中国工商银行-金泰证券投资基金2,062,285 人民币普通股§3 重要事项3.1 公司主要会计报表项目、财务指标大幅度变动的情况及原因□适用√不适用3.2 重大事项进展情况及其影响和解决方案的分析说明3.2.1 非标意见情况□适用√不适用3.2.2 公司存在向控股股东或其关联方提供资金、违反规定程序对外提供担保的情况□适用√不适用3.2.3 日常经营重大合同的签署和履行情况□适用√不适用3.2.4 其他√适用□不适用一、重大诉讼、仲裁事项(一)关于兴业银行广州分行起诉公司的借款合同纠纷案2009年3月2日,我公司收到最高人民法院对兴业银行广州分行起诉我公司借款合同纠纷案的二审判决。
依据最高人民法院的判决,2009年上半年,我公司已向兴业银行广州分行支付诉讼案全部本金19,250万元。
3.3 公司、股东及实际控制人承诺事项履行情况√适用□不适用承诺事项承诺人承诺内容履行情况股改承诺深圳市机场(集团)有限公司未来机场扩建时,配套的机场候机楼将由深圳机场独家建设经营。
承诺正在履行之中,未达承诺履行条件。
收购报告书或权益变动报告书中所作承诺无无无重大资产重组时所作承诺深圳市机场(集团)有限公司公司截至本次发行股份购买资产交割日前的可分配利润,由公司股东按照本次发行完成前的股权比例享有;本次发行股份购买资产交割日后的可分配利润,由公司股东按照本次发行完成后的股权比例共同享有。
购买资产交割日所在会计年度结束后,公司将聘请注册会计师对截至购买资产交割日的可分配利润数据进行专项审计,公司董事会将拟订截至发行股份购买资产交割日的全部可分配利润的分配预案并提交股东大会表决,机场集团承诺将在股东大会审议该利润分配议案时投赞成票。
承诺履行中,董事会依据本承诺制定并实施了公司2008年度和2009年度的利润分配方案。
发行时所作承诺深圳机场(集团)公司1997年8月8日,深圳机场(集团)公司向深圳市机场股份有限公司(筹)出具如下《承诺函》:致:深圳市机场股份有限公司(筹):作为深圳市机场股份有限公司(以下称股份公司)的控股股东,深圳机场(集团)公司(以下称本公司)不可撤销地承诺如下:1、在股份公司依法设立后,对于本公司计划发展的各有关开发、建设及经营项目,除非法律、法规另有规定,股份公司具有第一优先选择权。
2、在股份公司依法设立后,本公司将确保受本公司控制的子企业或关联企业不会从事与股份公司构成实质性竞争的业务。
3、在股份公司依法报告期内,深圳市机场(集团)有限公司严格履行了本承诺。
设立后,若有需要,本公司将会同有关部门协助股份公司办妥其开发、建设、经营有关项目所必需的所有手续。
4、在股份公司依法设立后,本公司将会同股份公司办妥根据资产重组而纳入股份公司的所有土地使用权及楼宇的房地产证,由此而产生的任何税费由本公司负担(法律、法规另有规定的除外)。
5、在股份公司依法设立后,本公司将会同股份公司及有关方面办妥根据资产重组而纳入股份公司的各类资产的利益的权属转移事宜。
6、在股份公司依法设立后,将与股份公司正式签署其内容和格式与股份公司筹委会所预签的一致的综合服务协议、《深圳机场航站楼扩建工程总承包合同》的补充合同、广告经营协议、土地使用权出租合同等关联交易协议,并向股份公司提交各项约定的承诺书或承诺函。
7、在本公司的权力所及范围内,并在不与法律、法规相抵触的前提下,本公司将全力支持股份公司的未来发展。
8、本公司谨此确认:除非法律另有规定,自本函出具之日,本函及本函项下之承诺是不可撤销的。
如法律另有规定造成上述承诺的某些部分无效或不可执行时,不影响本公司在本函项下之其他承诺。
特此承诺。
其他承诺(含追加承诺)深圳市机场(集团)有限公司由于深圳市土地相关政策的变化及深圳机场在建设过程中沉积的历史问题较多,导致我公司所属的A、B号航站楼、国内货运村一期、国际货运村一期、国内货站和物流联检大厦等资产仍无法办理产权证明。
对此,我公司与控股股东-深圳市机场(集团)有限公司一直在共同努力,积极协调政府有关部门,全力推进上述资产的产权办理工作。
但由于政策因素和历史遗留问题较为复杂,相关产权办理工作还需要一个较长的周期。
为了切实维护我公司全体股东的利益,深圳市机场(集团)有限公司将继续全力支持、协助我公司办理上述资产的产权证明,同时深圳市机场(基团)有限公司承诺:对于A、B号航站楼、国内货运村一期、国际货运村一期、国内货站以及物流联检大厦等6项资产,在深圳市机场(集团)有限公司将所属的上述6项资产所对应的土地过户至深圳市机场股份有限公司名下之前,如出现该6项资产现有的建筑物因未取得房屋产权证而被有关部门责令拆除的情形,给深圳市机场股份有限公司所引至的任何损失均由深圳市机场(集团)有限公司承担。
承诺正在履行之中。
3.4 预测年初至下一报告期期末的累计净利润可能为亏损或者与上年同期相比发生大幅度变动的警示及原因说明□适用√不适用3.5 其他需说明的重大事项3.5.1 证券投资情况□适用√不适用3.5.2 报告期接待调研、沟通、采访等活动情况表接待时间接待地点接待方式接待对象谈论的主要内容及提供的资料2010年01月14日公司实地调研汇丰(香港)银行连沛堃公司基本情况2010年02月09日公司实地调研里昂证券周子诺、胡光耀公司基本情况2010年03月23日公司实地调研中信建投证券、高华证券李磊、姜朗霆调研T3及2010年行业复苏影响、中期发展趋势2010年03月24日公司实地调研Morgan Stanley Menno Sanderse等15人公司基本情况2010年04月14日公司实地调研广州证券尹倩公司运营情况介绍2010年04月30日公司实地调研KGI Aisa Limited、EQUINOXPARTNERS,L.P. 张萌、Tomoyuki Izumi、Sean Fieler公司业务发展状况、未来发展计划2010年06月04日公司实地调研长城证券、华泰证券宋伟亚、余建军公司运营现状2010年06月23日公司实地调研投资者见面会由公司领导回答了投资者提出的有关公司发展战略、经营与财务状况的有关问题,参观UPS转运中心、机场扩建工地2010年06月25日上海策略会申银万国中期策略会介绍公司经营现状和热点问题2010年07月05日公司实地调研长江证券沈晓峰公司基本情况2010年09月10日公司实地调研平安证券、Sloane Robinson孙超、潘晓菡公司业务发展状况、未来发展计划3.6 衍生品投资情况□适用√不适用3.6.1 报告期末衍生品投资的持仓情况□适用√不适用§4 附录4.1 资产负债表编制单位:深圳市机场股份有限公司2010年09月30日单位:元期末余额年初余额项目合并母公司合并母公司流动资产:货币资金1,251,603,611.94 1,232,375,619.80 1,442,056,204.92 1,428,392,955.41 结算备付金拆出资金交易性金融资产应收票据50,611,635.95 50,611,635.95 60,394,520.14 60,394,520.14 应收账款350,808,694.98 274,169,386.06 263,782,940.90 211,912,339.84 预付款项2,598,047.51 2,008,453.34 4,583,072.42 2,862,429.34 应收保费应收分保账款应收分保合同准备金应收利息9,386,992.61 6,631,699.17 15,623,267.26 12,747,249.59 应收股利1,164,354.00 1,164,354.00 1,164,354.00 1,164,354.00 其他应收款7,850,213.26 4,334,128.20 13,860,202.79 8,743,817.45 买入返售金融资产存货2,181,019.93 1,988,424.66 1,689,451.52 1,477,513.90 一年内到期的非流动资产其他流动资产流动资产合计1,676,204,570.18 1,573,283,701.18 1,803,154,013.95 1,727,695,179.67 非流动资产:发放贷款及垫款可供出售金融资产持有至到期投资长期应收款长期股权投资719,322,557.95 1,241,224,708.63 736,114,729.25 1,257,566,592.87 投资性房地产175,029,297.29 175,029,297.29 179,441,007.02 179,441,007.02 固定资产2,413,633,303.08 2,103,804,023.12 2,517,812,634.04 2,193,183,898.28 在建工程1,032,643,694.93 1,027,442,823.41 241,220,516.12 236,862,083.76 工程物资固定资产清理2,567,335.60 1,149,581.22生产性生物资产油气资产无形资产212,446,810.24 210,035,487.21 213,803,330.51 211,583,337.54 开发支出商誉长期待摊费用4,316,117.57 927,934.32 5,858,766.94 2,132,169.72 递延所得税资产93,001,054.70 86,861,756.12 92,212,117.70 86,267,925.76 其他非流动资产非流动资产合计4,652,960,171.36 4,845,326,030.10 3,987,612,682.80 4,167,037,014.95 资产总计6,329,164,741.54 6,418,609,731.28 5,790,766,696.75 5,894,732,194.62 流动负债:短期借款43,845,769.20 43,845,769.20 53,421,864.02 53,421,864.02 向中央银行借款吸收存款及同业存放拆入资金交易性金融负债应付票据应付账款49,289,906.77 25,689,633.08 44,420,095.71 27,251,977.31 预收款项34,837,416.87 2,528,503.65 41,335,375.39 1,701,841.43 卖出回购金融资产款应付手续费及佣金应付职工薪酬106,373,660.42 89,387,775.40 59,530,761.75 48,832,493.50 应交税费58,297,194.35 42,743,122.24 66,771,334.83 45,819,438.50 应付利息应付股利其他应付款287,638,664.55 810,861,331.41 230,147,641.11 655,308,850.74 应付分保账款保险合同准备金代理买卖证券款代理承销证券款一年内到期的非流动负债其他流动负债流动负债合计580,282,612.16 1,015,056,134.98 495,627,072.81 832,336,465.50 非流动负债:长期借款应付债券长期应付款专项应付款预计负债52,296,593.75 52,236,593.75 91,701,293.75 91,701,293.75 递延所得税负债其他非流动负债8,629,484.48 6,981,664.18 10,602,829.89 8,778,919.72 非流动负债合计60,926,078.23 59,218,257.93 102,304,123.64 100,480,213.47 负债合计641,208,690.39 1,074,274,392.91 597,931,196.45 932,816,678.97 所有者权益(或股东权益):实收资本(或股本)1,690,243,200.00 1,690,243,200.00 1,690,243,200.00 1,690,243,200.00 资本公积898,698,629.79 886,986,919.63 898,698,629.79 886,986,919.63 减:库存股专项储备盈余公积433,322,283.18 433,322,283.18 433,322,283.18 433,322,283.18 一般风险准备未分配利润2,633,423,196.94 2,333,782,935.56 2,145,438,477.67 1,951,363,112.84 外币报表折算差额归属于母公司所有者权益合计5,655,687,309.91 5,344,335,338.37 5,167,702,590.64 4,961,915,515.65 少数股东权益32,268,741.24 25,132,909.66所有者权益合计5,687,956,051.15 5,344,335,338.37 5,192,835,500.30 4,961,915,515.65 负债和所有者权益总计6,329,164,741.54 6,418,609,731.28 5,790,766,696.75 5,894,732,194.624.2 本报告期利润表编制单位:深圳市机场股份有限公司2010年7-9月单位:元本期金额上期金额项目合并母公司合并母公司一、营业总收入473,672,239.09 359,335,242.94 431,279,051.97 338,731,936.91 其中:营业收入473,672,239.09 359,335,242.94 431,279,051.97 338,731,936.91 利息收入已赚保费手续费及佣金收入二、营业总成本268,870,017.45 204,738,122.64 235,563,332.60 184,253,120.61 其中:营业成本238,305,225.91 183,565,387.67 209,971,700.49 166,456,168.47 利息支出手续费及佣金支出退保金赔付支出净额提取保险合同准备金净额保单红利支出分保费用营业税金及附加19,397,595.26 12,654,769.86 17,255,894.39 12,033,704.55 销售费用794,198.83 794,198.83 628,352.52 628,352.52 管理费用15,354,892.59 10,360,034.86 13,962,125.42 9,258,761.94 财务费用-4,981,895.14 -2,636,268.58 -6,254,740.22 -4,123,866.87 资产减值损失加:公允价值变动收益(损失以“-”号填列)投资收益(损失以“-”号16,011,491.78 16,224,634.69 12,011,022.75 14,127,371.71 填列)其中:对联营企业和合16,011,491.78 16,224,634.69 12,011,022.75 14,127,371.71 营企业的投资收益汇兑收益(损失以“-”号填列)三、营业利润(亏损以“-”号填220,813,713.42 170,821,754.99 207,726,742.12 168,606,188.01 列)加:营业外收入998,807.47 630,168.18 4,286,873.28 780,680.51 减:营业外支出129,640.80 105,837.55 473,142.07 473,088.73 其中:非流动资产处置损失100,837.55 100,837.55 23,141.53 23,088.73四、利润总额(亏损总额以“-”221,682,880.09 171,346,085.62 211,540,473.33 168,913,779.79 号填列)减:所得税费用47,469,299.23 34,130,058.77 41,146,028.23 31,039,925.79五、净利润(净亏损以“-”号填174,213,580.86 137,216,026.85 170,394,445.10 137,873,854.00 列)归属于母公司所有者的净171,895,406.69 137,216,026.85 168,177,513.43 137,873,854.00 利润少数股东损益2,318,174.17 2,216,931.67六、每股收益:(一)基本每股收益0.1017 0.0995(二)稀释每股收益0.1017 0.0995七、其他综合收益八、综合收益总额174,213,580.86 137,216,026.85 170,394,445.10 137,873,854.00归属于母公司所有者的综171,895,406.69 137,216,026.85 168,177,513.43 137,873,854.00 合收益总额归属于少数股东的综合收2,318,174.17 2,216,931.67益总额4.3 年初到报告期末利润表编制单位:深圳市机场股份有限公司2010年1-9月单位:元本期金额上期金额项目合并母公司合并母公司一、营业总收入1,398,698,466.52 1,069,100,323.80 1,226,059,955.10 943,717,106.60其中:营业收入1,398,698,466.52 1,069,100,323.80 1,226,059,955.10 943,717,106.60利息收入已赚保费手续费及佣金收入二、营业总成本753,474,436.69 573,934,786.79 687,044,632.82 514,434,073.02其中:营业成本668,743,355.68 516,592,305.69 587,685,008.37 459,659,794.68利息支出手续费及佣金支出退保金赔付支出净额提取保险合同准备金净额保单红利支出分保费用营业税金及附加56,948,657.36 37,645,730.65 49,398,500.61 33,378,131.40 销售费用2,228,710.22 2,228,710.22 2,397,845.03 2,397,845.03 管理费用44,375,452.03 30,190,764.62 42,609,399.12 28,954,187.48 财务费用-20,459,704.45 -14,076,236.79 -18,848,189.98 -11,953,027.51 资产减值损失1,637,965.85 1,353,512.40 23,802,069.67 1,997,141.94 加:公允价值变动收益(损失以“-”号填列)投资收益(损失以“-”号37,707,828.70 38,158,115.76 24,587,096.75 306,329,159.06 填列)其中:对联营企业和合37,707,828.70 38,158,115.76 24,587,096.75 306,329,159.06 营企业的投资收益汇兑收益(损失以“-”号填列)三、营业利润(亏损以“-”号填682,931,858.53 533,323,652.77 563,602,419.03 735,612,192.64 列)加:营业外收入2,918,757.55 1,982,033.53 14,841,435.27 2,228,304.45 减:营业外支出-8,545,267.70 -8,599,641.10 3,741,492.35 3,722,814.35 其中:非流动资产处置损失165,535.29 165,535.29 213,491.81 212,814.35四、利润总额(亏损总额以“-”694,395,883.78 543,905,327.40 574,702,361.95 734,117,682.74 号填列)减:所得税费用148,886,420.93 111,096,592.68 117,193,589.21 86,635,851.58五、净利润(净亏损以“-”号填545,509,462.85 432,808,734.72 457,508,772.74 647,481,831.16 列)归属于母公司所有者的净538,373,631.27 432,808,734.72 451,589,721.38 647,481,831.16 利润少数股东损益7,135,831.58 5,919,051.36六、每股收益:(一)基本每股收益0.3185 0.2672(二)稀释每股收益0.3185 0.2672七、其他综合收益八、综合收益总额545,509,462.85 432,808,734.72 457,508,772.74 647,481,831.16归属于母公司所有者的综538,373,631.27 432,808,734.72 451,589,721.38 647,481,831.16合收益总额归属于少数股东的综合收7,135,831.58 5,919,051.36益总额4.4 年初到报告期末现金流量表编制单位:深圳市机场股份有限公司2010年1-9月单位:元本期金额上期金额项目合并母公司合并母公司一、经营活动产生的现金流量:销售商品、提供劳务收到的1,333,882,250.87 1,037,513,314.61 1,146,765,543.19 847,630,787.44 现金客户存款和同业存放款项净增加额向中央银行借款净增加额向其他金融机构拆入资金净增加额收到原保险合同保费取得的现金收到再保险业务现金净额保户储金及投资款净增加额处置交易性金融资产净增加额收取利息、手续费及佣金的现金拆入资金净增加额回购业务资金净增加额收到的税费返还110,262.00 23,527.17收到其他与经营活动有关111,873,215.01 125,463,022.30 159,068,839.31 178,833,787.17 的现金经营活动现金流入小计1,445,865,727.88 1,162,976,336.91 1,305,857,909.67 1,026,464,574.61购买商品、接受劳务支付的162,872,533.42 123,722,697.96 173,863,286.61 122,092,249.65 现金客户贷款及垫款净增加额存放中央银行和同业款项净增加额支付原保险合同赔付款项的现金支付利息、手续费及佣金的现金支付保单红利的现金支付给职工以及为职工支249,693,542.78 198,458,873.38 236,666,077.88 187,518,816.36 付的现金支付的各项税费233,557,260.28 169,128,162.24 193,254,653.88 144,886,416.74支付其他与经营活动有关166,965,900.25 54,731,790.51 384,442,488.04 256,433,945.20 的现金经营活动现金流出小计813,089,236.73 546,041,524.09 988,226,506.41 710,931,427.95 经营活动产生的现金632,776,491.15 616,934,812.82 317,631,403.26 315,533,146.66 流量净额二、投资活动产生的现金流量:收回投资收到的现金230,729,000.00 230,729,000.00取得投资收益收到的现金85,205,955.18 85,205,955.18 23,739,261.88 388,276,552.02处置固定资产、无形资产和139,923.66 128,410.50 3,679,355.42 102,531.00 其他长期资产收回的现金净额处置子公司及其他营业单位收到的现金净额收到其他与投资活动有关的现金投资活动现金流入小计316,074,878.84 316,063,365.68 27,418,617.30 388,379,083.02购建固定资产、无形资产和846,912,037.01 838,309,813.84 184,448,926.42 178,821,081.66 其他长期资产支付的现金投资支付的现金1,653,335.00 270,311,000.00 629,348,290.14质押贷款净增加额取得子公司及其他营业单位支付的现金净额支付其他与投资活动有关的现金投资活动现金流出小计848,565,372.01 838,309,813.84 454,759,926.42 808,169,371.80投资活动产生的现金-532,490,493.17 -522,246,448.16 -427,341,309.12 -419,790,288.78 流量净额三、筹资活动产生的现金流量:吸收投资收到的现金其中:子公司吸收少数股东投资收到的现金取得借款收到的现金43,845,769.20 43,845,769.20 1,589,909,783.41 1,589,909,783.41发行债券收到的现金收到其他与筹资活动有关的现金筹资活动现金流入小计43,845,769.20 43,845,769.20 1,589,909,783.41 1,589,909,783.41偿还债务支付的现金53,421,864.02 53,421,864.02 1,556,000,000.00 1,556,000,000.00分配股利、利润或偿付利息50,388,912.00 50,388,912.00 43,190,496.00 43,190,496.00 支付的现金其中:子公司支付给少数股东的股利、利润支付其他与筹资活动有关的现金筹资活动现金流出小计103,810,776.02 103,810,776.02 1,599,190,496.00 1,599,190,496.00筹资活动产生的现金-59,965,006.82 -59,965,006.82 -9,280,712.59 -9,280,712.59 流量净额四、汇率变动对现金及现金等价-44,584.14 -11,693.45 -44,957.03 -20,987.62 物的影响五、现金及现金等价物净增加额40,276,407.02 34,711,664.39 -119,035,575.48 -113,558,842.33加:期初现金及现金等价物100,202,204.92 86,538,955.41 234,802,480.48 218,908,462.50 余额六、期末现金及现金等价物余额140,478,611.94 121,250,619.80 115,766,905.00 105,349,620.174.5 审计报告审计意见:未经审计深圳市机场股份有限公司二〇一〇年十月二十六日法定代表人:汪洋。