Modelingofheattransfercoefficient inthe furnace of CFB boilers by artificial neural network approach
化工原理课程(全英文)教学课件 14

level mechanism, resulting from
the exchange of translational, rotational, and vibrational energy among the molecules comprising the medium.
12 © 2015 Yanwei Wang
− Motion of particles through fluids
− Flow through beds of solids
2 © 2015 Yanwei Wang
Upcoming Lectures
Weeks 8-11
Chapter 4 Heat Transfer and Its Applications
7 © 2015 Yanwei Wang
Heat & Temperature Change
The heat that must be supplied or removed to change the temperature of a substance is ������ = ������������������ ∆������
8 © 2015 Yanwei Wang
Specific Heat Capacity
Exercise
When you drink cold water, your body must expend metabolic energy to maintain normal body temperature of 37 ℃ by warming up the water in your stomach. Could drinking ice water substitute for exercise as a way to “burn calories?” Suppose you expend 430 kilocalories during a brisk one-hour walk. How many liters of ice water would you have to drink in order to use 430 kilocalories of metabolic energy? As a comparison, the stomach can hold about one liter.
《传热传质学》主要内容和专业词汇中英文对照

《传热传质学》主要内容和专业词汇中英文对照Chapter 1 Thermodynamics and Heat Transfer主要内容1.Concepts:heat (thermal energy)、heat transfer、thermodynamics、total amount of heat transfer、heat transfer rate、heat flux、conduction、convection、radiation2.Equations:1) The first law of thermodynamics (conservation of energy principle)2) Heat balance equation: a) closed system; b) open system (steady-flow)3) Fourier’s law of heat conduction4) Newton’s law of cooling5) Stefan-Boltzmann law主要专业词汇heat transfer 传热、热传递、传热学thermodynamics热力学caloric 热素specific heat 比热mass flow rate 质量流率latent heat 潜热sensible heat 显热heat flux热流密度heat transfer rate热流量total amount of heat transfer总热量conduction导热convection对流radiation辐射thermal conductivity 热导率thermal diffusivity 热扩散率convection/combined heat transfer coefficient 对流/综合换热系数emissivity 发射率absorptivity 吸收率simultaneous heat transfer 复合换热Chapter 2 Heat Conduction Equation主要内容3.Concepts:temperature field、temperature gradient、heat generation、initial condition、boundary condition、steady\transient heat transfer、uniform\nonuniform temperature distribution4.Equations:1) Fourier’s law of heat conduction (§2-1)2) Heat conduction equation (in rectangular\cylindrical\spherical coordinates)(§2-2、§2-3)3) Boundary conditions: (§2-4)a)Specified temperature B. C.b) Specified heat flux B. C. (special case: insulation、thermal symmetry);c) Convection B.C.d) Radiation B.C.e) Interface B.C.4) Average thermal conductivity k ave(§2-7)5) Solution of one-dimensional, steady heat conduction in plane walls、cylinders andspheres (k =const):a) no heat generation, specified temperature B.C.: (§2-5)T(x) or T(r);Q(x) or Q(r), Q=constb) with heat generation, Specified temperature B.C. or Convection B.C. : (§2-6)∆T max=T o-T s= gs2/2nk ; q(x)=gx/n; T s=T + gs/nhcharacteristic length S, shape factor n:plane walls — s = L (half thickness), n = 1cylinders ——s = r o, n = 2spheres ——s = r o, n =35.Methods: Solve a heat transfer problem1) Mathematical formulation (differential equation & B.C.)2) General solution of equation3) Application of B.C.s4) Unique solution of the problemtemperature field\distribution 温度场\分布 temperature gradient 温度梯度 heat generation 热生成(热源) initial\boundary condition 初始\边界条件 transient heat transfer 瞬态(非稳态)传热 isothermal surface 等温面 Heat conduction differential equation 导热微分方程trial and error method 试算法 iterate 迭代 convergence 收敛Chapter 3 Steady Heat Conduction主要内容6. Concepts:multilayer\composite wall overall heat transfer coefficient Uthermal resistance R t thermal contact resistance R ccritical radius of insulation R crfin efficiency fin effectiveness7. Equations:✓ Multiplayer plane wall 、cylinders and spheres: 12totalT T Q UA T R ∞∞-==∆& ✓ Fin: fin equation ——0)()(=--∞T T hp dxdT kA dx d c1) Uniform cross-section:2) Varying cross-section: )(fin fin max fin,fin fin ∞-==T T hA Q Q b ηη&&thermal resistance热阻parallel 并联in series串联thermal contact resistance 接触热阻composite wall 复合壁面thermal grease 热脂cross-section 横截面temperature execess 过余温度hyperbolic 双曲线的exponent 指数fin 肋(翅)片fin base 肋基fin tip 肋端fin efficiency 肋效率fin effectiveness 肋片有效度Chapter 4 Transient Heat Conduction主要内容8.Concepts:lumped system analysis characteristic length (L c=V/A)Biot number (Bi=hL c /k) Fourier number ( τ = at/L)9.Equations:●Bi≤0, lumped system analys is (§4-1)●Bi>0, Heisler/Grober charts OR analytical expressions1-D:a) infinite large plane walls, long cylinders and spheres (§4-2)b) semi-infinite solids (§4-3)multidimensional: product solution (§4-4)主要专业词汇lumped system analysis 集总参数法characteristic length 特征长度(尺寸)dimension 量纲nondimensionalize 无量纲化dimensionless quantity 无量纲量semi-infinite solid 半无限大固体complementary error function 误差余函数series 级数production solution 乘积解Chapter 5 Numerical Methods in Heat Conduction主要内容10.Concepts:control volume (energy balance) method、finite difference method、discretization、node、space step、time step、mesh Biot number、mesh Fourier number、mirror image concept、explicit/implicit method、stability criterion (primary coefficients ≥0)Numerical error: 1) discretization/truncation error; 2) round-off error11.Methods:Numerical solution:1) Discretization in space and time (∆x, ∆t);2) Build all nodes’ finite difference formulations (including interior and bou ndary nodes);i.Finite difference methodii.Energy balance method (i.e. Control V olume method)3) Solution of nodal difference eqs. of heat conduction;a)Direct method: Gaussian Eliminationb)Iterative method: Gauss-Seidel iteration主要专业词汇control volume 控制容积finite difference有限差分Taylor series expression泰勒级数展开式mirror image concept 镜像法Elimination method 消元法direct/iterative method 直接/迭代方法explicit/implicit method 显式/隐式格式stability criterion 稳定性条件primary coefficients 主系数unconditionally 无条件地algebraic eq. 代数方程discretization/truncation error 离散/截断误差round-off error 舍入误差Chapter 6、7 Forced Convection and Natural Convection主要内容12.Concepts:Nu、Re、Gr、PrForce/natural convection、external/internal flow、velocity/thermal boundary layer flow regimes、laminar/turbulent flowhydrodynamic/thermal entry region、fully developed regionCritical Reynolds Number (Re c)、hydraulic diameter (D h)、film temperature (T f)、bulk mean fluid temperature (T b)logarithmic mean temperature difference ( ∆T ln)volume expansion coefficient (β = 1/T)effective thermal conductivity (K eff = K Nu)evaporation、boiling、condensation、nucleation sitepool/flow boiling、subcooled / satuated boilingnatural convection / uncleate / transition /film boilingburn out point13.Equations:Drag force :F D = C f AρV2/2Heat transfer rate:Q = hA(T s-T∞)3.Typical Convection Phenomena:1) Forced convection:external flow——flow over flat plates (§6-4)——flow across cylinders and spheres (§6-5)internal flow——flow in tubes (§6-6)2) Natural convection:flow over surfaces (§7-2)flow inside enclosures (§7-3)3) Boiling Heat Transfer主要专业词汇Force/natural convection 自然/强制对流laminar/turbulent flow 层/湍流boundary layer 边界层laminar sublayer 层流底层buffer layer 缓冲层transition region 过渡区flow regimes 流态inertia/viscous force 惯性/粘性力shear stress 剪切应力friction/drag coefficient 摩擦/阻力系数friction factor 摩擦因子dynamic/kinematic viscous 动力/运动粘度wake 尾流stagnation point 滞止点flow separation 流体分离vortex 漩涡rotational motion 环流velocity fluctuation 速度脉动hydrodynamic 水动力学的hydraulic diameter 水力直径fully developed region 充分发展段volume flow rate 体积流量arithmetic/logarithmic mean temperature difference 算术/对数平均温差volume expansion coefficient 体积膨胀系数interferometer 干涉仪asymptotic渐近线的effective thermal conductivity 有效热导率evaporation 蒸发boiling 沸腾condensation 凝结pool boiling池内(大容器)沸腾flow boiling(管内)强制对流沸腾subcooled / satuated boiling 过冷/饱和沸腾nucleation site 汽化核心uncleate / transition /film boiling 核态/过渡/膜态沸腾burnout point烧毁点surface tension 表面张力vapor bubble 汽泡excess temperature 过热度thermodynamic equilibrium 热力平衡phase change/transformation 相变latent heat of vaporization 汽化潜热analogical method 类比法integral approach 积分近似法order of magnitude analysis 数量级分析法similarity principle 相似原理Chapter 9 Radiation Heat Transfer主要内容14.Concepts:black body、gray body、diffuse surface、emissive power (E)emissivity (ε)、absorptivity (α)、reflectivity (ρ)、transmissivity (τ)irradiation(G)、radiosity(J)、reradiating(adiabatic) surfaceview factor (F ij)、radiation network、space resistance、surface resistance radiation shieldgas radiation、transparent medium to radiation、absorbing and transmitting medium ws:Blackbody:(1) Planck’s distrib ution law(2) Stefan-Boltzmann’s law(3) Wien’s displacement lawGraybody:(4) Kirchhoff’s lawActual body:E (T) = ε E b(T) = ε σT4W/m2Gas:(5) Beer’s law3.Calculation:1) View factor:reciprocity/summation/superposition/symmetry Rulecrossed-strings method2) Radiation heat transfer:Radiation networkOpen system:between two surface (e.g. two large parallel plates)Enclosure:2-surface enclosure;3-surface enclosureRadiation shield主要专业词汇thermal radiation热辐射、quantum theory量子理论、index of refraction 折射系数electromagnetic wave/spectrum 电磁波/波谱、ultraviolet (UV) rays紫外线、infrared (IR) rays 红外线absorptivity 吸收率、reflectivity 反射率、transmissivity 透射率、emissivity (ε) 发射率(黑度)、specular/diffuse reflection 镜反射/漫反射irradiation (incident radiation) 投入辐射、radiosity 有效辐射spectral/directional/total emissive power单色/定向/总辐射力fraction of radiation energy 辐射能量份额(辐射比)、blackbody radiation function 黑体辐射函数view factor 辐射角系数、crossed-strings method交叉线法、reciprocity/summation/superposition/symmetry Rule相互/完整/和分/对称性net radiation heat transfer 净辐射热流量radiation network 辐射网络图、space/surface radiation resistance 空间/表面辐射热阻、reradiating surface重辐射面、adiabatic 绝热的radiation shield遮热板transparent medium to radiation辐射透热体、absorbing and transmitting medium吸收-透过性介质Chapter 10 Heat Exchangers主要内容16.Concepts:heat exchanger type---- double-pipe、compact、shell-and-tube、plate-and-frame、regenerative heat exchangerparallel/counter/cross/multipass flowoverall heat transfer coefficient (U) fouling factor (R f)heat capacity rate capacity rationlog mean temperature difference (ΔT lm)heat transfer effectiveness (ε)number of transfer units (NTU)17.Equations:1) heat balance eq.: Q = C h (T h,in - T h,out)=C c(T c,out - T c,in)2) heat transfer eq.: Q = UAΔT lm( LMTD method)or Q = εQ max = εC min (T h,in –T c,in) ( ε-NTU method) 3.Methods:1) LMTD Method:Select a heat exchangerKnown: C h、C c、3‘T’Predict: 1‘T’、Q、A2) ε-NTU Method:Evaluate the performance of a specified heat exchangerKnown: C h、C c、UA、T h,in、T c,inPredict: Q、T h,out、T c,out主要专业词汇double-pipe/compact/shell-and-tube/plate-and-frame/regenerative heat exchanger套管式/紧凑式/壳管式/板式/蓄热(再生)式换热器parallel/counter/cross/multipass flow 顺流/逆流/叉流/多程流area density 面积密度tube/shell pass 管程/壳程static/dynamic type 静/动态型baffle 挡板header 封头nozzle管嘴guide bar 导向杆porthole 孔口gasket 垫圈lateral 侧面的/横向的fouling factor 污垢因子heat capacity rate 水当量heat transfer effectiveness (ε) 传热有效度number of transfer units (NTU) 传热单元数《传热传质学》知识难点与重点Chapter 1 Thermodynamics and Heat Transfer第一章热力学与传热学1.传热学研究内容(温差=>传热);Heat Transfer Research (Temperature Difference=> Heat Transfer)2.三种基本传热方式的机理和基本公式;The Mechanisms and Basic Formulas of Three Basic Modes of Heat Transfer.3.传热过程、传热方程式;Heat Transfer Process,Heat Transfer Equation4.导热系数、对流换热系数、传热系数的物理涵义、单位、基本数量级、影响因素和变化规律;Physical meanings ,units, fundamental orders,influencing factors and changes in laws of heat conduction coefficient,convection heat transfer coefficient,heat transfer coefficient.5.热阻与热流网络图;Thermal resistance and heat transfer network6,单位与单位制;Unit and system of unitsChapter 2 Heat Conduction Equation第二章导热方程式1.导热问题的求解目标(物体内部的温度场与热流场);Determine Target of Heat Conduction(temperature field and heat field in the internal objects)2.温度场(稳态、非稳态、均匀、一维、二维、三维);Temperature field (steady,transient,uniform,one-dimensional,two-dimensional,three-dimensional)3.等温面、等温线、热流线的性质及相互关系;Properties of isothermal surface, isotherm,heat flow and the relationship among them 4.方向导数、梯度的数学概念及相互关系;Mathematical concept of directional derivative , gradient and the relationship between them5.Fourier 定律;Fourier Law6.推导导热微分方程式的理论基础、简化假设及方程各项(内能、导热、内热源、导温系数、)的物理涵义;Theoretical bases of concluding heat conduction differential equation,simplified assumption and physical meanings of each term in the equation (Internal energy, heat conduction, internal heat source,temperature transfer coefficient, )7.定解条件【几何、物理、时间、边界(Ⅰ、Ⅱ、Ⅲ)】Conditions of determining the solution【geometry,physics,time,boundary(Ⅰ、Ⅱ、Ⅲ )】8.导热问题的求解方法(解析解、数值解)。
solarRadiation

1.Solar RadiationThe output of sun is 2.8×10²³KW. The energy reaching the earth is 1.5×10¹⁸KWH/year. When light travels from outer space to earth, solar energy is lost because of following reasons:Scattering:The rays collide with particles present in atmosphereAbsorption:Because of water vapor there is absorption.Cloud cover:The light rays are diffused because of clouds.Reflection:When the light rays hit the mountains present on the earth surface there is reflection. Climate:Latitude of the location, day (time in the year) also affects the amount of solar energy received by the place.The above mentioned factors determine the amount of power falling on the surface.Insolation:It is a quantity indicating the amount of incident solar power on a unit surface, commonly expressed in units of kW/m2. At the earth’s outer atmosphere, the solar insolation on a 1 m2 surface oriented normal to the sun’s rays is called SOLAR CONSTANT and its value is 1.37 kW/m2. Due to atmospheric effects, the peak solar insolation incident on a terrestrial surface oriented normal to the sun at noon on a clear day is on the order of 1 kW/m2. A solar insolation level of 1 kW/m2 is often called PEAK SUN. Solar insolation is denoted by ' I '.The graph shown gives the amount of power present in different wavelengths of radiation. It can be seen from the graph that 50% of solar energy is in the form of thermal energy. Solar PV captures the energy in visible region. Solar thermal captures energy in infrared region.WavelengthKW/m 2UltravioletVisibleInfrared0.2μm 0.4μm0.7μm4μmIrradiance:It is an amount of solar energy received on a unit surface expressed in units of kWh/m 2. Solar irradiance is essentially the solar insolation (power) integrated with respect to time. When solar irradiance data is represented on an average daily basis, the value is often called PEAK SUN HOURS (PSH) and can be thought of as the number of equivalent hours/day that solar insolation is at its peak level of 1 kW/m 2. The worldwide average daily value of solar irradiance on optimally oriented surfaces is approximately 5 kWh/m 2 or 5 PSH. Solar irradiance is denoted by ' H '.Now we know the definition of two basic terms commonly used in design of a photovoltaic systems. Of course, these terms are often used interchangeably. Hence, one has to be careful in looking at the unit that has been used. In designing a photovoltaic system, it is important to know the amount of insolation available to us at a given time so that the power can be captured using solar panels and convert it into electricity. Depending on the requirement, the size of the panel can be then designed.2. Radiation MeasurementWe know that the atmosphere is made up of ions and other particles including clouds. Hence, when the incident radiation passes through the atmosphere, some radiation penetrates and falls directly on to the panel, some radiation diffuses in atmosphere and travels to the panel and some radiation gets reflected from the surroundings of the panel and reaches the panel, the effect being called albedo effect. It becomes extremely important to know the amount of energy that has reached the panel through all the paths. There are several factors on which this energy is dependent. They are as follows: Latitude and longitude of the geographical location.Climatic conditions such as presence of clouds, water vapor etc. Time of the day.Time of the year. Angle of tilt. Collector design.Now, let us see how we make use of this information in calculating the solar energy available at the panel. The steps are as follows:1. Find the sun position with respect to the location. This is a function of latitude (φ), hour angle (ω) and declination angle (δ).),,(δϖφf n SunPositio =2. Find the available solar energy or irradiance with no atmosphere, H O . This is a function of sun position.)(n SunPositio f H O =3. Find the solar energy available on horizontal surface with atmospheric effects, H OA . This is a function of H O and clearness index K T .O T OA H K H =4. Find the actual solar energy available at the panel, H t . This is a function of H OA and the tilt factor R D .OA D t H R H =All the above mentioned steps can be written as an algorithm so that the moment available data is fed, the actual solar energy available at the panel can be calculated instantly. The algorithm would involve the following equations: βφ,Enter3651→=N ()⎟⎠⎞⎜⎝⎛−∗=365802sin 45.23N πδ Degrees, N = 1 on Jan 1st , N = 365 on Dec 31st()δφωtan tan cos 1⋅−=−sr ⎟⎟⎠⎞⎜⎜⎝⎛⎟⎠⎞⎜⎝⎛+=365360cos 033.01N I I SC O KW/m2()()()δβφωωδβφπsin sin cos cos cos 24−+−∗=sr sr Oot I H KWh/m 2/day on atilted surface with no atmospheric effects. ()()()δφωωδφπsin sin cos cos cos 24sr sr Oo I H +∗=kWh/m 2/day(data fitting curve K T ⋅)⋅= - Clearness Index()⎟⎠⎞⎜⎝⎛−+⎟⎠⎞⎜⎝⎛++−=2cos 12cos 11βρβD D R D K K K R - Tilt Factorwhere ρ is the reflection factor which ranges between 0.2 to 0.7.kWh/m o D T t H R K H ∗∗=2/dayThis algorithm can be translated into any of the programming languages like C, C++ or MATLAB. Entering the known parameters, it becomes convenient to find out the solar energy available at any geographical location.Insolation at any locationWe need to develop an algorithm, which calculates insolation (H t ) in kWh/m 2 at any place, once we input the following parameters:a. Day of the year (N)b. Latitude of the location (φ)c. Tilt angle (β)d. Angle of declination (δ)e. Clearness Index (K T )f. Reflection co-efficient (varies from 0.2 to 0.7)Following flow chart gives an idea for developing the algorithm:We can see that once δ, N and φ are input, Extra Terrestrial Radiation (ETR) can bedetermined. Δ, the declination angle of the sun is assumed to be the same every year and δ = 0 in March 21st . Following Fourier series can be used to calculate δ:t B t B t B t A t A t A Ao 3sin 2sin sin 3cos 2cos cos 321321++++++=δ where)80(365360−=N t degreesA0, A1…B3 = ?ETR can be calculated from the following expression:()δφϖϖδφsin sin sin cos cos 24sr sr SC I k ETR +⋅⋅= kWh/m 2 where ⎥⎦⎤⎢⎣⎡⎟⎠⎞⎜⎝⎛+=365360cos 033.01N kI SC = mean solar constant = 1.37 kW/m 2φ = latitude in degrees/radians δ = declination angle in degrees/radiansωsr =hour angle at sunrise in degrees/radians = cos -1(-tan φtan δ)The next parameter that needs to be known is K T , the clearness index. It is one of themost important and difficult factors to be determined since it depends on atmospheric conditions such as absorption, pressure, cloud-cover at the place etc., which are not constant at a given place. However, a model for K T could be developed based on the irradiance level (H) measured at different places and using the relationship K T = H/ETR. K T was initially modeled using linear polynomial regression and multiple regression techniques. Since the results obtained with these models were not very accurate, a model was developed using Fourier series techniques of curve fitting since K T is a periodic function of period one year.We have seen earlier that the irradiance in kWh/ m 2 can be calculated for any location by inputting latitude of the location, declination angle, day number of the year for a given tilt angle using algorithm. The plot of irradiance as a function of the year is shown in the following figure.We can see that the level varies with the day of the year. It may reach a peak at some day of the year and reach a bottom on some other day of the year. The peaks and valleys are the direct result of the amount of irradiance reaching the earth. This is a graph that gives us the irradiance level over one year period.3.Heat Transfer ConceptsThe important terminology one needs to know to understand the heat transfer mechanism is the following:a)Radiationb)Conductionc)Convectiond)Mass transportTo understand the meaning of each of these terms, let us take an example. Let us consider a typical flat plate solar collector that is used in solar water heater system and shown in the following figure.Water In Water Out Convection through AirIn the above figure it can be seen that the heat is transferred from Sun to the flat plate solar collector by radiation. Radiation is the process of heat transfer from source to the target directly. The plate gets heated and transfers part of the heat to the copper tubes carrying water by conduction. Conduction is a process of heat transfer between two metals or solids. Part of the heat from the plate gets lost due to convection of heat. Convection is a process of heat transfer from solids to the surroundings via fluids. The heat transferred to the copper tube gets eventually transferred to the water flowing through the tubes by mass transport. Mass transport is a process of heat transfer similar to convection with little difference. Convection is an uncontrolled process where as mass transport is a controlled process where the discharge rate of the fluid can be controlled. It is important to note at this point that the above-mentioned heat transfer processes are all dependent on the properties of materials.Modeling of Heat transfer system:To understand modeling concept, let us consider a spherical space as shown in the following figure:T a Most part of the spherical space is enclosed by a thermal insulating material such as thermo-foam. The balance part is covered by a thermal conducting material. Let a hot body at temperature T1 is placed at the middle of the space. The heat from the hot body flows outwards towards the boundary of the space by radiation and convection. Let the temperature at the inner surface of the conductive window of the space be T si. The heat flows through the thermal conductive window. Let the temperature at the outer surface of the window be T so. The heat further flows into the atmosphere by convection and radiation. Let the ambient temperature outside the surface be T a. It can be observed that T1>T si>T so>T a. The decrease of temperatures during the outflow is attributed to the loss of heat in the process of convection, radiation and conduction of heat. The following block diagram can represent the outward flow of heat from the hot body to ambient:aIn the block diagram, T1 is the temperature of the hot body, T si is the temperature at the inner surface of the thermal conductor window, T so is the temperature at the outer surface of the thermal conductor window, and T a is the ambient temperature. Also, Rθv1 is the thermal resistance of the convection path between hot body and the inner surface of the thermal conductor, Rθr1 is the thermal resistance of the radiation path between hot body and the inner surface of the thermal conductor, Rθc1 is the thermal resistance of the conduction path between inner and out surface of the thermal conductor window, Rθv2 is the thermal resistance of the convection path between outer surface of the thermalconductor and the ambient, and R θr2 is the thermal resistance of the radiation path between outer surface of the thermal conductor and the ambient.The heat flow from the hot body to the ambient is analogous to ohms law (v = I · r). That is effort = flow x resistance. With reference to the heat flow, effort is the temperature difference, flow is the power and resistance is the thermal resistance of the path. Hence, we can write T = P x R θ.Based on this analogy, let us find the following terms:Thermal Resistance of the convection path is given by111()si v v T T R P θθ−=, ºC/W Power transmitted through convection is given by111()si v v T T P R θθ−=, W Normalizing the power transmitted through convection by dividing it by unit area, we get11v v P T A r θθΔ== q Where r θv1 = R θv1 x A = Thermal Resistivity measured in ºC m 2/W In general we can writeTq r θΔ== h · ΔT Here h is called the Thermal Coefficient, one of the most important terms in heat transfer.ConductionConduction is a mode of heat transfer in which transfer of energy takes place from the more energetic to the less energetic particles of a substance due to interactions between the particles. Heat transfer processes by conduction can be quantified in terms of rate equation known as Fourier’s law. Let us consider a thin rectangular solid slab as shown in the following figure:qΔxIn the figure, q is the heat flux and is the rate of heat transfer in the x direction per unit area perpendicular to the direction of transfer. T1 is the temperature of the hotter side of the slab and T2 is the temperature of the colder side of the slab. We have seen earlier that the heat flux is proportional to the temperature difference (T1 – T2). That isq Α (T1 – T2).Hence, we can writeq = h ·ΔTwhere h is the thermal coefficient in W/˚C m2Now, let us define another constant called thermal conductivity, k, in terms of thermal coefficient and the thickness of the slab Δx. That isk = h ·Δx [(W/˚C m2) · m]; [W/˚C m]Hence, we can writek h x =Δ Substituting this in the expression for heat flux, we getTq k xΔ=⋅Δ Thermal conductivity, k, is a transport property and is the characteristic of the slab material.Now, if A is the area of the slab then the heat rate by conduction, P is the product of heat flux and the area. That isT P q A k A xΔ=⋅=⋅⋅Δ Let us summarize the units of various constants we have considered so far. a) Thermal resistance R θ = ˚C/W or ˚K/Wb) Thermal resistivity r θ = ˚C· m 2/W or ˚K· m 2/W c) Thermal co-efficient h = W/˚C· m 2 or W/˚K· m 2 d) Thermal conductivity k = W/˚C· m or W/˚K· mAlso, we can write expression for all the above-mentioned constants in terms of thermalconductivity as follows:a) Thermal conductivity = kb) Thermal co-efficient kh x =Δc) Thermal resistivity xr k θΔ=d) Thermal resistance xR k AθΔ=⋅Thermal conductivity is an important property of material and plays an important role in the conduction process. The k values for different materials are given in the followingtable:Material k value in W/˚C/mCopper 385 Aluminum 211 Steel 47.6 Glass 1.05 Brick 0.6Concrete 1.7 Asbestos 0.32 Polyurethane 0.025 Polystyrene 0.035 Still air0.026Problem:Calculate Thermal resistance of the path ifa) The slab is made up of glass having area of 1 m 2 and thickness of 5 mm. b) The slab is made up of brick having area of 1 m 2 and thickness of 220 mm. Solution:We know that the expression for thermal resistance is given by xR k AθΔ=⋅ a) Δx = 5 mm = 5 x 10⁻³ m; k = 1.05; A = 1 m 2 35101.051x R θ−= = 0.004762 ˚C/Wb) Δx = 220 mm = 220 x 10-3 m ; k = 0.6 ; A = 1 m 23220100.61x R θ−= = 0.366667 ˚C/WA typical example of heat transfer by conduction is the case of heat dissipation insemiconductor devices such as junction transistors (BJT and FET). Any device that has a voltage across it and current through it simultaneously dissipates power. This power is equal to the product of the voltage and the current. We know that the power is the rate at which energy is converted from one form to another. In semiconductor devices, the energy changes from electrical energy to heat energy.Now, heat energy can be compared to current and temperature to voltage. When current flows in a semiconductor device, a voltage is produced and when heat energy flows in any substance, the temperature rises. The thermal resistance measured in ˚C/W of the substance determines how much the temperature rises when heat energy flows in it.The maximum operating temperature of a semiconductor junction is about 200 ˚C. Depending upon the type of case material, any given semiconductor device may have a lower maximum operating temperature. If this maximum temperature is exceeded, the device gets destroyed. An important part of the design process for large signal semiconductor circuit is making sure that the junction does not rise to a destructive temperature. To safeguard this, heat sinks are frequently used with semiconductor devices. Thermal resistance of the heat sink is the one that controls the temperature. We have seen earlier that the thermal resistance R θ can be given by the following expression:xR k AθΔ=⋅Here, the thermal resistance depends on the thickness of the heat sink material, thermal conductivity of the material and the area of the heat sink material. Normally, the thickness of the material is almost standardized and the thermal conductivity is the property of the material. That leaves the flexibility of varying only the surface area of the heat sink to vary the thermal resistance of the heat sink. To design heat sink with appropriate surface area, we need to know the maximum allowable temperature for the junction and the ambient temperature. The temperature of a piece of the material depends upon both the temperature rise caused by heat energy flowing in a thermal resistance and the temperature of the surrounding air. Stated mathematically:A Diss Temperature T P R t θ=+max ,maxJ At Diss T T R P θ−=Following figure shows how a semiconductor device is mounted on to a heat sink.The thermal resistance of the whole unit is made up of the following three parts:1. R θJC is the thermal resistance from junction of the device to case of thedevice. This specifies how many degrees hotter than the case the semiconductor junction will become for each watt dissipated.2. R θCS is the thermal resistance from case to heat sink. It specifies how many degrees hotter than the heat sink the case of the device will become for each watt dissipated.3. R θSA is the thermal resistance from heat sink to ambient. It specifies how many degrees hotter than the surrounding air the heat sink will become for each watt dissipated.Since all three thermal resistances appear in series with the flow of heat energy, the total thermal resistance is the sum of the three as shown in the following figure:P Tt JC CS SA R R R R θθθθ=++Substituting for Rot in the above equation we get the following:max ,maxJ AJC CS SA Diss T T R R R P θθθ−++=Normally, R θJC is provided in the data sheet of any device and R θCS can be assumed to be 1 ˚C/W. Hence, the thermal resistance of the heat sink can be calculated by rearranging the terms as follows:max ,maxJ ASA JC CS Diss T T R R R P θθ−=−−θConvectionConvection is a mode of heat transfer between a solid and a fluid when there is a temperature difference between a fluid and a solid. The convection heat transfer mode is comprised of following two mechanisms:•Energy transfer due to random molecular motion (diffusion).•Energy transferred by the bulk motion of the fluid.Such motion in the presence of a temperature gradient contributes to heat transfer.Let us consider a fluid flow over a heated surface as shown in the following figure:Heated SurfaceT S T FFluidΔxThe interaction between the fluid and the heated surface results in the development of a region in the fluid through which the velocity varies from zero at the surface to a finite value associated with the flow. This region of the fluid is known as the velocity boundary layer. Also, if the surface and flow temperature differ, there will be a region of the fluid through which the temperature varies from T S at the surface to T F in the outer flow. This layer is called the thermal boundary layer. If T S > T F, convection heat transfer will occur between the surface and the outer flow.The convection heat transfer mode is sustained both by random molecular motion and by the bulk motion of the fluid within the boundary layer. The contribution due to random molecular motion dominates near the surface where the fluid velocity is low. The contribution due to bulk fluid motion originates from the fact that the boundary layer grows as the flow progresses in the x direction. In effect, the heat that is conducted into this layer is swept downstream and is eventually transferred to the fluid outside the boundary layer.Convection heat transfer may be classified into the following types:1.Free Convection: Here the flow is induced by buoyancy forces, which arise fromdensity differences, caused by temperature variations in the fluid.2. Forced Convection: Here the flow is caused by external means such as fan, pump or atmospheric winds.Let us derive expressions for convective thermal resistance, convective thermal resistivity, convective thermal conductivity and convective thermal coefficient. We have seen in earlier that the expression for power (heat flow) is given by the following:TP k A xΔ=⋅⋅Δ, W; wherek = Thermal conductivityA = Cross sectional area perpendicular to the heat flowΔT = T S – T F = Temperature difference between surface and outer flow Δx = Thickness of the fluidHere most of the parameters are measurable except the fluid thickness, by. It can vary with surroundings. Hence, an additional parameter is added which is measurable and the fluid thickness is taken as a fraction of the measurable parameter as given by the following expression:X T P k A x XΔ=⋅⋅⋅Δ; W; whereX = Characteristic dimensionThe ratio of Characteristic dimension to the fluid thickness is called as the Nusselt number, a dimensionless quantity represented by N . HenceTP k A XΔ=⋅Ν⋅⋅; WRearranging the terms, we can get the expression for heat flow rate/unit area (heat density) and convective thermal resistance asPT q k A XΔ==⋅Ν⋅; W/m 2v T XR P k θΔ==⋅Ν⋅A; ˚C/WNow, we know that the thermal resistivity is the product of thermal resistance and area.v X Xr A k A k θ=⋅=⋅Ν⋅⋅Ν; ˚Cm 2/WFrom the above expression, we can write the expression for convective thermal coefficient (reciprocal of thermal resistivity) asv k h Xθ⋅Ν=; W/˚C/m 2Substituting for convective thermal coefficient in the expression for heat density and heat flow rate we get the following expressions:v q h T θ=⋅Δ; W/m 2v P h T A θ=⋅Δ⋅; WDetermination of Nusselt Number:Nusselt Number is a dimensionless number that can be determined experimentally only. In convection mode of heat transfer, we need to know the following for determining the Nusselt Number:• Speed of the fluid flow • Property of the fluid • Geometry of the solidNusselt Number for different classes of convection is different. They are called1. Rayliegh Number for free convection. It is represented by A and is given by the following expression:3g X Tβδν⋅⋅⋅ΔΑ=⋅; whereg = Acceleration due to gravity = 9.81 sec/m 2 β = Coefficient of thermal expansion X = Characteristic Dimension δ = Thermal diffusivity υ = Kinemetic viscosity of fluid2. Reynolds Number for forced convection. It is represented by R and is given by the following expression: u XR ν⋅=; whereu = mean velocity of flow X = Characteristic dimension υ = Kinemetic viscosity of fluidWe can see that the Nusselt number is a function of both Rayliegh Number and Reynolds Number, that isN = f ( A , R )The boundary layer in convection mode of heat transfer can be any of the following:• Laminar : In the laminar boundary layer, fluid motion is highly ordered and it ispossible to identify streamlines along which particles move. Since the velocity component u is in the direction normal to the surface, it can contribute significantly to the transfer of momentum and energy through the boundary layer.• Turbulent : In the turbulent boundary layer, fluid motion is highly irregular and is characterized by velocity fluctuations. These fluctuations enhance the transfer of momentum and energy and hence increase surface friction as well as convection transfer rates.The boundary layer can be classified into laminar or turbulent based on the Rayliegh Number and Reynolds Number.For Rayliegh Number:a) A ≥ 105: Turbulent flowb)103≤ A ≤ 105: Laminar flowc) A < 103: Free convection is not possibleFor Reynolds Number:a)R ≥ 2300 :Turbulent flowb)R < 2300 : Laminar flowLet us find expressions for Nusselt number for various shapes and for Laminar & Turbulent flows in terms of either Rayliegh Number or Reynolds Number for free convection and forced convection respectively.Free Convection - Rayliegh Number:Horizontal flat plate of length ‘a’ and breadth ‘b’ as shown in the following figure:Characteristic Dimension:()2a b X+ =For Laminar Flow:•102 < A < 105•N= 0.54 A 0.25 For Turbulent Flow:•A > 105•N = 0.14 A 0.33Circular plate with diameter ‘d’ as shown in the following figure:=Characteristic Dimension: X dFor Laminar Flow:•102 < A < 105•N = 0.54 A0.25For Turbulent Flow:•A > 105•N = 0.14 A 0.33Horizontal cylinder with diameter ‘d’ as shown in the following figure:dCharacteristic Dimension X = dFor Laminar Flow:•104 < A < 109•N = 0.47 A0.25For Turbulent Flow:•A > 109•N = 0.10 A 0.33Vertical cylinder with length ‘l’ as shown in the following figure:lCharacteristic dimension X = lFor Laminar Flow:•104 < A < 109•N = 0.56 A0.25For Turbulent Flow:•109 < A < 1012•N = 0.20 A 0.4Parallel plates at an angle ‘θ’ as shown in the following figure:Characteristic Dimension X = Distance between parallel platesFor θ < 50˚For Laminar Flow:•Not possibleFor Turbulent Flow:•A > 105•N = 0.062 A0.33Forced Convection – Reynolds NumberFlat plate of length ‘a’ or Circular plate of diameter ‘a’ as shown in the following figure:Characteristic Dimension X = aFor Laminar Flow:•R < 5 x 10⁵•N = 0.664 x R0.5 x (υ/δ) 0.33For Turbulent Flow:•R > 5 x 10⁵•N = 0.37 x R0.8 x (υ/δ) 0.33Vertical cylinder with length ‘l’ and diameter ‘D’ where the flow is over the cylinder as shown in the following figure:DCharacteristic Dimension X = Diameter, DFor Laminar Flow:•0.1 < R < 1000•N = (0.35 + 0.56 R 0.52) x (υ/δ) 0.3For Turbulent Flow:•1000 < R < 5 x 10⁵•N = 0.26 R0.6 x (υ/δ) 0.3Horizontal cylinder with diameter ‘d’ where the flow is into the cylinder as shown in the following figure:Characteristic Dimension X = Length, LFor Laminar Flow:•R < 2300•N = 1.86 (R x υ/δ x D/L) 0.33For Turbulent Flow:•R > 2300•N = 0.027 x R0.8 x (υ/δ) 0.33Application of Convection PrinciplesProblem 1:Consider two conducting square plates measuring 1 m on each side, placed parallel to each other, separated by a distance of 3 cm. Let air is the medium of their separation. Let the vertical sides formed by the plates are thermally insulated so that no heat flows through them. Let the bottom plate is at 70 ˚C and the top plate is 45 ˚C. Calculate the heat flow in watts from the bottom plate to the top plate by convection through the air separating the plates.Solution:Following figure explains the problem.3 cmWe have seen earlier that the expression for the power flow P is given by the following expression:N kP A TX⋅=⋅⋅Δ, W, whereA = Area of the surface perpendicular to the heat flow = 1 m2N = Nusselt numberk = Thermal conductivity of the fluid (air) = 0.028 W/m˚KX = Characteristic dimension = Vertical distance between the plates for parallel plates. ΔT = Temperature difference between the plates。
衡量换热器效果的指标

衡量换热器效果的指标英文回答:Measuring the effectiveness of a heat exchanger involves several key indicators that help evaluate its performance. These indicators provide insights into the efficiency, thermal performance, and overall effectiveness of the heat exchanger. Two commonly used indicators are the heat transfer coefficient and the effectiveness.The heat transfer coefficient, also known as theoverall heat transfer coefficient (U-value), represents the rate at which heat is transferred through the heat exchanger. It is a measure of the heat transfer efficiency and is typically expressed in watts per square meter per degree Celsius (W/m²·°C). A higher heat transfer coefficient indicates better heat transfer performance.For example, let's say we have two heat exchangers, A and B. Heat exchanger A has a heat transfer coefficient of300 W/m²·°C, while heat exchanger B has a heat transfer coefficient of 200 W/m²·°C. This means that heat exchanger A is more efficient at transferring heat compared to heat exchanger B.The effectiveness of a heat exchanger is another important indicator. It measures how effectively the heat exchanger is able to transfer heat between two fluids. The effectiveness is defined as the ratio of the actual heat transfer to the maximum possible heat transfer. It is expressed as a percentage, with higher values indicating better performance.For instance, let's consider two heat exchangers, C and D. Heat exchanger C has an effectiveness of 80%, while heat exchanger D has an effectiveness of 60%. This means that heat exchanger C is more effective at transferring heat between the fluids compared to heat exchanger D.In addition to these indicators, other factors such as pressure drop, fouling, and cost-effectiveness should also be considered when evaluating the effectiveness of a heatexchanger. Pressure drop refers to the decrease in fluid pressure as it flows through the heat exchanger. Lower pressure drop is generally desirable as it reduces the energy required for fluid circulation.Fouling is another factor to consider, as it refers to the accumulation of unwanted deposits on the heat transfer surfaces. Fouling reduces the heat transfer efficiency and can lead to increased energy consumption and maintenance costs. Regular cleaning and maintenance can help mitigate fouling effects.Lastly, cost-effectiveness is an important consideration. It involves assessing the initial investment cost of the heat exchanger, as well as the operating and maintenance costs over its lifespan. A cost-effective heat exchanger should provide good performance while minimizing overall costs.中文回答:衡量换热器效果的指标有几个关键指标,可以帮助评估其性能。
Mathematical Modeling of Heat Transfer
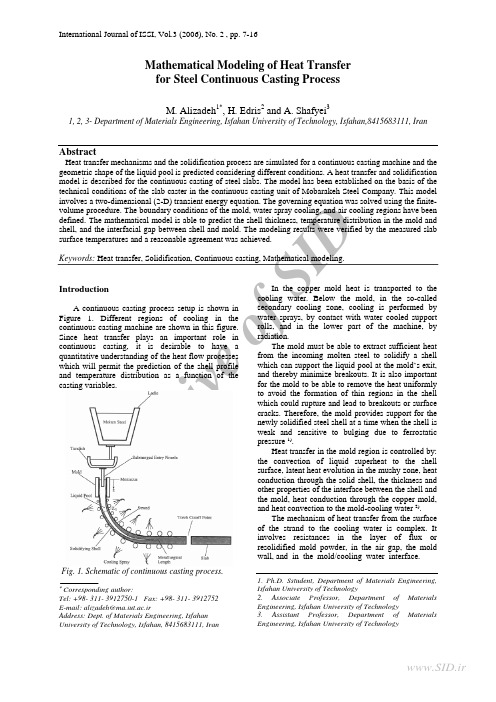
A rc hi v eo fSI DMathematical Modeling of Heat Transfer for Steel Continuous Casting ProcessM. Alizadeh 1*, H. Edris 2 and A. Shafyei 31, 2, 3- Department of Materials Engineering, Isfahan University of Technology, Isfahan,8415683111, IranAbstractHeat transfer mechanisms and the solidification process are simulated for a continuous casting machine and the geometric shape of the liquid pool is predicted considering different conditions. A heat transfer and solidification model is described for the continuous casting of steel slabs. The model has been established on the basis of the technical conditions of the slab caster in the continuous casting unit of Mobarakeh Steel Company. This model involves a two-dimensional (2-D) transient energy equation. The governing equation was solved using the finite-volume procedure. The boundary conditions of the mold, water spray cooling, and air cooling regions have been defined. The mathematical model is able to predict the shell thickness, temperature distribution in the mold and shell, and the interfacial gap between shell and mold. The modeling results were verified by the measured slab surface temperatures and a reasonable agreement was achieved.Keywords: Heat transfer, Solidification, Continuous casting, Mathematical modeling.IntroductionA continuous casting process setup is shown inFigure 1. Different regions of cooling in the continuous casting machine are shown in this figure.Since heat transfer plays an important role incontinuous casting, it is desirable to have aquantitative understanding of the heat flow processeswhich will permit the prediction of the shell profileand temperature distribution as a function of thecasting variables.Fig. 1. Schematic of continuous casting process.∗Corresponding author:Tel: +98- 311- 3912750-1 Fax: +98- 311- 3912752 E-mail: alizadeh@ma.iut.ac.irAddress: Dept. of Materials Engineering, Isfahan University of Technology, Isfahan, 8415683111, IranIn the copper mold heat is transported to the cooling water. Below the mold, in the so-called secondary cooling zone, cooling is performed by water sprays, by contact with water cooled supportrolls, and in the lower part of the machine, by radiation. The mold must be able to extract sufficient heat from the incoming molten steel to solidify a shell which can support the liquid pool at the mold’s exit, and thereby minimize breakouts. It is also important for the mold to be able to remove the heat uniformly to avoid the formation of thin regions in the shell which could rupture and lead to breakouts or surface cracks. Therefore, the mold provides support for the newly solidified steel shell at a time when the shell is weak and sensitive to bulging due to ferrostatic pressure 1).Heat transfer in the mold region is controlled by: the convection of liquid superheat to the shell surface, latent heat evolution in the mushy zone, heat conduction through the solid shell, the thickness and other properties of the interface between the shell and the mold, heat conduction through the copper mold, and heat convection to the mold-cooling water 2).The mechanism of heat transfer from the surface of the strand to the cooling water is complex. It involves resistances in the layer of flux or resolidified mold powder, in the air gap, the mold wall, and in the mold/cooling water interface.1. Ph.D. Sstudent, Department of Materials Engineering, Isfahan University of Technology2. Associate Professor, Department of Materials Engineering, Isfahan University of Technology3. Assistant Professor, Department of Materials Engineering, Isfahan University of TechnologyA rc hi v eo fSI DInternational Journal of ISSI, Vol.3 (2006), No. 2Table 1: Comparison of thermal conductivities of materials present in the continuous casting mold [3].MaterialsTemperature(o C) Thermal conductivity(W m -1 K -1)Steel St 37 1200 29 Copper 30-130 385 Casting flux 1000-1300 0.5 to 1.2 Water 25 0.62Radiation conductivity of gas gap 1000 0.043Fig. 2. Different regions and simulation domain in continuous casting process.The thermal conductivities of different layers are compared in Table 1. As shown in this table, the air gap has the largest resistance to heat flow, while the other parts have a comparatively small resistance. Therefore, the pattern of heat removal in the mold is dependent largely upon the dynamics of gap formation. The air gap or contact resistances can be generated by the shrinkage of the steel shell away from the mold walls, especially after the flux is completely solid and unable to flow into the gaps. More researches were performed to show that the air gap was usually created in the lowest one-third of the mold length 3).In the upper part of the secondary cooling zone, the strand is usually sprayed by water emerging from nozzles arranged in the spaces between the rolls. The rate at which heat is extracted from the strand surface by water sprays has been measured by many researchers. These researchers have shown that under normal continuous casting conditions, in which shell surface temperatures range between 700 and 1200 o C, surface temperature has a little effect on the heat transfer coefficient. All studies agree that, in the stated temperature range, the spray water flux has the most effect on the heat transfer coefficient. Moreover, the temperature of sprayed water does not have a large influence on the heat transfer coefficient 4).In the lower part of the secondary cooling zone, heat transfer is preferred mainly by radiation and by roll contact. Therefore, it should be considered that the oxide scales generated on the surface of the strand could cause a thermal resistance in this zone 5).In this study, the mathematical model has been established on the basis of the technical conditions of the slab caster in the continuous casting unit of Mobarakeh Steel Company. In this model, steel heat capacity and steel thermal conductivity were considered as functions of steel temperature and chemical composition. Considering these functions, the governing equation is a non-linear equation. In this study the equation is solved in non-linear state. This model is also capable of predicting the temperature distribution, including the solidus and liquidus isotherm which defines the solid shell and mushy zone, respectively, as a function of section size, pouring temperature, steel composition, casting speed, mold length and spray conditions.Mathematical modelingFigure 2 shows the different regions of the continuous casting machine and the model considered for physical simulation of the caster. A typical method of modeling the strand thermal condition is shown in this figure. The mathematical model is applied to slices of strand that start at the meniscus and travel through the machine at the casting speed. New slices are generated periodically. A sufficient number of slices exist in each cooling zone to give an accurate representation of the thermal condition in each zone. In this model, only a quarter of the strand is considered due to the symmetry of the heat flow conditions (Figure 3).A rc hi v eo fSI DInternational Journal of ISSI, Vol.3 (2006), No. 2Fig. 3. A symmetric quarter of strand width section with physical coordinate.AssumptionsThe following assumptions are made to simplify the mathematical model 6):-Conduction can take place only in the transverse directions.-Forced convective heat flow in the liquid pool is considered by defining an effective liquid thermal conductivity as:l eff K K ⋅=7(1) -The density of steel is constant, but specific heatcapacity and heat conductivity of steel are functions of temperature and chemical composition and therefore not constant.Model formulationThe energy conservation equation can be written as 7):(2)()()()()⎟⎠⎞⎜⎝⎛∂∂∂∂+⎟⎟⎠⎞⎜⎜⎝⎛∂∂∂∂+⎟⎠⎞⎜⎝⎛∂∂∂∂=∂∂+∂∂+∂∂+∂∂z T k z y T k y x T k x wH vH y uH x H t effeffeffρρρρ To simplify the equation, a transformation as wt z −=ζ is used. Therefore this is: (3)()ls ls s sH H H t y x H H q tHy H y x H x tH +==+∂∂−⎟⎟⎠⎞⎜⎜⎝⎛∂∂∂∂+⎟⎠⎞⎜⎝⎛∂∂∂∂=∂∂;,,,;0ζρααIn order to solve the governing equation, it is necessary to transform the physical domain into a computational domain. In general, this sort of transformation is used, and leads to a uniformly spaced grid in the computational domain but the points in physical domain may be unequally spaced. The original partial differential equation is transformed from physical coordinates (x, y ) to computational coordinates (ξ,η) by applying the chain rule of partial derivatives.;JS H H J H t x y s y x s s +⎟⎟⎠⎞⎜⎜⎝⎛∂∂∂∂+⎟⎟⎠⎞⎜⎜⎝⎛∂∂∂∂=⎟⎠⎞⎜⎝⎛∂∂ξηηαηηξξαξ (4);tH S l ∂∂−= y x J ηξ= In the above equations "S " is a term for heat source due to the metal phase transformation (liquid to solid). In order to establish the region of phase change, the latent heat contribution is specified as a function of temperature i.e. 8):f l l L f H ⋅=(5) Where L f is the latent heat of the phase changeand the liquid fraction (f l ) is computed by:⎪⎪⎭⎪⎪⎬⎫⎪⎪⎩⎪⎪⎨⎧≤≥≥−−≥=.......01sol sol liq sol liq sol liq l T T when T T T when T T T T T T when f (6)A typical 2D cartesian control volume is shownin Figure 4. This C.V contains a central node (P) with four neighborhood points (E, W, N, and S). The integral form of equation (4) is obtained on the control volume by the finite volume method 9,10): a P H sP = a E H sE + a W H sW + a N H sN + a S H sS + b (7) a P = a W + a E + a S + a N + a P oa E =ey x e ⎟⎟⎠⎞⎜⎜⎝⎛ΔΔηξξηα a W =wyx w ⎟⎟⎠⎞⎜⎜⎝⎛ΔΔηξξηα a N =nx y n ⎟⎟⎠⎞⎜⎜⎝⎛ΔΔξηηξα a S =sx ys ⎟⎟⎠⎞⎜⎜⎝⎛ΔΔξηηξαa P o =PJ t ⋅ΔΔ⋅Δηξ b = a P o (H sP o + H lP o - H lP ) + o Pq J ρηξΔ⋅Δ (8)Fig. 4. A typical control volume and the notation used for a Cartesian 2D grid [9].To approximate the variable values on the surface of the control volume, the Quadratic Upwind Interpolation (QUICK) algorithm is used 9). In the QUICK scheme, the variable profile between two points approximated by a parabola instead of aArc hi v eo fSI DInternational Journal of ISSI, Vol.3 (2006), No. 2straight line (Figure 5), on a uniform Cartesian grid leads to 9):W E P e φφφφ818386−+= (9)Fig. 5. Approximation of gradients at cell faces [9].Boundary conditionsTo solve the above equation, the boundary conditions are needed for different regions include the mold, water spray cooling, and air cooling. Figure 6 shows some machine cooling layouts while the technical information belonging to each zone is shown in Table 2. A general form of the boundary condition can be expressed through an equation (10), in which the heat transfer coefficient, h , is estimated for different cooling zones.()water b b T T h n T k −=∂∂−| (10)To determine the temperature of the boundaries, the discretion of the bnT |∂∂ on boundary points isrequired. According to the QUICK scheme b nT |∂∂could be calculated by the following correlation [10]: nT T T nT W P b bΔ+−=∂∂398(11)Therefore, as seen in equation (10), finding the heat transfer coefficient for different regions such as: mold, water spray, and air cooling is necessary.Fig. 6. Secondary cooling of the slab caster.In the mold, several thermal resistance layers exist between the steel shell surface and the recirculation water. All the thermal resistances in the mold are shown in Figure 7. The effective thermal resistance of the water channel is estimated from the water channel heat transfer coefficient, thermal conductivity and the thickness of scale deposits on the surface of the cooling-water channel 11):⎟⎟⎠⎞⎜⎜⎝⎛+=w scale scale water h k d r 1 (12)Fig. 7. Thermal resistances existing between the shell surface and water channel in the mold.Table 2. Secondary cooling zones variables.No. Zone Length zone(m)SegmentNumber of spray nozzles Water flow rate(m 3/sec)Number rollin zoneRoll radius (m)1 0.439 - -2 0.220 - -3 0.303 - 30 0.003975 - -4 0.925 0 38 0.004967 5 0.140 5 1.470 0 38 0.0048426 0.200 6 1.475 1 10 0.004858 5 0.2507 1.725 2 10 0.003975 5 0.3008 1.725 3 10 0.003733 5 0.3009 3.950 4,5 20 0.005667 10 0.350 10 5.200 Roll 37-47 22 0.006483 11 0.380,0.440 11 9.400 Roll 48-63 - Air cooling 16 0.440A rc hi v eo fSI DInternational Journal of ISSI, Vol.3 (2006), No. 2 The heat transfer coefficient between the water and the side walls of the water channel (h w ) is calculated assuming a turbulent flow through an equivalent-diameter pipe (D ) using the empirical correlation of Sleicher and Reusse 11):()21Pr Re 015.05c c water w Dkh += (13)()Pr 6.0215.0333.0;Pr 424.088.0−+=+−=e c cOther thermal resistances shown in Fig 7 can be calculated by the following correlations [11]:;;slag slag slag moldmold mold k d r k dr == ;air air air k d r = (14)Which d slag can be found from the powder consumption per mass of product (M slag (kg/ton)): ()N W N W M d slagsteel slag slag +×××=2ρρ (15) Also, d air includes a gap due to shrinkage of the steel shell, which can be calculated by the thermal linear expansion relation of steel using following correlation for each control volume: T l l Δ⋅⋅=Δλ (16) Where, λ is linear thermal expansion coefficient of steel and l is length of each control volume. Moreover, the heat transfer coefficient due to radiation is calculated by: ()()212221T T T T h rad ++=εσ (17) Heat transfer mechanisms in the spray cooling zones below the mold are defined in Figure 8. The heat extraction due to the water sprays is a function of the water flux. The relationship between the rate of heat extraction by the water sprays and the spray variables has been established in a number ofexperimental studies. One of the most widely usedrelations has been presented by Nozaki's 12): ();0075.013925.055.0water water spray T Q h ×−××= (18)Fig. 8. Heat transfer mechanisms in the secondarycooling zones [12].Due to the high temperature of the strand surfaceand the exposure of water to the surface, an oxidescale is produced on the surface of the strand. Despite the low thickness, the scale can have animportant role in the heat transfer control. Therefore,the effective heat transfer coefficient should be considered as 12):sprayscsceff h k h 11+=δ (19)It has already been mentioned that the cooling ofthe strand in the lower part of the secondary cooling zone is mainly done by radiation 12). Therefore, the equation for the heat transfer coefficient is given as follows:()().2.2am s am s rad T T T T h ++=εσ (20) Besides the radiation, heat transfer is alsoachieved by natural convections, but this part is rather small and can be neglected in comparison to radiation cooling.The symmetrical boundary condition has been considered for midplanes as follows:0.,00.,0=∂∂−==∂∂−=yTk y xTk x (21)Computation and verificationThe algebraic equation of the boundary conditions has been solved with a Tridiagonal Matrix Algorithm (TDMA) solver 13). As seen in equations(7) and (8), to solve the algebraic equation, it is necessary to know the latent enthalpy in a new time step (H l ). To update the amount of the latent enthalpy an iterative solution is used for each time step:11++−+=k sP k sP k lP k lP H H H H (22)As seen in the above equation, by using the sensitive enthalpy that has been obtained by solving the energy equation (H sP k+1), latent enthalpy could be updated in the k+1th inner iteration in each time stepto achieve a certain convergence. The calculation mentioned has been programmed in the FORTRAN language. The mathematic simulation starts by setting the initial steel temperature at the pouring temperature. Input parameters, in Table 3, in the standard cases are verified by the measured temperatures on the shell surface of the strand.Equilibrium lever-rule calculations are performed on a Fe-C phase diagram in order to calculate steel phase fractions. By this means, phase field lines are specified as simple linear functions of carbon equivalent content. The carbon of the steel is applied as the carbon equivalent content that is calculated by the following correlation 14): wt%CE=wt%C+0.04(wt%Mn)-0.14(wt%Si)-0.04(wt%Cr)-0.1(wt%Mo)-0.24(wt%Ti)+0.1(wt%Cu) For a 0.16%C, 1.3%Mn, 0.5%Si, 0.05%Cr, 0.03%Mo and 0.01%Ti plain carbon steel, the carbon equivalent percentage calculated as 0.135 and also the equilibrium phase diagram model calculates T liq.=1528 o C, T sol = 1494 o C. The solid fraction-A rc hi v eo fSI DInternational Journal of ISSI, Vol.3 (2006), No. 2temperature curve in the mushy zone obtained from the model is shown in Figure 9. As seen in this figure the relation between temperature and solid fraction of steel in the mushy zone is non-linear.Solidified shell thickness is one of the most important calculated parameters in the model, and the influence of the grid spacing on this parameter should be considered. The influence of the gridspacing on the solidified shell thickness, in exit point of the mold, is shown in Table 4. The thickness amounts in width and narrow sides are presented in this table. It is clear from Table 4 that when grid spacing is reduced, solidified thicknesses are changed and they are stable in a narrow limit with reduction of grid spacing lower than a certain limit. It can be concluded that the solidified shell thickness is independent of the mesh size with the reduction of grid spacing lower than a certain limit.The mold zone is a complex and important area in continuous casting machine. The solid shell growth in this zone is complicated and the results of this study are compared to those of some other researchers. The comparison between the results of the model in this study and experimentalmeasurement by some other researchers is shown in Figure 10. The figure shows the variation of growth of the solid shell thickness on the ingot for low carbon steel (0.06% C). It is clear that the results from numerical solution in this study have a very good compatibility with those of three 3-D model of Thomas and experimental measurement of Alberny and co-worker.Table 3. Input data for standard conditions.Carbon equivalent content, CE pct 0.132 pctSteel density, ρ7500 kg/m 3 Steel emissivity, ε0.8 Mold copper plates thickness 0.043×0.030 m ×m Total mold length 0.704 m Mold copper plates width 2.220×0.215 m ×m Scale thickness on the surface of mold cold face 0.00001 m Mold conductivity, k mold 315 W/mK Mold powder conductivity, k slag 1.27 W/mK Air conductivity, k air 0.083 W/mKMold powder density, ρslag0.650 kg/m 3 Mold powder consumption rate, M slag 0.8 kg/ton steel Casting speed, V c 0.0167 m/secPour temperature, T in 1546 oCLiquidus temperature, T liq. 1528.6 oCSolidus temperature, T sol. 1494 oC Working mold length 0.659 m Slab geometry, W ×N 1.250×0.203 m ×m Scale conductivity on the surface of slab, k sc 0.5 W/mK Scale conductivity on the surface of mold, k scale 1.0 W/mK Water channel geometry, large & small plates 25×5×29 & 22×5×26mm 3 Average cooling water temperature in the mold 28 oC Water flow rate entering the mold small plate, 0.0061 m 3/sec Water flow rate entering the mold large plate, 0.0553 m 3/sec Latent heat of the steel phase change, L f 272140 J/kgWater conductivity , k water0.615 W/mKSteel specific heat capacity [11], C p ()()()()⎪⎪⎪⎪⎪⎪⎭⎪⎪⎪⎪⎪⎪⎬⎫⎪⎪⎪⎪⎪⎪⎩⎪⎪⎪⎪⎪⎪⎨⎧≥=≤=≤+=≤=−==+=+=liqp liq sol p sol op p o p p op o p T T C T T T C T T C T C T C T C T C T C T C T C T C T C 7877721100*334.02681100850648850750*766.338497507001431700500*836.0268500*376.0456p p p p p p p p p p J/kgK Steel conductivity, k steelf l *k liq +(1-f l )*k sol W/mK Solid steel conductivity, k sol 33.0 W/mK Effective molten steel conductivity, k liq 7*43.0 W/mKScale thickness on the surface of slab , δsc0.001 mA rc hi v eo fSI DInternational Journal of ISSI, Vol.3 (2006), No. 2Table 4. Effect of mesh size on the shell thickness at mold exit.Grid system #nx ×n y Shell thickness at middle of wide face (m)Shell thickness at middle of narrow face (m)25×10 0.0145 0.0111 25×15 0.0135 0.0110 50×15 0.0136 0.0118 50×20 0.0133 0.0119 100×200.0136 0.0117 100×300.0131 0.0117Fig. 9. Phase fraction variation with temperature in mushy zone.Fig. 10. Comparison between model results and other references.Results and discussionThe calculated surface temperatures of a slab, for the Table 3 conditions as a function of the distance below the meniscus, are presented in Figure 11. This figure shows the calculated surface temperatures at the centers of the wide and narrow faces and at the corners of the slab caster. The central areas of the wide faces are cooled one-dimensionally, whereas the slab corners are subject to 2-D cooling. The slab corners can therefore become significantly colder than other parts of the inner wide face. At the beginning of straightening, the slab corner temperature is 230 o C less than the temperature at the center of the wide face. Control of corner cooling is critical for much of continuously cast products. The slab corners tend to have meniscus marks, which act as stress risers. A combination of temperature, stress risers and a low ductility region in the 700-900 o C temperature range during the straightening process often leads to cracks in the corners. One way to increase the corner temperature is to widen the strip of unsprayed strand at the corner. However, as the non-sprayed strip is widened, a hot spot will develop between the colder corner and the sprayed area. Thus, the design must be in a way to ensure that it does not cause other quality problems. Also, as seen in Figure 11, the intensity of heat transfer of mist spray cooling is less than cooling in the lower part of the mold for all of the curves, because of this, the model predicts a 200 o C reheating of the slab surfaceon leaving the mold. A similar situation also exists in water spray cooling and air cooling regions on the surface of the wide face slab.Fig. 11. Predicted surface temperature of strand. Figure 12 shows the solidified shell thickness profiles of both the narrow and wide faces of the slab. This figure shows a sudden change of slope at the beginning of the solidified shell growth curve. It is indicated that the rate of solidified shell growth is clearly high in the mold region. Figure 13 shows a set of data of the local heat flux density along the length of the mold [15]. There is a maximum of heat flux density somewhat below the meniscus. Downward, the heat flux density usually decreases. If the air gapA rc hi v eIDInternational Journal of ISSI, Vol.3 (2006), No. 2between the mold and strand approximately has uniform thickness, or it increases uniformly in the downward direction, the heat flux density along the length of the mold continuously decreases.Fig. 12. Predicted solidified shell thickness.Fig. 13. Heat flux density distribution along the length of the mold.Fig. 14. Effect of casting speed on the pool depth.The casting speed is the most effective parameter in changing the position of the solidified shell thickness profiles. The relation of the "metallurgical length" (maximum length of the liquid pool) with the casting speed is shown in Figure 14. Increase in casting speed decreases the holding time of the slab in the secondary cooling zones and increases the length of the liquid core. Therefore, casting speed is the most important factor in controlling mold heat extraction. The solidified shell thickness as a function of the casting speed of bothwide face and narrow face of the strand are shown in Figure 15. Since, a lower casting speed provides more time for the heat to be extracted from the shell, the shell thickness increases. Moreover, the shell thickness in the initial solidification stage decreases at the high casting speed, as shown in Figure 15, which often easily causes the breakout of strand. Therefore, to prevent this unfavorable defect, the casting speed is limited. It should be mentioned that steel composition and slab width in comparison to casting speed has no significant effect on the shell thickness. As seen in this figure, solidified shell thickness for wide face is higher than it is for narrow face. This is because of the different air gap sizes between mold powder and mold wall in both wide and narrow faces. The air gap size along the length of the mold is predicted by the model for both faces in Figure 16. As seen in this figure, total shrinkage value in narrow face is more than wide face as expected because width size of slab is much larger than thickness size in cross section of strand. Furthermore, this phenomenon could change Fig. 15. Effect of casting speed on shell thickness.Fig. 16. air gap size along the mold.Heat transfer in the mold is governed by these three resistances: the casting-mold interface, the mold wall, and the mold-cooling water interface. Although, thermal resistance due to the air gapA rc hi v e o fSI DInternational Journal of ISSI, Vol.3 (2006), No. 2 should also be considered while the amount of air gap thermal resistance is usually quite large compared to the other resistances especially for the lower portion of the mold. Temperatures of three points: slag layer/mold wall interface (T 1), mold wall (T 2), and water channel wall (T 3) as shown in Figure 7 are predicted by the model. Since, the heat flux for steady state conditions will be constant and independent of distance: (23)mold rad airradair slag s rad airrad air slags slags total water s r rr r r r T T rr r r r T T r T T r T T q +⎟⎟⎠⎞⎜⎜⎝⎛+⋅+−=⎟⎟⎠⎞⎜⎜⎝⎛+⋅+−=−=−=′321The above relation represents three equations for the three unknowns, T 1, T 2, and T 3. The results of the model predictions are shown in Figure 17(a) and Figure 17(b). As seen in these figures, the existence of the air gap between the shell surface and mold wall causes the T 1 to increase both in wide and narrow faces of strand. Since the air gap thickness in the narrow face is larger than the wide face, T 1 in the narrow face is much higher than in the wide face. Therefore, the pattern of heat removal in the mold is dependent largely upon the dynamics of gap formation. It causes temperature difference to exist in solidified shell and has a strong influence on transverse cracks generation in the mold region.Fig. 17. Predicted temperatures for T 1, T 2 and T 3 points in Fig 7 -(a) wide face and (b) narrow face (T 1=slag layer/mold wall interface temperature, T 2=mold wall temperature, and T 3=water channel wall temperature).The effect of the amount of superheat temperature of the molten steel, entering the mold, on the solidified shell thickness is shown in Figure 18. At first, with increasing the superheat temperature, the superheat flux will increase and therefore, the solidification rate decreases. This, in turn, reduces the thickness of the steel shell. On the other hand, by increasing the superheat temperature, the driving force for the heat transfer will increase. Therefore, as seen in Figure 18, the influence of the superheat temperature is insignificant to shell growth, especially in the wide face of the strand. Low superheat, near liquidus temperature, is beneficial to continuous casting. Internal quality is improved as the equated zone is made significantly larger. Therefore, a more desirable structure with greater resistance to halfway cracks is produced. Centerline segregation and porosity are also reduced or eliminated.Fig. 18. Effect of steel superheat temperature on the shell thickness at mold exit.Conclusions1- A finite volume heat transfer and solidification model has been formulated to predict the temperature field and liquid pool position in the continuous casting process under different conditions. This has been verified with the temperature measurement of slab surface.2- Casting speed is the most effective parameter on mold heat removal. Therefore, it is the most important factor in controlling solidified shell thickness and slab temperature.3- Since, the air gap size in narrow face of mold is higher than the wide face, the breakout of strand often occurs in the narrow face.4- Air gap existing in the casting-mold interface causes a large thermal resistance for heat transfer from the solidified shell to the mold. Therefore, it has a strong influence on product quality and casting problems, especially for the narrow face of strand. 5- High superheat temperature may cause breakouts at the mold exit, especially for the narrow face, so it should be exactly kept at a low level.。
金属大变形过程中温度场的Abaqus模拟

金属大变形过程中温度场的Abaqus模拟马璇【摘要】Based on the Abaqus,the finite element modeling and simulation of the large deformation of metal was to analyze the temperaturefield.Considering the deformation heat,the friction heat and the contact heat,the mathematical model of temperature field and the mathematical model of water-cooled and air-cooled were validated.To describe the distribution of the temperature,the parameter of high temperature was used.The results indicate that the temperature of plate core change little while surface temperature change sharply.At the same time,it is important to consider the heat exchange between the surface and the surrounding.The quantity of heat was concerned with the temperature and the coefficient of heat transfer.The deformation heat has a significant impact on the distribution of temperature field.%基于 Abaqus有限元仿真软件,在考虑到变形热、摩擦热和接触热等因素的情况下,建立了轧件内部温度场的数学模型和轧件空冷及水冷的数学模型,并利用实验获得的金属高温物性参数,对金属的大变形过程进行了有限元建模和仿真,模拟了金属变形过程中纵剖面的温度场分布及变化规律。
传热模拟
Br =
µU e2
k ∆T
(11.2.9)
其中, ∆T 为计算区域内的温差。 当用户的问题需要考虑粘性耗散项,并且使用的是分离式求解器时,用户应该在 Viscous Model panel 面板中使用 Viscous Heating 选项激活此项。对于一般的可压缩流动, Br ≥ 1 。 需要注意的是,如果用户已经定义了可压缩流动,但使用了分离式求解器,FLUENT 不会 自动激活粘性耗散选项。 对于任一种耦合式求解器,在求解能量方程时,粘性耗散项总是被考虑进去。 考虑组分扩散项: 由于组分扩散的作用,方程 11.2-1、11.2-6 均包含有焓的输运。 当使用分离式求解器时,此项:
o
o
o o o o o o •
11.4 Periodic Heat Transfer 周期性传热问题
o
11.4.1 Overview and Limitations 概述与适用范围
west_wing@ 2
FLUENT 第十一章中文帮助
o o o o o •
11.4.2 Theory 理论 11.4.3 Modeling Periodic Heat Transfer 周期性传热问题的模拟 11.4.4 Solution Strategies for Periodic Heat Transfer 周期性传热问题求解策略 11.4.5 Monitoring Convergence 监视收敛 11.4.6 Postprocessing for Periodic Heat Transfer 周期性传热问题的后处理
o o o o
west_wing@ 3
FLUENT 第十一章中文帮助
11.1 FLUENT 中的传热模型概述 占据一定体积的物质所据有的热能从一处转移到另一处, 这种现象称为传热。 引发传热 的原因有三种:导热、对流传热、辐射传热。只涉及热传导或/和对流的传热过程是最简单 的情况,而涉及到浮力驱动流动或者自然对流、辐射的传热过程却比较复杂。依据问题的不 同,FLUENT 求解不同的能量方程以考虑用户设定的传热模型。FLUENT 也可以预报出具 有周期对称性几何结构所对应的周期性传热,这样就可以大大减少计算量。
Analytical model for heat transfer in an underground air tunnel

D h =
h = k S= k, = 1= L = P = q = Q = r0 = s = t = tt = Tf = Ts = /~ = u = Us = Vf = x =
Constant defined in equation (19) Cross-section area o f tube (m 2) Specific heat o f fluid (J/kg" K) Depth o f tube (m) Pipe diameter (m) Hydraulic diameter (m) Convective heat transfer conductance (W/m2/K) Soil thermal conductivity 0V/m/K) Thermal conductivity o f tube material (W/m/K) Thickness o f soil layer disturbed by tube (m) Length of tube (m) Tube perimeter (m) Heat flux 0V/m 2) Total heat transfer (W) Radius o f buried spherieal structure (m) Streamwise coordinate along tube (m) Time (s) Thickness o f tube material (m) Fluid temperature inside tube (K) Soil temperature (K) Ambient air temperature (K) Fluid enthalpy (J/kg) U-value of soil layer o f thickness I and tube material (W/m2/K) Fluid velocity inside tube (m/s) Coordinate system (m)
- 1、下载文档前请自行甄别文档内容的完整性,平台不提供额外的编辑、内容补充、找答案等附加服务。
- 2、"仅部分预览"的文档,不可在线预览部分如存在完整性等问题,可反馈申请退款(可完整预览的文档不适用该条件!)。
- 3、如文档侵犯您的权益,请联系客服反馈,我们会尽快为您处理(人工客服工作时间:9:00-18:30)。
Modeling of heat transfer coefficient in the furnace of CFB boilers by artificial neural network approachJaroslaw Krzywanski ⇑,Wojciech NowakCzestochowa University of Technology,Institute of Advanced Energy Technologies,Dabrowskiego 73,42-200Czestochowa,Polanda r t i c l e i n f o Article history:Received 14October 2011Accepted 27March 2012Available online 21April 2012Keywords:Heat transfer Neural networks Modeling CFBa b s t r a c tThe present work introduces a way of predicting the local heat transfer coefficient in the combustion chamber of the circulating fluidized bed boiler (CFB)by the artificial neural network (ANN)approach.Neural networks have been successfully applied to calculate the local overall heat transfer coefficient for membrane walls,Superheater I (SH I,Omega Superheater)and Superheater II (SH II,Wing-Walls)in the combustion chamber of the 260MWe CFB boiler.The previously verified numerical model has been used to obtain the overall heat transfer coefficients,necessary for training and testing the ANN.It has been shown,that the neural networks give quick and accurate results as an answer to the input pattern.The local heat transfer coefficients evaluated using the developed ANN model have been in a good agree-ment with numerical and experimental results.Ó2012Elsevier Ltd.All rights reserved.1.IntroductionHeat transfer in the furnace of a CFB boiler is affected by com-plex factors,such as:suspension density,bed temperature,boiler load,gas velocity,geometry of the chamber and flue gas properties [1–4].Therefore detailed measurements in the furnace are needed to characterize the heat transfer processes.Another way to evaluate the heat transfer coefficient is by the use of multiple equations,correlations and models,given in the lit-erature.Some of them are presented in papers [1,5,6].Author quoted the outlook of Molerus [5]who suggested that a reliable prediction of heat transfer between heat exchanger surfaces and fluidized beds can be achieved best by the application of dimen-sional analysis.The correlations given in literature usually differ from one another and are valid only for limited ranges of operating parameters.It sometimes limits their accuracy and generality as well as there are also limited experimental data of the overall heat transfer coefficient for membrane-walls.A wide-range review and comparison of circulating fluidized bed combustor models was provided by Basu [6].The paper pre-sents two approaches to the performance modeling,i.e.furnace ap-proach and system approach.The furnace approach describes the details of what goes on in the furnace while the system approach takes an interest in system integration.Models usually need some additional data,e.g.to adjust param-eters and sometimes are time consuming in order to obtain accu-rate predictions.The algorithms are often complicated and are based on the solution of complex differential equations [7,8].The adjusting of the parameters also could not be determined immedi-ately,especially for different operating conditions.Another estimation method in engineering analysis and predic-tions,is using the artificial neural network as a tool in energy pre-diction and modeling [7].It is the alternative for above described methods of data handling,considering the complexity of numerical and analytical methods and high costs of empirical experiments [9].The presented work deals with an ANN technique to predict the local overall heat transfer coefficient for membrane-walls in the 260MWe CFB boiler.An ANN model is optimized to predict the overall heat transfer coefficient for membrane-walls depending on the boiler operating parameters.The necessary training samples to train the neural network are calculated using earlier developed program,similar to the methods described in [10–14].2.Calculating conditions of the heat transfer coefficient In order to obtain the heat transfer coefficient,some experi-ments have been carried out on the 260MWe (670t/h steam capacity)CFB boiler operating in PGE Turow Power Plant in Poland [15,16].The dimensions of cross-section area of the combustion chamber in its lower part immediately above the grid is equal to 21.2Â5.2m.Then,the cross-section area increases to reach dimensions of 21.2Â9.9m at a height of 6.7m above the grid le-vel.The total height of the combustion chamber is 48m.Two out-let windows,each of dimensions of 7.8Â3.4m,are situated in this way that the axis of cross-section area is located at a level of 38m.0017-9310/$-see front matter Ó2012Elsevier Ltd.All rights reserved./10.1016/j.ijheatmasstransfer.2012.03.066Corresponding author.Tel./fax:+48343250933.E-mail address:jkrzywanski@tlen.pl (J.Krzywanski).The combustion chamber is made of membrane-walls.It is a tight structure with an area of2477m2consisted of tubes with the inner diameter of63.5mm and with88mm pitch for the front and rear walls and65mm for the side walls.The Superheater I is made of7horizontally placed U-tube bun-dles at a distance of1056mm from one another.Each bundle con-sists of two sections:top and bottom.Bottom section is composed of15tubes with a diameter of51mm each,placed one above the other with the distance of63.5mm.The top section consists of32 tubes with a diameter of44.5mm.The distance between the axes of each tube is equal to56mm.The height of thefirst section is 889mm and1736mm of the other.The vertical distance between the axes of the two tube sections is equal to1064mm.The surface of the Omega superheater is equal to770m2.On the basis of the data obtained from the operating the670t/h steam capacity CFB boiler operating in PGE Turow Power Plant a heat transfer model has been created to predict the local overall heat transfer coefficient for membrane-walls,SH I and SH II.The model has been described in details in[17,18]and its validation has been successfully performed using operating data from the boiler.The relative error between value of the overall heat transfer coefficients obtained from experiments and that calculated by the numerical model is about10%.Such error confirms the ability of the model to use it in calculations of the overall heat transfer coefficient.The model has been used here to obtain the necessary training samples to learn the neural network.3.Development of an ANN-based heat transfer algorithm3.1.Neural network modelingArtificial neural networks are the alternative methods to simu-late uncertain,ill-defined,big and complex systems[19].They are useful especially in:optimization,robotics,forecasting,recognition of signal patterns and in system modeling,medicine and power systems,including heating and heat transfer analysis,solar radia-tion,modeling and control of power generation systems,load fore-casting and prediction[7,10,14,19–22].Some of the most important applications are listed in the paper[7].Author describes a wide range offields for modeling and prediction in energy engi-neering system.All the ANN applications are divided into the fol-lowing groups:classification,forecasting,control systems, optimization and decision-making.Author gives some examples, like modeling of the combustion processes in incineration plants, the predictive control of a thermal plant and modeling of the chemical reactions in turbulent combustion simulations[23–25].Other applications of the ANN are shown in papers[12,19].In thefirst paper author presents a procedure of using an artificial neural network for calculating thefluid-to-particle heat transfer coefficient.In the second work artificial neural networks are used as the tools for thermal analysis in engineering systems,especially in heat exchangers.Neural networks operate like a‘‘black box’’and their learning process resembles a human brain operation[8,21].They do not need any detailed information about the studied phenomena,be-cause they learn the relationship between the input and output variables,from examples.They also have ability to ignore redun-dant and excess data,to use incomplete data sets and to concen-trate on more important inputs[7,10].A neural network is formed by a group of interconnected ele-ments called neurons,arranged in three kinds of layers:input, intermediate(so-called hidden)and output layer.They can containNomenclaturef(x)activation energyh local overall heat transfer coefficient value,WmÀ2KÀ1 HIGH the maximum normalized data valueLOW the minimum normalized data valuem the load of the boiler,%n number of samplesN iter number of epochsT temperature,Kv velocity,msÀ1W ACTUAL the actual valueW MAXIMUM the highest value of the parameterW MINIMUM the lowest value of the parameter W NORM the normalized valuez the distance from the gas distributor,m b slope parameterd relative error,%e voidage,–Subscriptsb bedg gasd desired(target)p predicted by a neural networkFig.1.Heating Surfaces in the260MWe CFB boiler.J.Krzywanski,W.Nowak/International Journal of Heat and Mass Transfer55(2012)4246–42534247one or more hidden layers.Connections between neurons are called weights and have real values.The architecture of an artificial neural network,the number of neurons in hidden layers and the activation function of a neurons, depend on the process(task),hence there are for example recur-rent and feed-forward neural networks.It means,that in order to achieve the required accuracy of neural network estimation,suit-able architecture and the proper number of hidden neurons must be assumed.The feed-forward neural network is the ANN type that is widely used for engineering applications[19].Before a neural network becomes a useful modeling tool,it has to be prepared by means of the following principal steps:Step1:setting initial random values of weights and optimizing the ANN.Step2:run the normalization process of input and output parameters.Step3:run the learning(training)procedure.Initial values of weights are set randomly and uniformly distrib-uted between0and1.Because of the fact,that input and output parameters have dif-ferent physical units and range sizes there is a necessity to bring all input and output values to the same numerical range(between0 and1)by the normalization process.It also allows to avoid any computational difficulty[8].The learning stage,also called an epoch is the supervised learn-ing,when the input pattern is repeatedly presented with its corre-sponding output pattern.During training process connection weights are modified using a suitable learning method.The knowl-edge about the relationships between input and output parame-ters,gained by the ANN during learning epoch,is kept in ANN structure and weights adjusted to produce the desired(target)out-put[7,13].To train the network well,sufficient number of input parame-ters must be used,covering the whole range of variables.The most popular learning algorithm,used to train artificial neu-ral networks with one or more hidden layers is Back Propagation (BP)scheme.It is an iterative gradient algorithm for minimizationof the mean square error,between the desired and predicted output[8].The Back Propagation algorithm is considered as a simple,powerful and reliable training method[7,11].During the learning(training)epoch the neural network out-puts are compared with the pattern.The obtained difference isthe measure of the weights modification rate in BP scheme.The most commonly used activation functions in such neuralnetworks are:the logarithmic sigmoid(Eq.(1))and the hyperbolictangent sigmoid function(Eq.(2))[22]:fðxÞ¼1=ð1þe b xÞð1ÞfðxÞ¼ðe xÀeÀxÞ=ðe xþeÀxÞð2ÞThe learning process stops when the criterion of the mean squareerror is fulfilled and the network has good ability to generalizethe obtained knowledge,i.e.to predict accurately of the validationdata set.After the training epoch,neural networks can be used to achieveadequate response i.e.output data via non-iterative calculationswith a low processing time and small memory resources,as ananswer to a new stimuli,not previously presented to the network[12,20].3.2.Application of neural networkThe idea of the neural network use to obtain convective heattransfer coefficient in the circulatingfluidized bed was presentedin the paper[22].The basis of the idea was to create model simple,non-iterative tool to calculate the heat transfer coefficient.As usual the heat-transfer coefficient has been determined dur-ing laborious experiments and the question is:are obtained valuesstill valid when boiler’s operational parameters change?In such asituation it is often necessary to make another experiment.Model-ing using artificial neural network is then much simpler,easier andfaster in such cases.The architecture of the neural network used in the paper isshown in Fig.2.The neural network has been made of four layers:input layer,two hidden layers and output layer.The number of neurons in the input and output layer are thesame as the number of input and output parameters.The inputparameters are:the distance from the gas distributor z,the bedtemperature T b and voidage e b,flue gas velocity v g and the load of the boiler m.Values of input parameters used for training andtesting the ANN are given in Tables1–3.Table1The input parameters used for training and testing the ANN for membrane-walls.Input parameter Range of valuesLoad of the boiler,%40,70,100Distance from the gas distributor,m 6.25–41.7Flue gas velocity,msÀ1 2.11–6.0Average bed voidage,–0.973–0.997Bed temperature,K930–1298Table2The input parameters used for training and testing the ANN for SH I.Input parameter Range of valuesLoad of the boiler,%40,70,100Distance from the gas distributor,m20.25–23.75Flue gas velocity,msÀ1 2.37–5.502Average bed voidage,–0.988–0.992Bed temperature,K1066–1203Table3The input parameters used for training and testing the ANN for SH II.Input parameter Range of valuesLoad of the boiler,%40,70,100Distance from the gas distributor,m30.75–41.75Flue gas velocity,msÀ1 2.11–5.538Average bed voidage,–0.994–0.997Bed temperature,K931–1161 4248J.Krzywanski,W.Nowak/International Journal of Heat and Mass Transfer55(2012)4246–4253The output variable is the local overall heat transfer coefficient value h.The input layer consists offive neurons and the output layer contains one neuron.Normalisation of input and output signals was performed using the formula(Eq.(3))[10]:W NORM¼ðW ACTUALÀW MINIMUMÞ=ðW MAXIMUMÀW MINIMUMÞÃðHIGHÀLOWÞþLOWð3Þwhere:HIGH=0.9,LOW=0.1.During calculation,Lee and Park’s algorithm is used for weighing factors modifications.This method is an instance of Back Propagation scheme where momentum and learning rate change simultaneously during training phase[26].In order to select the optimal configuration,the number of neu-rons in hidden layers and the activation function of a neurons the four error measures have been used:the coefficient of determina-tion R2of the linear regression line between the predicted values from the neural network and the desired output,the mean abso-lute error MAE,the standard deviation of the mean absolute error STD MAE,the mean relative error MRE and the standard deviation of the mean relative error STD MRE[11,12].The numerical data sets consisted of64,29and69input and out-put data pairs,for membrane-walls,SH I and SH II,respectively.Table4Errors of the overall heat transfer coefficient predictions for membrane–walls for different ANN with hyperbolic tangent sigmoid activation function(bold values refers to the optimal ANN configuration).Model Activation function Structure R2MAE MRE STD MAE STD MRE1The hyperbolic tangent sigmoid function5-1-1-10.6804 3.320.02 3.52 4.88 25-1-2-10.6950 3.200.02 3.48 4.77 35-1-3-10.7912 2.810.02 2.71 3.94 45-1-4-10.8119 2.700.02 2.53 3.74 55-1-5-10.7780 2.720.02 2.98 4.07 65-2-1-10.7045 3.570.02 2.96 4.69 75-2-2-10.6721 3.450.02 3.48 4.94 85-2-3-10.7103 3.230.02 3.27 4.65 95-2-4-10.7604 3.110.02 2.78 4.22 105-2-5-10.7257 3.020.02 3.32 4.52 115-3-1-10.7356 3.010.02 3.20 4.44 125-3-2-10.7383 3.040.02 3.15 4.42 135-3-3-10.8263 2.540.02 2.50 3.60 145-3-4-10.8979 2.440.02 1.18 2.75 155-3-5-10.8567 2.220.01 2.36 3.27 165-4-1-10.8282 2.680.02 2.31 3.58 175-4-2-10.6603 3.840.03 3.16 5.03 185-4-3-10.8518 2.420.02 2.22 3.32 195-4-4-10.8724 2.130.01 2.19 3.08 205-4-5-10.8413 3.270.020.81 3.43 215-5-1-10.7969 2.810.02 2.63 3.89 225-5-2-10.7453 3.110.02 2.99 4.36 235-5-3-10.7821 2.880.02 2.75 4.03 245-5-4-10.7819 2.810.02 2.83 4.03 255-5-5-10.8919 2.340.02 1.52 2.83Table5Errors of the overall heat transfer coefficient predictions for membrane–walls for different ANN with logarithmic sigmoid activation function(bold values refers to the optimal ANN configuration).Model Activation function Structure R2MAE MRE STD MAE STD MRE1The logarithmic sigmoid function5-1-1-10.5915 5.130.04 1.68 5.50 25-1-2-10.6992 3.960.02 2.45 4.73 35-1-3-10.6900 4.240.03 2.07 4.80 45-1-4-10.6870 3.620.02 3.11 4.83 55-1-5-10.6865 3.270.02 3.50 4.84 65-2-1-10.6815 4.370.03 1.94 4.86 75-2-2-10.6879 3.460.02 3.29 4.82 85-2-3-10.6249 4.940.04 1.54 5.27 95-2-4-10.7578 3.350.02 2.52 4.24 105-2-5-10.7335 3.040.02 3.20 4.46 115-3-1-10.7770 2.870.02 2.84 4.08 125-3-2-10.7384 3.910.03 1.87 4.41 135-3-3-10.6240 4.330.03 2.91 5.29 145-3-4-10.8160 2.910.02 2.21 3.70 155-3-5-10.7945 2.860.02 2.61 3.91 165-4-1-10.8234 3.240.02 1.47 3.62 175-4-2-10.6069 4.570.03 2.73 5.40 185-4-3-10.6736 3.460.02 3.44 4.93 195-4-4-10.8024 2.890.02 2.45 3.84 205-4-5-10.7349 3.630.03 2.45 4.44 215-5-1-10.7714 3.380.02 2.26 4.12 225-5-2-10.7229 3.130.02 3.23 4.55 235-5-3-10.6488 3.660.02 3.49 5.12 245-5-4-10.6992 3.360.02 3.26 4.73 255-5-5-10.7465 3.280.02 2.77 4.34J.Krzywanski,W.Nowak/International Journal of Heat and Mass Transfer55(2012)4246–42534249Some of them have been utilized for verification of the network and show its ability to correctly predict the output value.For the purpose of testing a network also new,unseen before,data have been used.Because of the fact,that the performance of an ANN depends on its structure,different ANN architectures have been studied.The number of hidden neurons have been varied and changed from1 to5in each hidden layer.Such assumption has been made in order to reduce the risk of memorization instead of generalization the relationships within the data set[27].Two activation functions have also been considered:the loga-rithmic sigmoid and hyperbolic tangent sigmoid function.This have resulted in a total of50networks for membrane-walls and 25networks for SH I and SH II.In order to avoid the problem of over-training the number of learning and testing cycles has been limited to100,000.The four,before mentioned error measures and the coefficient of determination values for different ANN configurations are pre-sented in Tables4–7.The optimal networks have been selected from generated net-works,based on above described errors.3.3.Selecting of the optimal structure3.3.1.Membrane-wallsThe data presented in Table4refer to hyperbolic tangent sig-moid whereas in Table5to logarithmic sigmoid activation functionTable6Errors of the overall heat transfer coefficient predictions for SH I and different ANN with hyperbolic tangent sigmoid activation function(bold values refers to the optimal ANN configuration).Model Activation function Structure R2MAE MRE STD MAE STD MRE1The hyperbolic tangent sigmoid function5-1-1-10.9493 2.650.02 1.10 2.93 25-1-2-10.9710 1.270.01 1.80 2.22 35-1-3-10.9860 1.240.010.87 1.54 45-1-4-10.9492 2.050.01 2.05 2.93 55-1-5-10.99680.480.000.560.74 65-2-1-10.9854 1.160.01 1.04 1.57 75-2-2-10.99540.630.000.600.88 85-2-3-10.99590.700.000.430.83 95-2-4-10.9810 1.210.01 1.30 1.80 105-2-5-10.9892 1.130.010.70 1.35 115-3-1-10.9044 2.860.02 2.77 4.03 125-3-2-10.9570 2.070.01 1.67 2.70 135-3-3-10.99530.690.000.550.89 145-3-4-10.99650.560.000.520.77 155-3-5-10.99380.800.000.61 1.02 165-4-1-10.9771 1.450.01 1.30 1.97 175-4-2-10.99640.550.000.550.78 185-4-3-10.9881 1.180.010.76 1.42 195-4-4-10.99420.840.010.500.99 205-4-5-10.99670.510.000.530.74 215-5-1-10.99230.820.010.77 1.14 225-5-2-10.99490.760.000.500.93 235-5-3-10.99410.750.000.64 1.00 245-5-4-10.99630.560.000.550.80 255-5-5-10.99620.650.000.450.81Table7Errors of the overall heat transfer coefficient predictions for SH II and different ANN with hyperbolic tangent sigmoid activation function(bold values refers to the optimal ANN configuration).Model Activation function Structure R2MAE MRE STD MAE STD MRE1The hyperbolic tangent sigmoid function5-1-1-10.9792 2.510.02 1.44 2.94 25-1-2-10.9923 1.580.010.80 1.79 35-1-3-10.9945 1.230.010.84 1.51 45-1-4-10.9945 1.270.010.78 1.51 55-1-5-10.9952 1.310.010.47 1.42 65-2-1-10.9909 1.650.010.98 1.95 75-2-2-10.9924 1.410.01 1.06 1.79 85-2-3-10.9957 1.030.010.84 1.34 95-2-4-10.99760.790.010.60 1.00 105-2-5-10.99810.750.000.470.90 115-3-1-10.9904 1.820.010.74 2.00 125-3-2-10.9912 1.660.010.89 1.92 135-3-3-10.9892 1.710.01 1.20 2.12 145-3-4-10.9926 1.550.010.76 1.76 155-3-5-10.99650.790.010.90 1.21 165-4-1-10.9900 1.520.01 1.34 2.05 175-4-2-10.99780.880.010.360.97 185-4-3-10.99710.940.010.51 1.09 195-4-4-10.9961 1.150.010.49 1.27 205-4-5-10.9908 1.680.010.95 1.96 215-5-1-10.9925 1.440.010.97 1.76 225-5-2-10.9955 1.180.010.67 1.38 235-5-3-10.99670.960.010.66 1.18 245-5-4-10.99710.910.010.60 1.10 255-5-5-10.9934 1.390.010.87 1.66 4250J.Krzywanski,W.Nowak/International Journal of Heat and Mass Transfer55(2012)4246–4253of the neural network.As it can be seen,ANNs build on tangent sig-moid activation function,give higher coefficient of determination and lower errors.The best ANN architecture is:[5-3-4-1]with hyperbolic tangent sigmoid activation function and[5-4-1-1]with logarithmic sigmoid activation function.Among the two above listed ANN structures,the network with hyperbolic tangent sigmoid activation function is characterized by higher value of coefficient R2(0.8979)and lower errors than it is for logarithmic sigmoid function.Based on observations of the learning process,the neural net-work with the hyperbolic tangent sigmoid activation function need fewer epochs for correct learning of the process than it was in the case of networks with the logarithmicThe training of neural networks withsigmoid activation function proceededmean square error decreases fasterlogarithmic sigmoid activation function.So the[5-3-4-1]ANN with hyperboliction function is the optimal ANNhas been used for further calculations.The[5-3-4-1]type network composes ofi.e.three neurons in thefirst and fourlayer.After learning stage ANNs have beentraining and the new ones.Local heat transfer coefficient values fordicted by the selected[5-3-4-1]neuraltangent sigmoid activation function andmodel are shown as examples in Table8.In the relationship with numericalANN with hyperbolic tangent sigmoidcated in borders of±4%.As it can be seen from the Table8theand h d for some of the data,even for datawork(not used for training,new data)isIt proofs good accuracy of the neuralFig.3the numerical values have beentained by[5-3-4-1]type of ANN.Thisfigurebetween the predicted and desired value.dicts the value of the local overall heatmembrane walls i.e.the ANN model predictscompared to the numerical data.Local heat transfer coefficient values,neural network with logarithmic sigmoidobtained by numerical model are shown in Table9.In Fig.4the numerical values was compared with data obtained by[5-4-4-1]type of ANN with logarithmic sigmoid activation function.As it can be seen in the Table9,the number of epochs N iter is equal to9682whereas for the[5-3-4-1]type ANN with hyperbolic tangent sigmoid activation function the N iter=6630.Data obtained by ANN with logarithmic sigmoid activation function are located in borders of±5%in the relationship to numer-ical results.So the relative errors are higher than it is in the case of ANN with tangent sigmoid activation function.This confirms the poorer ability of the[5-4-4-1]type ANN with logarithmic sigmoid activation function to correctly predict the lo-cal overall-heat transfer coefficient.3.3.2.Superheaters:SH I and SH IIOn the basis of the experience form the previous chapter only hyperbolic tangent sigmoid function have been considered as the activation function.This have resulted in a total of25networks for each examined heating surface.The four error measures and the coefficient of determination values for different ANN architectures are presented in Tables6 and7.Table6refers to SH I and Table7to SH II,respectively.Table8The selected values of the local heat transfer coefficient for membrane-walls, predicted by the[5-3-4-1]type ANN with hyperbolic tangent sigmoid activation function and obtained by numerical method.h d N iter=6630h p dW mÀ2KÀ1W mÀ2KÀ1% Data used for training network150.32146.88 2.29parison of the local overall heat transfer coefficient values desired and predicted for membrane-walls by[5-3-4-1]type ANN with tangent sigmoid activation function.Table9The selected values of the heat transfer coefficient for membrane-walls,predicted by the[5-4-4-1]type ANN with logarithmic sigmoid activation function and obtained by numerical method.h d N iter=9682h p dWmÀ2KÀ1WmÀ2KÀ1%Data used for training network150.32146.32 2.66149.11145.93 2.14138.31140.86 1.85136.77140.07 2.41131.51133.55 1.55 Data not used for training network153.91147.14 4.40152.91146.90 3.93140.30141.600.93139.23141.22 1.43133.11134.62 1.13J.Krzywanski,W.Nowak/International Journal of Heat and Mass Transfer55(2012)4246–425342514252J.Krzywanski,W.Nowak/International Journal of Heat and Mass Transfer55(2012)4246–4253parison of the local overall heat transfer coefficient values desired andpredicted by[5-1-5-1]type ANN for SH I.parison of the local overall heat transfer coefficient values desired andpredicted by[5-2-5-1]type ANN for SH II.Thesefigures show good agreement between the predicted and desired value.The neural networks correctly predict the local heat transfer coefficient for SH I and SH II.The ANN model can be easily used for calculation of overall heat transfer coefficient for membrane-walls and superheaters in the combustion chamber of a CFB boiler.Important feature is the fact, that it is the non-iterative procedure.Theflow chart of ANN appli-cation is shown in Fig.7.4.ConclusionsIn the present study,we have applied the ANN model to accu-rately determine the local overall heat transfer coefficient for the membrane-walls and superheaters SH I and SH II in the CFB boiler furnace.To train the network BP algorithm has been used.The model gives quick and accurate results for any input pattern of the boiler operating parameters(under different conditions).The data obtained using the ANN model are close to that from numer-ical calculations.Maximum relative error has been less than4%for membrane-walls and2%for superheaters.Some of them have been smaller than2%.The ANN model,especially with tangent sigmoid activation function,has been able to predict the local overall heat transfer coefficient accurately.It has been capable to generalize the depen-dence of the local overall heat transfer coefficient for membrane-walls and superheaters on boiler’s operational parameters.ANN could be very helpful tool for simulation the behavior and the opti-mization purposes of the examined systems.References[1]P.Basu,P.K.Nag,Heat transfer to walls of a circulatingfluidized-bed furnace,Chem.Eng.Sci.51(1)(1996)1–26.Review Article No48.[2]C.Breitholtz,B.Leckner,A.P.Baskakov,Wall average heat transfer in CFBboilers,Powder Technol.120(2001)41–48.[3]R.Divilio R.,T.J.Boyd,Practical implication of the effect of solids suspensiondensity on heat transfer in large scale CFB boilers,in:Proc.4th Int.Conf.Circulating Fluidized Beds,New York,AIChE,1994,pp.334–339.[4]W.C.Yang,Handbook of Fluidization and Fluid-Particle Systems,MarcelDekker Inc,2003.[5]O.Molerus,Fluid dynamics and its relevance for basic features of heat transferin circulatingfluidized beds,in:Proc.4th Int.Conf.Circulating Fluidized Beds, New York,AIChE,1994,pp.285–390.[6]P.Basu,Combustion of coal in circulatingfluidized-bed boilers:a review,Chem.Eng.Sci.54(1999)5547–5557.[7]S.A.Kalogirou,Applications of artificial neural networks in energy systems.Areview,Energy Convers.Manage.40(1999)1073–1087.[8]M.R.Jafari Nasr,A.Habibi Khalaj,S.H.Mozaffari,Modeling of heat transferenhancement by wire coil inserts using artificial neural network analysis,Appl.Therm.Eng.30(2010)143–151.[9]S.M.Pesteei,M.Mehrabi,Modeling of convection heat transfer of supercriticalcarbon dioxide in a vertical tube at low Reynolds numbers using artificial neural networks,mun.Heat Mass Transfer37(2010)901–906. [10]U.Kesgin,Genetic algorithm and artificial neural network for engineoptimization of efficiency and NOx emission,Fuel83(2004)885–895. [11]R.Karadag,O.Akgobek,The prediction of convective heat transfer infloor-heating systems by artificial neural networks,mun.Heat Mass Transfer35(2008)312–325.[12]S.S.Sablani,A neural network approach for non-iterative calculation of heattransfer coefficient influid-particle systems,Chem.Eng.Process.40(2001) 363–369.[13]J.Zhang,F.Haghighat,Development of artificial neural network based heatconvection algorithm for thermal simulation of large rectangular cross-sectional area Earth-to air heat exhangers,Energ.Build.42(2010)435–440.[14]T.Kwater,Z.Kedzior,B.Twarog,Estimation by artificial neural network inecological problems,in:Proc.AMSE-Conference MS’2001-Lviv(Ukraine)23–26May(2001)212–215.[15]R.Sekret,W.Nowak,Experimental investigations of heat transfer in acombustion chamber of a670MWt CFB boiler,in:Proc.19-th National Congress of Thermodynamicists,Poland,Gdansk-Sopot,(2005)1–8.[16]R.Sekret.Thermal and Flow Conditions and Pollutant Emissions In Large-ScaleCirculating Fluidized Bed Boilers,Silesian University of Technology,Poland, 1694,2005.[17]J.Krzywanski,T.Czakiert,W.Muskała,R.Sekret,W.Nowak,Modeling of solidfuels combustion in oxygen-enriched atmosphere in circulatingfluidized bed boiler.Part I.The mathematical model of fuel combustion in oxygen-enriched CFB environment,Fuel Process.Technol.91(2010)290–295.[18]J.Krzywanski,T.Czakiert,W.Muskala,R.Sekret,W.Nowak,Modeling of solidfuels combustion in oxygen-enriched atmosphere in circulatingfluidized bed boiler–Part II.Numerical simulations of heat transfer and gaseous pollutants emissions associated with coal combustion in O2/CO2and O2/N2atmospheres enriched with oxygen under circulatingfluidized bed conditions,Fuel Process.Technol.91(2010)364–368.[19]Q.Wang,G.Xie,M.Zeng,L.Luo,Prediction of heat transfer rates for shell-and-tube heat exchangers by artificial neural networks approach,J.Therm.Sci.15(3)(2006)257–262.[20]Z.Hao,C.Kefa,M.Jianbo,Combining neural network and genetic algorithms tooptimize low NO x pulverized coal combustion,Fuel80(2001)2163–2168. [21]Y.Miyamoto,Y.Kurosaki,H.Fujiyama, E.Nanbu,Dynamic characteristicanalysis and control for afluidized Bed incinerator,Control Engineering Practice,6(1998)1159–1168.[22]J.Krzywanski,W.Muskała,W.Nowak,Application of neural networks fordetermining of the convective heat transfer coefficient in a circulating fluidized bed,Power Eng.11(2008)761–764.[23]B.Muller,H.Keller,Neural networks for combustion process modelling,in:Proc.of the Int.Conf.EANN’96,London,UK,(1996),87–90.[24]anic,R.Karba,Neural network models for predictive control of a thermalplant,in:Proc.of the Int.Conf.EANN’96,London,UK,(1996),151–154. [25]F.C.Christo,A.R.Masri,E.M.Nebot,Utilising artificial neural network andrepro-modelling in turbulent combustion,in:Proc.of the IEEE Int.Conf.ICNN ’95,Perth,Western Australia,2(1995),911–916.[26]D.J.Park, B.E.Jun,J.H.Kim,Novel fast training algorithm for multilayerfeedforward neural network,Electron.Lett.28(6)(1992)543–544.[27]S.S.Sablani,A.Kacimov,J.Perret,A.S.Majumdar,A.Campo,Non-iterativeestimation of heat transfer coefficients using artificial neural network models, Int.J.Heat Mass Transfer48(2005)665–679.J.Krzywanski,W.Nowak/International Journal of Heat and Mass Transfer55(2012)4246–42534253。