PIRLS2011_Framework-Chapter1[1]
ITIL 2011新版培训笔记-概念定义列表

ITIL 2011 “ITILFND03 - Generic concepts and definitions” The purpose of this unit is to help the candidate to define some of the key terminology and explain the key concepts of service management. Specifically, candidates must be able to define and explain the following key concepts:=====================================================03-1. Utility and warranty (SS 2.1.6 )Utility -(ITIL Service Strategy) The functionality offered by a product or service to meet a particular need. Utility can be summarized as ‘what the service does’, and can be used to determine whether a service is able to meet its required outcomes, or is ‘fit for purpose’. The business value of an IT service is created by the combination of utility and warranty. See also service validation and testing.Warranty -(ITIL Service Strategy) Assurance that a product or service will meet agreed requirements. This may be a formal agreement such as a service level agreement or contract, or it may be a marketing message or brand image. Warranty refers to the ability of a service to be available when needed, to provide the required capacity, and to provide the required reliability in terms of continuity and security. Warranty can be summarized as ‘how the service is delivered’, and can be used to determine whether a service is ‘fit for use’. The business value of an IT service is created by the combination of utility and warranty. See also service validation and testing.03-2. Assets, resources and capabilities (SS 2.2.1)Asset –(ITIL Service Strategy) Any resource or capability. The assets of a service provider include anything that could contribute to the delivery of a service. Assets can be one of the following types: management, organization, process, knowledge, people, information, applications, infrastructure or financial capital. See also customer asset; service asset; strategic asset.Resource –(ITIL Service Strategy) A generic term that includes IT infrastructure, people, money or anything else that might help to deliver an IT service. Resources are considered to be assets of an organization. See also capability; service asset. Capability –(ITIL Service Strategy) The ability of an organization, person, process, application, IT service or other configuration item to carry out an activity. Capabilities are intangible assets of an organization. See also resource.03-3. Service portfolio (SS 4.2.4.1, Fig 4.14)(ITIL Service Strategy) The complete set of services that is managed by a service provider. The service portfolio is used to manage the entire lifecycle of all services, and includes three categories: service pipeline (proposed or in development), service catalogue (live or available for deployment), and retired services. See also customer agreement portfolio; service portfolio management.03-4. Service catalogue (both two-view and three-view types) (SD 4.2.4.5, Fig.4.4, Fig. 4.5)(ITIL Service Design) (ITIL Service Strategy) A database or structured document with information about all live IT services, including those available for deployment. The service catalogue is part of the service portfolio and contains information about two types of IT service: customer-facing services that are visible to the business; and supporting services required by the service provider to deliver customer-facing services. See also customer agreement portfolio; service catalogue management.03-5. Governance (SS 2.3.1)Ensures that policies and strategy are actually implemented, and that required processes are correctly followed. Governance includes defining roles and responsibilities, measuring and reporting, and taking actions to resolve any issues identified.03-6. Business case (SS 3.6.1.1)(ITIL Service Strategy) Justification for a significant item of expenditure. The business case includes information about costs, benefits, options, issues, risks and possible problems. See also cost benefit analysis.03-7. Risk management (SS 5.6.5.1, 5.6.5.2)The process responsible for identifying, assessing and controlling risks. Risk management is also sometimes used to refer to the second part of the overall process after risks have been identified and assessed, as in ‘risk assessment and management’. This process is not described in detail within the core ITIL publications. See also risk assessment.03-8. Service provider (SS 2.1.4)03-10. Supplier (SS 2.1.5)(ITIL Service Design) (ITIL Service Strategy) A third party responsible for supplying goods or services that are required to deliver IT services. Examples of suppliers include commodity hardware and software vendors, network and telecom providers, and outsourcing organizations. See also supply chain; underpinning contract.03-11. Service level agreement (SLA) (SD 4.3.4)(ITIL Continual Service Improvement) (ITIL Service Design) An agreement between an IT service provider and a customer. A service level agreement describes the IT service, documents service level targets, and specifies the responsibilities of the IT service provider and the customer. A single agreement may cover multiple IT services or multiple customers. See also operational level agreement.03-12. Operational level agreement (OLA) (SD 4.3.4)(ITIL Continual Service Improvement) (ITIL Service Design) An agreementbetween an IT service provider and another part of the same organization. Itsupports the IT service provider’s delivery of IT services to customers and defines the goods or services to be provided and the responsibilities of both parties. For example, there could be an operational level agreement:z Between the IT service provider and a procurement department to obtain hardware in agreed timesz Between the service desk and a support group to provide incident resolution in agreed times.See also service level agreement.03-13. Underpinning contract (SD 4.8.4.2)03-14. Service design package (SD Appendix A)(ITIL Service Design) Document(s) defining all aspects of an IT service and its requirements through each stage of its lifecycle. A service design package is produced for each new IT service, major change or IT service retirement.03-15. Availability (SD 4.4.4.3)(ITIL Service Design) Ability of an IT service or other configuration item to perform its agreed function when required. Availability is determined by reliability, maintainability, serviceability, performance and security. Availability is usually calculated as a percentage. This calculation is often based on agreed service time and downtime. It is best practice to calculate availability of an IT service using measurements of the business output.03-16. Service knowledge management system (SKMS) (ST 4.7.4.3)(ITIL Service Transition) A set of tools and databases that is used to manage knowledge, information and data. The service knowledge management system includes the configuration management system, as well as other databases and information systems. The service knowledge management system includes tools for collecting, storing, managing, updating, analysing and presenting all the knowledge, information and data that an IT service provider will need to managethe full lifecycle of IT services. See also knowledge management.03-17. Configuration item (CI) (ST 4.3.4.2)(ITIL Service Transition) Any component or other service asset that needs to be managed in order to deliver an IT service. Information about each configuration item is recorded in a configuration record within the configuration management system and is maintained throughout its lifecycle by service asset and configuration management. Configuration items are under the control of change management. They typically include IT services, hardware, software, buildings, people and formal documentation such as process documentation and service level agreements.03-18. Configuration management system (ST 4.3.4.3)(ITIL Service Transition) A set of tools, data and information that is used to support service asset and configuration management. The CMS is part of an overall service knowledge management system and includes tools for collecting, storing, managing, updating, analysing and presenting data about all configuration items and their relationships. The CMS may also include information about incidents, problems, known errors, changes and releases. The CMS is maintained by service asset and configuration management and is used by all IT service management processes. See also configuration management database.03-19. Definitive media library (DML) (ST 4.3.4.4)03-20. Change (ST 4.2.4.4)(ITIL Service Transition) The addition, modification or removal of anything that could have an effect on IT services. The scope should include changes to all architectures, processes, tools, metrics and documentation, as well as changes to IT services and other configuration items.03-21. Change types (standard, emergency and normal) (ST 4.2.4.3, 4.2.4.7, 4.2.5.11)Normal Change -(ITIL Service Transition) A change that is not an emergency change or a standard change. Normal changes follow the defined steps of the change management process.Standard Change -(ITIL Service Transition) A pre-authorized change that is low risk, relatively common and follows a procedure or work instruction – for example, a password reset or provision of standard equipment to a new employee. Requests for change are not required to implement a standard change, and they are logged and tracked using a different mechanism, such as a service request. See also change model.03-24. Event (SO 4.1 1st para)(ITIL Service Operation) A change of state that has significance for the management of an IT service or other configuration item. The term is also used to mean an alert or notification created by any IT service, configuration item or monitoring tool. Events typically require IT operations personnel to take actions, and often lead to incidents being logged.03-25. Alert (Glossary)(ITIL Service Operation) A notification that a threshold has been reached, something has changed, or a failure has occurred. Alerts are often created and managed by system management tools and are managed by the event management process.03-26. Incident (SO 4.2 1st para)(ITIL Service Operation) An unplanned interruption to an IT service or reduction in the quality of an IT service. Failure of a configuration item that has not yet affected service is also an incident – for example, failure of one disk from a mirror set.03-27. Impact, urgency and priority (SO 4.2.5.4)Impact -(ITIL Service Operation) (ITIL Service Transition) A measure of the effect of an incident, problem or change on business processes. Impact is often based on how service levels will be affected. Impact and urgency are used to assign priority. Urgency –(ITIL Service Design) (ITIL Service Transition) A measure of how long it will be until an incident, problem or change has a significant impact on the business. For example, a high-impact incident may have low urgency if the impact will not affect the business until the end of the financial year. Impact and urgency are used to assign priority.Priority –(ITIL Service Operation) (ITIL Service Transition) A category used to identify the relative importance of an incident, problem or change. Priority is based on impact and urgency, and is used to identify required times for actions to be taken. For example, the service level agreement may state that Priority 2 incidents must be resolved within 12 hours.03-28. Service request (SO 4.3 1st para)(ITIL Service Operation) A formal request from a user for something to be provided – for example, a request for information or advice; to reset a password; or to install a workstation for a new user. Service requests are managed by the request fulfilment process, usually in conjunction with the service desk. Service requests may be linked to a request for change as part of fulfilling the request.03-29. Problem (SO 4.4 1st para)(ITIL Service Operation) A cause of one or more incidents. The cause is not usually known at the time a problem record is created, and the problem management process is responsible for further investigation.03-30. Workaround (SO 4.4.5.6)(ITIL Service Operation) Reducing or eliminating the impact of an incident or problem for which a full resolution is not yet available – for example, by restarting a failed configuration item. Workarounds for problems are documented in known error records. Workarounds for incidents that do not have associated problem records are documented in the incident record.03-31. Known error (SO 4.4.5.7)(ITIL Service Operation) A problem that has a documented root cause and a workaround. Known errors are created and managed throughout their lifecycle by problem management. Known errors may also be identified by development or suppliers.03-32. Known error database (KEDB) (SO 4.4.7.2)03-33. The role of communication in service operation (SO 3.6)03-35. Release policy (ST 4.1.4.2)03-36. Types of services (SS 3.2.2.4, Tab 3.5)03-37. Change proposals (ST 4.2.4.6)(ITIL Service Strategy) (ITIL Service Transition) A document that includes a high level description of a potential service introduction or significant change, along with a corresponding business case and an expected implementation schedule. Change proposals are normally created by the service portfolio management process and are passed to change management for authorization. Change management will review the potential impact on other services, on shared resources, and on the overall change schedule. Once the change proposal has been authorized, service portfolio management will charter the service.03-38. CSI register (CSI 3.4)(ITIL Continual Service Improvement) A database or structured document used to record and manage improvement opportunities throughout their lifecycle.03-39. Outcomes (SS 2.1.1)The result of carrying out an activity, following a process, or delivering an IT service etc. The term is used to refer to intended results as well as to actual results. See also objective.03-40. Patterns of business activity (PBA) (SS 4.4.5.2)(ITIL Service Strategy) A workload profile of one or more business activities. Patterns of business activity are used to help the IT service provider understand and plan for different levels of business activity. See also user profile.03-41. Customers and users (SS 2.1.5)Customer -Someone who buys goods or services. The customer of an IT service provider is the person or group who defines and agrees the service level targets. The term is also sometimes used informally to mean user – for example, ‘This is a customer-focused organization.’User -A person who uses the IT service on a day-to-day basis. Users are distinct from customers, as some customers do not use the IT service directly.03-42. The Deming Cycle (plan, do, check, act) (CSI 3.8, Fig 2.8)(ITIL Continual Service Improvement) A four-stage cycle for process management, attributed to Edward Deming. Plan-Do-Check-Act is also called the Deming Cycle. Plan– design or revise processes that support the IT services; Do – implement the plan and manage the processes; Check – measure the processes and IT services, compare with objectives and produce reports; Act– plan and implement changes to improve the processes.。
框架结构外文文献

Seismic Collapse Safety of Reinforced ConcreteBuildings.II:Comparative Assessment of Nonductile and Ductile Moment FramesAbbie B.Liel,M.ASCE 1;Curt B.Haselton,M.ASCE 2;and Gregory G.Deierlein,F.ASCE 3Abstract:This study is the second of two companion papers to examine the seismic collapse safety of reinforced concrete frame buildings,and examines nonductile moment frames that are representative of those built before the mid-1970s in California.The probabilistic assessment relies on nonlinear dynamic simulation of structural response to calculate the collapse risk,accounting for uncertainties in ground-motion characteristics and structural modeling.The evaluation considers a set of archetypical nonductile RC frame structures of varying height that are designed according to the seismic provisions of the 1967Uniform Building Code.The results indicate that nonductile RC frame structures have a mean annual frequency of collapse ranging from 5to 14×10À3at a typical high-seismic California site,which is approximately 40times higher than corresponding results for modern code-conforming special RC moment frames.These metrics demonstrate the effectiveness of ductile detailing and capacity design requirements,which have been introduced over the past 30years to improve the safety of RC buildings.Data on comparative safety between nonductile and ductile frames may also inform the development of policies for appraising and mitigating seismic collapse risk of existing RC frame buildings.DOI:10.1061/(ASCE)ST.1943-541X .0000275.©2011American Society of Civil Engineers.CE Database subject headings:Structural failures;Earthquake engineering;Structural reliability;Reinforced concrete;Concrete structures;Seismic effects;Frames.Author keywords:Collapse;Earthquake engineering;Structural reliability;Reinforced concrete structures;Buildings;Commercial;Seismic effects.IntroductionReinforced concrete (RC)frame structures constructed in Califor-nia before the mid-1970s lack important features of good seismic design,such as strong columns and ductile detailing of reinforce-ment,making them potentially vulnerable to earthquake-induced collapse.These nonductile RC frame structures have incurred significant earthquake damage in the 1971San Fernando,1979Imperial Valley,1987Whittier Narrows,and 1994Northridge earthquakes in California,and many other earthquakes worldwide.These factors raise concerns that some of California ’s approxi-mately 40,000nonductile RC structures may present a significant hazard to life and safety in future earthquakes.However,data are lacking to gauge the significance of this risk,in relation to either the building population at large or to specific buildings.The collapse risk of an individual building depends not only on the building code provisions employed in its original design,but also structuralconfiguration,construction quality,building location,and site-spe-cific seismic hazard information.Apart from the challenges of ac-curately evaluating the collapse risk is the question of risk tolerance and the minimum level of safety that is appropriate for buildings.In this regard,comparative assessment of buildings designed accord-ing to old versus modern building codes provides a means of evalu-ating the level of acceptable risk implied by current design practice.Building code requirements for seismic design and detailing of reinforced concrete have changed significantly since the mid-1970s,in response to observed earthquake damage and an in-creased understanding of the importance of ductile detailing of reinforcement.In contrast to older nonductile RC frames,modern code-conforming special moment frames for high-seismic regions employ a variety of capacity design provisions that prevent or delay unfavorable failure modes such as column shear failure,beam-column joint failure,and soft-story mechanisms.Although there is general agreement that these changes to building code require-ments are appropriate,there is little data to quantify the associated improvements in seismic safety.Performance-based earthquake engineering methods are applied in this study to assess the likelihood of earthquake-induced collapse in archetypical nonductile RC frame structures.Performance-based earthquake engineering provides a probabilistic framework for re-lating ground-motion intensity to structural response and building performance through nonlinear time-history simulation (Deierlein 2004).The evaluation of nonductile RC frame structures is based on a set of archetypical structures designed according to the pro-visions of the 1967Uniform Building Code (UBC)(ICBO 1967).These archetype structures are representative of regular well-designed RC frame structures constructed in California between approximately 1950and 1975.Collapse is predicted through1Assistant Professor,Dept.of Civil,Environmental and Architectural Engineering,Univ.of Colorado,Boulder,CO 80309.E-mail:abbie .liel@ 2Assistant Professor,Dept.of Civil Engineering,California State Univ.,Chico,CA 95929(corresponding author).E-mail:chaselton@csuchico .edu 3Professor,Dept.of Civil and Environmental Engineering,Stanford Univ.,Stanford,CA 94305.Note.This manuscript was submitted on July 14,2009;approved on June 30,2010;published online on July 15,2010.Discussion period open until September 1,2011;separate discussions must be submitted for individual papers.This paper is part of the Journal of Structural Engineer-ing ,V ol.137,No.4,April 1,2011.©ASCE,ISSN 0733-9445/2011/4-492–502/$25.00.492/JOURNAL OF STRUCTURAL ENGINEERING ©ASCE /APRIL 2011D o w n l o a d e d f r o m a s c e l i b r a r y .o r g b y S u l t a n Q a b o o s U n i v e r s i t y o n 06/21/14. C o p y r i g h t A S CE .F o r p e r s o n a l u s e o n l y ; a l l r i g h t s r e s e r v e d .nonlinear dynamic analysis of the archetype nonductile RC frames,using simulation models capable of capturing the critical aspects of strength and stiffness deterioration as the structure collapses.The outcome of the collapse performance assessment is a set of measures of building safety and relating seismic collapse resistance to seismic hazard.These results are compared with the metrics for ductile RC frames reported in a companion paper (Haselton et al.2011b ).Archetypical Reinforced Concrete Frame StructuresThe archetype nonductile RC frame structures represent the expected range in design and performance in California ’s older RC frame buildings,considering variations in structural height,configuration and design details.The archetype configurations explore key design parameters for RC components and frames,which were identified through previous analytical and experimental studies reviewed by Haselton et al.(2008).The complete set of archetype nonductile RC frame buildings developed for this study includes 26designs (Liel and Deierlein 2008).This paper focuses primarily on 12of these designs,varying in height from two to 12stories,and including both perimeter (P )and space (S )frame lateral resisting systems with alternative design details.All archetype buildings are designed for office occupancies with an 8-in.(20-cm)flat-slab floor system and 25-ft (7.6-m)column spacing.The 2-and 4-story buildings have a footprint of 125ft by 175ft (38.1m by 53.3m),and the 8-and 12-story buildings measure 125ft (38.1m)square in plan.Story heights are 15ft (4.6m)in the first story and 13ft (4.0m)in all other stories.Origi-nal structural drawings for RC frame buildings constructed in California in the 1960s were used to establish typical structural configurations and geometry for archetype structures (Liel and Deierlein 2008).The archetypes are limited to RC moment frames without infill walls,and are regular in elevation and plan,without major strength or stiffness irregularities.The nonductile RC archetype structures are designed for the highest seismic zone in the 1967UBC,Zone 3,which at that time included most of California.Structural designs of two-dimensional frames are governed by the required strength and stiffness to satisfy gravity and seismic loading combinations.The designs also satisfy all relevant building code requirements,including maximum and minimum reinforcement ratios and maximum stirrup spacing.The 1967UBC permitted an optional reduction in the design base shear if ductile detailing requirements were employed,however,this reduction is not applied and only standard levels of detailing are considered in this study.Design details for each structure areTable 1.Design Characteristics of Archetype Nonductile and Ductile RC Frames Stucture Design base shear coefficient a,bColumn size c (in :×in.)Column reinforcementratio,ρColumn hoop spacing d,e (in.)Beam size f (in :×in.)Beam reinforcementratios ρ(ρ0)Beam hoop spacing (in.)Nonductile2S 0.08624×240.0101224×240.006(0.011)112P 0.08630×300.0151530×300.003(0.011)114S 0.06820×200.0281020×260.007(0.014)124P 0.06824×280.0331424×320.007(0.009)158S 0.05428×280.0141424×260.006(0.013)118P 0.05430×360.0331526×360.008(0.010)1712S 0.04732×320.025926×300.006(0.011)1712P 0.04732×400.032930×380.006(0.013)184S g 0.06820×200.028 6.720×260.007(0.014)84S h 0.06820×200.0281020×260.007(0.014)1212S g 0.04732×320.025626×300.006(0.011)1112S h 0.04732×320.025926×300.006(0.011)17Ductile2S 0.12522×220.017518×220.006(0.012) 3.52P 0.12528×300.018528×280.007(0.008)54S 0.09222×220.016522×240.004(0.008)54P 0.09232×380.016 3.524×320.011(0.012)58S 0.05022×220.011422×220.006(0.011) 4.58P 0.05026×340.018 3.526×300.007(0.008)512S 0.04422×220.016522×280.005(0.008)512P0.04428×320.0223.528×380.006(0.007)6aThe design base shear coefficient in the 1967UBC is given by C ¼0:05=T ð1=3Þ≤0:10.For moment resisting frames,T ¼0:1N ,where N is the number of stories (ICBO 1967).bThe design base shear coefficient for modern buildings depends on the response spectrum at the site of interest.The Los Angeles site has a design spectrumdefined by S DS ¼1:0g and S D1¼0:60g.The period used in calculation of the design base shear is derived from the code equation T ¼0:016h 0:9n ,where h n isthe height of the structure in feet,and uses the coefficient for upper limit of calculated period (C u ¼1:4)(ASCE 2002).cColumn properties vary over the height of the structure and are reported here for an interior first-story column.dConfiguration of transverse reinforcement in each member depends on the required shear strength.There are at least two No.3bars at every location.eConfiguration of transverse reinforcement in ductile RC frames depends on the required shear strength.All hooks have seismic detailing and use No.4bars (ACI 2005).fBeam properties vary over the height of the structure and are reported here are for a second-floor beam.gThese design variants have better-than-average beam and column detailing.hThese design variants have better-than-average joint detailing.JOURNAL OF STRUCTURAL ENGINEERING ©ASCE /APRIL 2011/493D o w n l o a d e d f r o m a s c e l i b r a r y .o r g b y S u l t a n Q a b o o s U n i v e r s i t y o n 06/21/14. C o p y r i g h t A S CE .F o r p e r s o n a l u s e o n l y ; a l l r i g h t s r e s e r v e d .summarized in Table 1,and complete documentation of the non-ductile RC archetypes is available in Liel and Deierlein (2008).Four of the 4-and 12-story designs have enhanced detailing,as described subsequently.The collapse performance of archetypical nonductile RC frame structures is compared to the set of ductile RC frame archetypes presented in the companion paper (Haselton et al.2011b ).As sum-marized in Table 2,these ductile frames are designed according to the provisions of the International Building Code (ICC 2003),ASCE 7(ASCE 2002),and ACI 318(ACI 2005);and meet all gov-erning code requirements for strength,stiffness,capacity design,and detailing for special moment frames.The structures benefit from the provisions that have been incorporated into seismic design codes for reinforced concrete since the 1970s,including an assort-ment of capacity design provisions [e.g.,strong column-weak beam (SCWB)ratios,beam-column and joint shear capacity design]and detailing improvements (e.g.,transverse confinement in beam-column hinge regions,increased lap splice requirements,closed hooks).The ductile RC frames are designed for a typical high-seismic Los Angeles site with soil class S d that is located in the transition region of the 2003IBC design maps (Haselton and Deierlein 2007).A comparison of the structures described in Table 1reflects four decades of changes to seismic design provisions for RC moment frames.Despite modifications to the period-based equation for design base shear,the resulting base shear coefficient is relatively similar for nonductile and ductile RC frames of the same height,except in the shortest structures.More significant differencesbetween the two sets of buildings are apparent in member design and detailing,especially in the quantity,distribution,and detailing of transverse reinforcement.Modern RC frames are subject to shear capacity design provisions and more stringent limitations on stirrup spacing,such that transverse reinforcement is spaced two to four times more closely in ductile RC beams and columns.The SCWB ratio enforces minimum column strengths to delay the formation of story mechanisms.As a result,the ratio of column to beam strength at each joint is approximately 30%higher (on average)in the duc-tile RC frames than the nonductile RC frames.Nonductile RC frames also have no special provision for design or reinforcement of the beam-column joint region,whereas columns in ductile RC frames are sized to meet joint shear demands with transverse reinforcement in the joints.Joint shear strength requirements in special moment frames tend to increase the column size,thereby reducing axial load ratios in columns.Nonlinear Simulation ModelsNonlinear analysis models for each archetype nonductile RC frame consist of a two-dimensional three-bay representation of the lateral resisting system,as shown in Fig.1.The analytical model repre-sents material nonlinearities in beams,columns,beam-column joints,and large deformation (P -Δ)effects that are important for simulating collapse of frames.Beam and column ends and the beam-column joint regions are modeled with member end hinges that are kinematically constrained to represent finite joint sizeTable 2.Representative Modeling Parameters in Archetype Nonductile and Ductile RC Frame Structures Structure Axial load a,b (P =A g f 0c )Initial stiffness c Plastic rotation capacity (θcap ;pl ,rad)Postcapping rotation capacity (θpc ,rad)Cyclicdeterioration d (λ)First mode period e (T 1,s)Nonductile2S 0.110:35EI g 0.0180.04041 1.12P 0.030:35EI g 0.0170.05157 1.04S 0.300:57EI g 0.0210.03333 2.04P 0.090:35EI g 0.0310.10043 2.08S 0.310:53EI g 0.0130.02832 2.28P 0.110:35EI g 0.0250.10051 2.412S 0.350:54EI g 0.0290.06353 2.312P 0.140:35EI g 0.0450.10082 2.84S f 0.300:57EI g 0.0320.04748 2.04S g 0.300:57EI g 0.0210.03333 2.012S f 0.350:54EI g 0.0430.09467 2.312S g 0.350:54EI g 0.0290.06353 2.3Ductile2S 0.060:35EI g 0.0650.100870.632P 0.010:35EI g 0.0750.1001110.664S 0.130:38EI g 0.0570.100800.944P 0.020:35EI g 0.0860.100133 1.18S 0.210:51EI g 0.0510.10080 1.88P 0.060:35EI g 0.0870.100122 1.712S 0.380:68EI g 0.0360.05857 2.112P0.070:35EI g0.0700.1001182.1a Properties reported for representative interior column in the first story.(Column model properties data from Haselton et al.2008.)bExpected axial loads include the unfactored dead load and 25%of the design live load.cEffective secant stiffness through 40%of yield strength.dλis defined such that the hysteretic energy dissipation capacity is given by Et ¼λM y θy (Haselton et al.2008).eObtained from eigenvalue analysis of frame model.fThese design variants have better-than-average beam and column detailing.gThese design variants have better-than-average joint detailing.494/JOURNAL OF STRUCTURAL ENGINEERING ©ASCE /APRIL 2011D o w n l o a d e d f r o m a s c e l i b r a r y .o r g b y S u l t a n Q a b o o s U n i v e r s i t y o n 06/21/14. C o p y r i g h t A S CE .F o r p e r s o n a l u s e o n l y ; a l l r i g h t s r e s e r v e d .effects and connected to a joint shear spring (Lowes and Altoontash 2003).The structural models do not include any contribution from nonstructural components or from gravity-load resisting structural elements that are not part of the lateral resisting system.The model is implemented in OpenSees with robust convergence algorithms (OpenSees 2009).As in the companion paper,inelastic beams,columns,and joints are modeled with concentrated springs idealized by a trilinear back-bone curve and associated hysteretic rules developed by Ibarra et al.(2005).Properties of the nonlinear springs representing beam and column elements are predicted from a series of empirical relation-ships relating column design characteristics to modeling parame-ters and calibrated to experimental data for RC columns (Haselton et al.2008).Tests used to develop empirical relationships include a large number of RC columns with nonductile detailing,and predicted model parameters reflect the observed differences in moment-rotation behavior between nonductile and ductile RC elements.As in the companion paper,calibration of model param-eters for RC beams is established on columns tested with low axial load levels because of the sparse available beam data.Fig.2(a)shows column monotonic backbone curve properties for a ductile and nonductile column (each from a 4-story building).The plastic rotation capacity θcap ;pl ,which is known to have an important influence on collapse prediction,is a function of the amount of column confinement reinforcement and axial load levels,and is approximately 2.7times greater for the ductile RC column.The ductile RC column also has a larger postcapping rotation capacity (θpc )that affects the rate of postpeak strength degradation.Fig.2(b)illustrates cyclic deterioration of column strength and stiffness under a typical loading protocol.Cyclic degradation of the initial backbone curve is controlled by the deterioration parameter λ,which is a measure of the energy dissipation capacity and is smaller in nonductile columns because of poor confinement and higher axial loads.Model parameters are calibrated to the expected level of axial compression in columns because of gravity loads and do not account for axial-flexure-shear interaction during the analysis,which may be significant in taller buildings.Modeling parameters for typical RC columns in nonductile and ductile archetypes are summarized in Table 2.Properties for RC beams are similar and reported elsewhere (Liel and Deierlein 2008;Haselton and Deierlein 2007).All element model properties are calibrated to median values of test data.Although the hysteretic beam and column spring parameters incorporate bond-slip at the member ends,they do not account for significant degradations that may occur because of anchorage or splice failure in nonductile frames.Unlike ductile RC frames,in which capacity design require-ments limit joint shear deformations,nonductile RC frames may experience significant joint shear damage contributing to collapse (Liel and Deierlein 2008).Joint shear behavior is modeled with an inelastic spring,as illustrated in Fig.1and defined by a monotonic backbone and hysteretic rules (similar to those shown in Fig.2for columns).The properties of the joint shear spring are on the basisofFig.1.Schematic of the RC frame structural analysismodel(a)(b)Fig.2.Properties of inelastic springs used to model ductile and non-ductile RC columns in the first story of a typical 4-story space frame:(a)monotonic behavior;(b)cyclic behaviorJOURNAL OF STRUCTURAL ENGINEERING ©ASCE /APRIL 2011/495D o w n l o a d e d f r o m a s c e l i b r a r y .o r g b y S u l t a n Q a b o o s U n i v e r s i t y o n 06/21/14. C o p y r i g h t A S CE .F o r p e r s o n a l u s e o n l y ; a l l r i g h t s r e s e r v e d .selected subassembly data of joints with minimal amounts of trans-verse reinforcement and other nonductile characteristics.Unfortu-nately,available data on nonconforming joints are limited.Joint shear strength is computed using a modified version of the ACI 318equation (ACI 2005),and depends on joint size (b j is joint width,h is height),concrete compressive strength (f 0c ,units:psi),and confinement (γ,which is 12to 20depending on the configu-ration of confining beams)such that V ¼0:7γffiffiffiffif 0c p b j h .The 0.7modification factor is on the basis of empirical data from Mitra and Lowes (2007)and reflects differences in shear strength between seismically detailed joints (as assumed in ACI 318Chap.21)and joints without transverse reinforcement,of the type consid-ered in this study.Unlike conforming RC joints,which are assumed to behave linear elastically,nonductile RC joints have limited duc-tility,and shear plastic deformation capacity is assumed to be 0.015and 0.010rad for interior and exterior joints,respectively (Moehle et al.2006).For joints with axial load levels below 0.095,data from Pantelides et al.(2002)are used as the basis for a linear increase in deformation capacity (to a maximum of 0.025at zero axial load).Limited available data suggest a negative postcapping slope of approximately 10%of the effective initial stiffness is appropriate.Because of insubstantial data,cyclic deterioration properties are assumed to be the same as that for RC beams and columns.The calculated elastic fundamental periods of the RC frame models,reported in Table 2,reflect the effective “cracked ”stiffness of the beams and columns (35%of EI g for RC beams;35%to 80%of EI g for columns),finite joint sizes,and panel zone flexibility.The effective member stiffness properties are determined on the basis of deformations at 40%of the yield strength and include bond-slip at the member ends.The computed periods are signifi-cantly larger than values calculated from simplified formulas in ASCE (2002)and other standards,owing to the structural modeling assumptions (specifically,the assumed effective stiffness and the exclusion of the gravity-resisting system from the analysis model)and intentional conservatism in code-based formulas for building period.Nonlinear static (pushover)analysis of archetype analysis mod-els shows that the modern RC frames are stronger and have greater deformation capacities than their nonductile counterparts,as illus-trated in Fig.3.The ASCE 7-05equivalent seismic load distribu-tion is applied in the teral strength is compared on the basis of overstrength ratio,Ω,defined as the ratio between the ultimate strength and the design base shear.The ductility is com-pared on the basis of ultimate roof drift ratio (RDR ult ),defined as the roof drift ratio at which 20%of the lateral strength of the structure has been lost.As summarized in Table 3,for the archetype designs in this study,the ductile RC frames have approximately 40%more overstrength and ultimate roof drift ratios three times larger than the nonductile RC frames.The larger structural deformation capacity and overstrength in the ductile frames results from (1)greater deformation capacity in ductile versus nonductile RC components (e.g.,compare column θcap ;pl and θpc in Table 2),(2)the SCWB requirements that promote more distributed yielding over multiple stories in the ductile frames,(3)the larger column strengths in ductile frames that result from the SCWB and joint shear strength requirements,and (4)the required ratios of positive and negative bending strength of the beams in the ductile frames.Fig.3(b)illustrates the damage concentration in lower stories,especially in the nonductile archetype structures.Whereas nonlin-ear static methods are not integral to the dynamic collapse analyses,the pushover results help to relate the dynamic collapse analysis results,described subsequently,and codified nonlinear static assessment procedures.Collapse Performance Assessment ProcedureSeismic collapse performance assessment for archetype nonductile RC frame structures follows the same procedure as in the companion study of ductile RC frames (Haselton et al.2011b ).The collapse assessment is organized using incremental dynamic analysis (IDA)of nonlinear simulation models,where each RC frame model is subjected to analysis under multiple ground motions that are scaled to increasing amplitudes.For each ground motion,collapse is defined on the basis of the intensity (spectral acceleration at the first-mode period of the analysis model)of the input ground motion that results in structural collapse,as iden-tified in the analysis by excessive interstory drifts.The IDA is repeated for each record in a suite of 80ground motions,whose properties along with selection and scaling procedures are de-scribed by Haselton et al.(2011b ).The outcome of this assessment is a lognormal distribution (median,standard deviation)relating that structure ’s probability of collapse to the ground-motion inten-sity,representing a structural collapse fragility function.Uncer-tainty in prediction of the intensity at which collapse occurs,termed “record-to-record ”uncertainty (σln ;RTR ),is associated with variation in frequency content and other characteristics of ground-motion records.Although the nonlinear analysis model for RC frames can simulate sidesway collapse associated with strength and stiffness degradation in the flexural hinges of the beams andcolumnsFig.3.Pushover analysis of ductile and nonductile archetype 12-story RC perimeter frames:(a)force-displacement response;and (b)distri-bution of interstory drifts at the end of the analysis496/JOURNAL OF STRUCTURAL ENGINEERING ©ASCE /APRIL 2011D o w n l o a d e d f r o m a s c e l i b r a r y .o r g b y S u l t a n Q a b o o s U n i v e r s i t y o n 06/21/14. C o p y r i g h t A S CE .F o r p e r s o n a l u s e o n l y ; a l l r i g h t s r e s e r v e d .and beam-column joint shear deformations,the analysis model does not directly capture column shear failure.The columns in the archetype buildings in this study are expected to yield first in flexure,followed by shear failure (Elwood and Moehle 2005)rather than direct shear failure,as may be experienced by short,squat nonductile RC columns.However,observed earthquake damage and laboratory studies have shown that shear failure and subsequent loss of gravity-load-bearing capacity in one column could lead to progressive collapse in nonductile RC frames.Column shear failure is not incorporated directly because of the difficulties in accurately simulating shear or flexure-shear failure and subsequent loss of axial load-carrying capacity (Elwood 2004).Collapse modes related to column shear failure are therefore detected by postprocessing dynamic analysis results using compo-nent limit state ponent limit state functions are devel-oped from experimental data on nonductile beam-columns and predict the median column drift ratio (CDR)at which shear failure,and the subsequent loss of vertical-load-carrying capacity,will occur.Here,CDR is defined similarly to interstory drift ratio,but excludes the contribution of beam rotation and joint deforma-tion to the total drift because the functions are established on data from column component tests.Component fragility relationships for columns failing in flexure-shear developed by Aslani and Miranda (2005),building on work by Elwood (2004),are employed in this study.For columns with nonductile shear design and detailing in this study and axial load ratios of P =A g f 0c between 0.03and 0.35,Aslani and Miranda (2005)predict that shear failure occurs at a median CDR between 0.017and 0.032rad,depending on the properties of the column,and the deformation capacity decreases with increasing axial load.Sub-sequent loss of vertical-carrying capacity in a column is predicted to occur at a median CDR between 0.032and 0.10rad,again depending on the properties of the column.Since the loss of vertical-load-carrying capacity of a column may precipitate progressive structure collapse,this damage state is defined as collapse in this assessment.In postprocessing dynamic analysis results,the vertical collapse limit state is reached if,during the analysis,the drift in any column exceeds the median value of that column ’s component fragility function.If the vertical collapse mode is predicted to occur at a smaller ground-motion intensity than the sidesway collapse mode (for a particular record),then the collapse statistics are updated.This simplified approach can be shown to give comparable median results to convolving the probability distribution of column drifts experienced as a function of ground-motion intensity (engineering demands)with the com-ponent fragility curve (capacity).The total uncertainty in the col-lapse fragility is assumed to be similar in the sidesway-only case and the sidesway/axial collapse case,as it is driven by modeling and record-to-record uncertainties rather than uncertainty in the component fragilities.Incorporating this vertical collapse limit state has the effect of reducing the predicted collapse capacity of the structure.Fig.4illustrates the collapse fragility curves for the 8-story RC space frame,with and without consideration of shear failure and axial failure following shear.As shown,if one considers collapse to occur with column shear failure,then the collapse fragility can reduce considerably compared to the sidesway collapse mode.However,if one assumes that shear failure of one column does not constitute collapse and that collapse is instead associated with the loss in column axial capacity,then the resulting collapse capac-ity is only slightly less than calculations for sidesway alone.For the nonductile RC frame structures considered in this study,the limit state check for loss of vertical-carrying capacity reduces the median collapse capacity by 2%to 30%as compared to the sidesway collapse statistics that are computed without this check (Liel and Deierlein 2008).Table 3.Results of Collapse Performance Assessment for Archetype Nonductile and Ductile RC Frame Structures Structure ΩRDR ult Median Sa ðT 1Þ(g)Sa 2=50ðT 1Þ(g)Collapse marginλcollapse ×10À4IDR collapse RDR collapseNonductile 2S 1.90.0190.470.800.591090.0310.0172P 1.60.0350.680.790.85470.0400.0284S 1.40.0160.270.490.541070.0540.0284P 1.10.0130.310.470.661000.0370.0178S 1.60.0110.290.420.68640.0420.0118P 1.10.0070.230.310.751350.0340.00912S 1.90.0100.290.350.83500.0340.00612P 1.10.0050.240.420.561190.0310.0064S a 1.40.0160.350.490.72380.0560.0244S b 1.60.0180.290.490.60890.0610.02612S a 1.90.0120.330.350.93350.0390.00912S b 2.20.0120.460.351.32160.0560.012Ductile 2S 3.50.085 3.55 1.16 3.07 1.00.0970.0752P 1.80.0672.48 1.13 2.193.40.0750.0614S 2.70.047 2.220.87 2.56 1.70.0780.0504P 1.60.038 1.560.77 2.04 3.60.0850.0478S 2.30.028 1.230.54 2.29 2.40.0770.0338P 1.60.023 1.000.57 1.77 6.30.0680.02712S 2.10.0220.830.44 1.914.70.0550.01812P1.70.0260.850.471.845.20.0530.016a These design variants have better-than-average beam and column detailing.bThese design variants have better-than-average joint detailing.JOURNAL OF STRUCTURAL ENGINEERING ©ASCE /APRIL 2011/497D o w n l o a d e d f r o m a s c e l i b r a r y .o r g b y S u l t a n Q a b o o s U n i v e r s i t y o n 06/21/14. C o p y r i g h t A S CE .F o r p e r s o n a l u s e o n l y ; a l l r i g h t s r e s e r v e d .。
质量管理系统与CAPA

2011年第一章1.1 Quality System and CAPAA quality system is a set of formalized business practices that definemanagement responsibilities for organizational structure, processes,procedures, and resources needed to fulfill product or service requirements, customer satisfaction, and continuous improvement.a quality system dictates how quality policies are implemented and quality objectives are achieved.A quality system dictates how quality policies are implemented.The organization must continuously improve the effectiveness and efficacy of its QMS through the use of its quality policy, quality objectives, audit results, analysis of data, corrective and preventive actions, and the management review processes.Analyzing data is essentialMonitoring dataMeasuring data --------- -------->Customer satisfactionConforming product/services requirementTrends of processes and product( opportunity for PA)CAPA System 三要素:1)Corrective Action: correct the cause of identified problems; eliminate permanently the cause; finding the cause--->necessary actions to avoid reoccurrence.2)Preventive Action: aimed at preventing the occurence of potential problems.3)Correction of the Problem质量体系(QS)是不断改进,提升系统、流程、产品CAPA则是识别QS中问题/潜在问题,采取必要步骤解决,防止再发生的机制。
2011Improvements of data embedding in DCT compressed domain
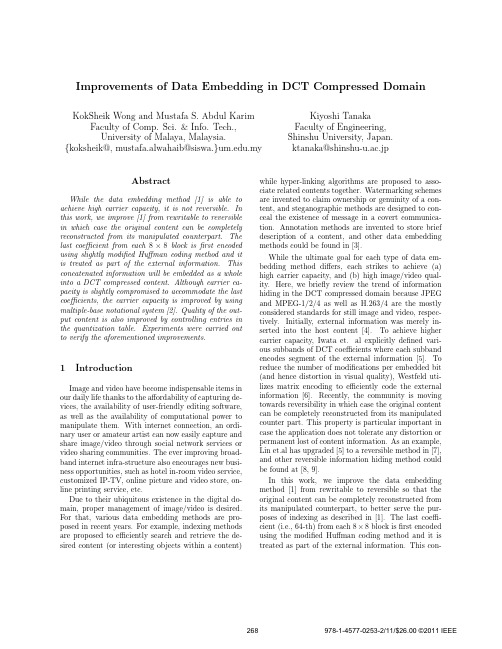
Improvements of Data Embedding in DCT Compressed DomainKokSheik Wong and Mustafa S.Abdul Karim Faculty of Comp.Sci.&Info.Tech.,University of Malaya,Malaysia. {koksheik@,mustafa.alwahaib@siswa.}.myKiyoshi Tanaka Faculty of Engineering, Shinshu University,Japan. ktanaka@shinshu-u.ac.jpAbstractWhile the data embedding method[1]is able to achieve high carrier capacity,it is not reversible.In this work,we improve[1]from rewritable to reversible in which case the original content can be completely reconstructed from its manipulated counterpart.The last coefficient from each8×8block isfirst encoded using slightly modified Huffman coding method and it is treated as part of the external information.This concatenated information will be embedded as a whole into a DCT compressed content.Although carrier ca-pacity is slightly compromised to accommodate the last coefficients,the carrier capacity is improved by using multiple-base notational system[2].Quality of the out-put content is also improved by controlling entries in the quantization table.Experiments were carried out to verify the aforementioned improvements.1IntroductionImage and video have become indispensable items in our daily life thanks to the affordability of capturing de-vices,the availability of user-friendly editing software, as well as the availability of computational power to manipulate them.With internet connection,an ordi-nary user or amateur artist can now easily capture and share image/video through social network services or video sharing communities.The ever improving broad-band internet infra-structure also encourages new busi-ness opportunities,such as hotel in-room video service, customized IP-TV,online picture and video store,on-line printing service,etc.Due to their ubiquitous existence in the digital do-main,proper management of image/video is desired. For that,various data embedding methods are pro-posed in recent years.For example,indexing methods are proposed to efficiently search and retrieve the de-sired content(or interesting objects within a content)while hyper-linking algorithms are proposed to asso-ciate related contents together.Watermarking schemes are invented to claim ownership or genuinity of a con-tent,and steganographic methods are designed to con-ceal the existence of message in a covert communica-tion.Annotation methods are invented to store brief description of a content,and other data embedding methods could be found in[3].While the ultimate goal for each type of data em-bedding method differs,each strikes to achieve(a) high carrier capacity,and(b)high image/video qual-ity.Here,we briefly review the trend of information hiding in the DCTcompressed domain because JPEG and MPEG-1/2/4as well as H.263/4are the mostly considered standards for still image and video,respec-tively.Initially,external information was merely in-serted into the host content[4].To achieve higher carrier capacity,Iwata et.al explicitly defined vari-ous subbands of DCTcoefficients where each subband encodes segment of the external information[5].To reduce the number of modifications per embedded bit (and hence distortion in visual quality),Westfeld uti-lizes matrix encoding to efficiently code the external information[6].Recently,the community is moving towards reversibility in which case the original content can be completely reconstructed from its manipulated counter part.This property is particular important in case the application does not tolerate any distortion or permanent lost of content information.As an example, Lin et.al has upgraded[5]to a reversible method in[7], and other reversible information hiding method could be found at[8,9].In this work,we improve the data embedding method[1]from rewritable to reversible so that the original content can be completely reconstructed from its manipulated counterpart,to better serve the pur-poses of indexing as described in[1].The last coeffi-cient(i.e.,64-th)from each8×8block isfirst encoded using the modified Huffman coding method and it is treated as part of the external information.This con-block B(i,j)block B’(i,j) Figure1.Embedding mechanism of[1]for encoding‘11’catenated information will be embedded as a whole into a DCTcompressed content.Although carrier capac-ity is slightly compromised to accommodate the64-th coefficients,the carrier capacity is improved by using multiple-bases notational system[2].Quality of the output content is improved by controlling entries in the quantization table.Experiments were carried out to verify the aforementioned improvements.2Review of Nakajima et.a l’s data em-bedding method[1]Using the JPEG compressed image scenario,we briefly review the rewritable data embedding method proposed by Nakajima et.al[1].The embedding mech-anism is summarized by using the example shown in Figure1.Suppose G is a JPEG image of8M×8N pixels for M,N∈ℕwhereℕis the set of natural numbers.Let B(i,j)denote the(i,j)-th8×8quan-ti ed DCTcoefficient block where1≤i≤M and 1≤j≤N.B(i,j)is linearized into an array of dimension1×64using zigzag ordering[10]and lo-cation of the last nonzero coefficient is recorded as l a(i,j).Next,carrier capacityΩz(i,j)of B(i,j)is cal-culated asΩz(i,j)=⌊log2(64−l a(i,j))⌋bits,where ⌊x⌋rounds a positive number x towards zero.The embedding starts by extractingΩz(i,j)bits from the external informationμto generate a decimal equiva-lent number d z(i,j)∈{0,1,⋅⋅⋅,2Ωz(i,j)−1}.Aflag F(i.e.,nonzero value)is then introduced at location l f=l a(i,j)+d z(i,j)+1in B(i,j)to produce the new blockˆB(i,j).We shall drop the indices of(i,j)when there is no ambiguity.The followingβbits fromμare extracted and converted into decimal equivalent value d f where d f∈{0,1,⋅⋅⋅,2β−1}forβ∈ℕ.Then,the next bit inμis extracted to determine the sign s of d f.In particular,s←+when the external informa-tion is‘0’,or s←−otherwise.Finally,F←s×d f. In the case ofβ=3,the example in Figure1embeds 2+3+1=6bits ofμ.In summary,we introduce a new (zerorun,coefficient)pair,i.e.,(d z(i,j)+1,F),in block B(i,j)to embedΩz(i,j)+β+1bits ofμ.Note that βis constant for all blocks.The aforementioned pro-cesses are repeated for all B(i,j)in G.To decode the embedded information from the manipulated content G′,distance between the last two nonzero coefficients inˆB(i,j)determinesΩz(i,j)bits ofμ,magnitude of the last coefficient F determines the followingβbits ofμ,and polarity of F determines the next bit ofμ. The manipulated image is completely compliant with JPEG format.Note that only one nonzero coefficient is introduced in each block to embed a segment of the payload.Hence,in terms of the complexity in decod-ing(i.e.,for display purposes)a manipulated image, the decoder only needs to handle an extra ZRL pair when compared to the original JPEG image.However, it requires extra processing to decode the embedded message.[1]fails to embed information in B(i,j)when l a(i,j)=64,i.e.,the last nonzero coefficient coincides at the last position of B(i,j).To ensure each block B(i,j)embeds at leastαbits ofμforα∈ℕ,coeffi-cients at indices64−k are pre-processed to zeros for k=0,1,2,⋅⋅⋅,2α−1.For that,[1]is rewritable be-cause the last coefficient(introduced during data em-bedding)inˆB can be removed from the manipulated content to reconstruct an approximation of the orig-inal content.The approximated content could then be utilized again to embed another external message without further lost of information when the sameαis utilized.That is,if the sameαis utilized through-out all embeddings,possible lost of information only occurs at thefirst embedding.However,[1]is not re-versible due to the aforementioned pre-processing be-cause the original coefficient values cannot be restored. In addition,image quality of the manipulated content is distorted,with irregular checkerboard-like patterns scattering throughout the image.Also,since nonzero coefficients are introduced into the image during data embedding,the bitstream size of the output image is increased.Figure2.Scanning order for encoding the64-th coefficient in each block(M=N=4)3Proposed improvementsIn this work,we improve[1]in three aspects,namely, a)from rewritable to reversible,b)image quality of the manipulated content,and c)carrier capacity.Al-though the ideas are presented in JPEG,they are di-rectly applicable to I,P and B frames in MPEG-1/2/4 and H.263/4compressed video.3.1Rewritable to reversibleSince[1]is still able to embed at leastβ+1bits ofμin B when l a≤63(using the polarity and magnitude of F),we make room for data embedding by treating the64-th coefficient from each block B as part of the external information and forcing the64-th coefficient in all blocks to be zero.In particular,the64-th co-efficients form an one-dimensional array A of M×N entries in the order as shown in Figure2.Here,we consider aflag Z so that Z=0indicates that all64-th coefficients are zero(which happens very often when quality factor QF is low),and Z=1implies that there exists at least one nonzero coefficient in A.Here,we exploit the default Huffman coding method (DHCM)as defined in JPEG compression standard to promote reusability of code/circuitry and uniformity of coding method.Figure3depicts theflowchart of (slightly)modified DHCM in encoding the array A. Since DHCM is designed for a block of63AC coef-ficients,a run of zeros greater than63requires some special treatment.In particular,to encode a run of t zeros for t>63,the EOB codeword(i.e.,1010)is out-put for⌊t/63⌋times,and the remaining run of zeros (less than63now)is then encoded using the ordinary approach in JPEG.Specifically,if the remaining run is greaterthan16,the ZRL codeword(i.e.,11111111001) is output for⌊t/16⌋times and the remaining run of ze-ros(less than16now)are then encoded.For example, a run of114zeros followed by−1is encoded as followsFigure 3.Flowchart of Huffman codingmethod for handling the array Aencoding array AFigure4.Augmented external informationμ′using the default quantization table:(114,−3)→[EOB63zeros,RZL16zeros,RZL16zeros,RZL16zeros,111000(3,−1)](1) DHCM is most efficient in coding A when the runs (of zeros between two consecutive nonzero64-th co-efficients)are less than16,which happens frequently when QF is relatively high.In addition to the reusabil-ity and uniformity of coding method,another advan-tage of using DHCM is that the Huffman table need not be coded.However,when QF is relatively low, the runs in A could be excessively long and hence a customized Huffman table is required for higher cod-ing efficiency.Nevertheless,there is a tradeoffbetween the efficiency gained(which depends on the image size) and the overhead for storing the customized Huffman table.In fact,any variable length coding method(eg., duplication free run length coding[11]or Golumb cod-ing[12])can be utilized to encode A as long as it is efficient.The external informationμis augmented toμ′= [Z;BS;μ]as shown in Figure4.Here,BS denotes the set of Huffman codewords that encodes A in which case it may also contain a customized Huffman table.Note that when Z=0,BS is not coded.Reversibility is nowTable1.Suggested starting index for settingentries to unityQF50556065707580859095 u l10101515202020202530achieved because A is stored as part of the payload,but it comes with the price of reducing the effective carrier capacity.In particular,ifΩ(G)denotes the raw carrier capacity of G,the effective carrier capacityω(G)is computed asω(G)=Ω(G)−1−∣BS∣,(2) where∣BS∣denotes the length of BS.Nevertheless, reversibility is achieved without causing further bit-stream size increment when compared to the original method[1].3.2Improvement in image qualityTo improve image quality of the manipulated con-tent,the reconstruction equation of JPEG is studied:rec[u]=c×x[u]×QT[u](3) Here,x[u]denotes the u-th quantiz ed DCTcoefficient in a block B,QT[u]is the u-th entry of quantization table,and c is a constant.Since QT[u]increases as u increases,the introduction of a nonzero value at lo-cation u′=l a+1+d z causes a significant change of value for rec[u′].That is,rec[u′]changes from zero to some relatively large value,which in turn causes awk-ward checkerboard-like appearance in the processed content.Visually,the DCTbasis pattern that was not contributing to the original signal representation is in-cluded in the reconstruction process(frequency to spa-tial domain).Therefore,QT[u]in the JPEG bitstream (i.e.,after compression took place)are set to smaller values such as1or2to generate smaller(magnitude wise)rec[u]and hence suppressing checkerboard-like patterns.The aforementioned arguments are also ap-plicable in video,where the constant c in Eq.(3)in-cludes the rate controller mquant that could vary from macroblock to macroblock[13].In case of JPEG im-age,based on the results of six test images,we suggest to set QT[u]=1for u≥u l as listed in Table1.The change of entry values is viable becauseμ′could further be modified to record the original QTentries.Further-more,in case the default JPEG quantization table is utilized during encoding,we need not store the original entries at all.3.3Carrier capacityFor improving carrier capacity,multiple-base nota-tional system[2]is utilized.For illustration purposes, consider the case64−l a=64−50=12.Here,capacity is⌊log2(12)⌋=3bits and hence12−8=4locations are wasted.As the name implies,[2]can represent a num-ber using various bases in which case the bases can be explicitly specified.For example,15810=(3142)6254 where6,2,5,and4are the bases considered.In our context,we shall use a group of2×2blocks to deter-mine four bases.In particular,64−l a(i,j)of B(i,j) determines thefirst base,64−l a(i,j+1)determines the second base,and so forth.Nevertheless,base1in any group will be skipped and the number of bases in such a group will decrease accordingly.4Experiments and discussionsSix standard grayscale test images are considered to verify the proposed improvements.Each image is en-coded into JPEG format using the Image Processing Toolbox in Matlab,and random sequence of zeros and ones(long enough to occupy all available carrier capac-ity)are embedded into the image.Given the manipu-lated image(i.e.,with external information inserted), it is confirmed that the embedded information could be completely decoded and the original image could be perfectly reconstructed.Table2records the effective carrier capacityω(G) defined in Eq.(2)of the proposed improvement,along with the results obtained for[1].Unless specified other-wise,α=β=2for the rest of the discussion.Here,we consider95as the upper bound for QF because JPEG images are rarely encoded with QF≥95.Also,to focus on the comparison between the effective carrier capacity of the proposed improvement and that of[1], the results for the proposed improvement are collected without using multiple-base notational system[2].Re-gardless of the QF,image of lower spatial activity(eg., Airplane)offers higher carrier capacity,and vice versa (eg.Baboon).The reason is that image of lower spatial activities consists of mainly low frequency components and hence there are much room for data embedding. As expected,at lower QF’s,the proposed improvement offers almost identical capacity as[1].This is because the64-th coefficients are heavily quantized to zeros at lower QF’s and hence only one bit(i.e.,flag Z=0)is needed to code A(the array of all64-th coefficients).ωof the proposed improvement decreases as QF in-creases because:(a)l a(q1)≤l a(q2)for quality factors q1<q2,and(b)the probability of a64-th coefficient to assume nonzero value increases and hence BS occupiesTable2.Effective carrier capacity for various JPEG quality factors[Kbytes] QF50556065707580859095Proposed ImprovementAirplane 4.33 4.32 4.31 4.29 4.27 4.24 4.19 4.13 4.00 3.53 Baboon 4.00 3.92 3.86 3.77 3.66 3.49 3.16 2.74 2.15 1.15 Boat 4.27 4.25 4.22 4.19 4.15 4.08 3.91 3.63 2.82 1.44 Lake 4.27 4.25 4.23 4.21 4.17 4.11 3.99 3.63 2.66 1.36 Lenna 4.34 4.33 4.32 4.29 4.26 4.23 4.17 4.08 3.85 2.86 Peppers 4.34 4.32 4.31 4.28 4.25 4.18 4.10 3.81 2.81 1.04Nakajima et.al[1]Airplane 4.33 4.32 4.31 4.29 4.27 4.24 4.19 4.13 4.00 3.67 Baboon 4.00 3.96 3.90 3.84 3.76 3.66 3.52 3.33 3.06 2.71 Boat 4.27 4.25 4.22 4.19 4.15 4.08 3.95 3.77 3.48 3.00 Lake 4.27 4.26 4.23 4.21 4.17 4.11 4.01 3.78 3.31 2.79 Lenna 4.34 4.33 4.32 4.29 4.26 4.23 4.17 4.09 3.90 3.38 Peppers 4.34 4.32 4.31 4.28 4.25 4.21 4.15 4.02 3.69 2.99a greater portion of the raw carrier capacity,which is already decreasing as QF increases.On the other hand, whileωof[1]also decreases,it occurs at a lower rate because all coefficients at location u=64−k are pre-processed to zero for k=1,2,⋅⋅⋅,2α.That is,[1]guar-antees that one can embed at leastα+1+β=5bits in each block.Althoughωof the proposed improvement is inferior to that of[1],reversibility is achieved.Nev-ertheless,when multiple-base notational system[2]is applied,ωof the proposed improvement is improved by an average of∼5%by treating non-overlapping2×2 blocks as a group(hence4bases are utilized).For ref-erence purposes,we graph the size(KBytes)needed to store A for each image in Figure5.It is observed that image of higher spatial activity requires more storage space for A.The required storage also increases as QF increases.Interestingly,A of Peppers requires more storage than that of Baboon for QF≥90,but this is due solely to the texture/appearance of the image. Next,quality of the output images are compared using SSIM[14]where a SSIM value closer to unity indicates higher image quality,and vice versa.Here, using the default parameter values,SSIM is computed by comparing the original raw(i.e.,prior to compres-sion)image to the processed image.For reference pur-poses,we have also included the results for original unmodified JPEG image.To produce output using the proposed improvement,we generate a message that oc-cupies all available capacity of an image and embed it into the image.To have a fair comparison,we em-bed the same amount of information(i.e.,the effec-tive payload of the proposed improvement)into the same image using[1].Here,we show the output image quality of Lenna as the representative result in Fig-ure6.Results suggest that,image quality decreasesFigure5.Storage needed to code A in eachimage[KBytes]after data embedding for both the proposed improve-ment and[1],where the degradation is more severe at lower QF’s due to the existence of relatively large quantizers(i.e.,denominators)in QT.Regardless of QF,when embedding the same amount of informa-tion(i.e.,effective payload),image quality of the pro-posed improvement and that of[1]are almost iden-tical.However,when entries in QTare modified as described in Table1,image quality for the proposed improvement is significantly improved since those awk-ward checkerboard-like patterns are suppressed.We show a cropped output image produced by the pro-posed improvement and that by the original method[1] at QF=50in Figure7.As expected,[1]exhibits ob-vious checkerboard-like patterns throughout the image in Figure7(a).Although changing the QTentries in the proposed improvement inevitably results in dis-tortion(eg.,staircase effect around hair and hat re-Figure 6.Image quality for various JPEGquality factorsgion since most of the higher frequency components are ignored),it suppresses the appearance of obvious checkerboard-like patterns as depicted in Figure7(b) and hence the proposed improvement is able to pro-duce image of higher perceived quality.Therefore,we conclude that image quality can be significantly im-proved by setting entries in QTto smaller values.5ConclusionsIn this paper,Nakajima et.al’s data embedding method[1]was improved from rewritable to reversible. Distortion in image quality was suppressed while car-rier capacity was also improved.As a proof of con-cept,the proposed improvements were implemented in JPEG domain.It was verified that the original image could be reconstructed from its manipulated counter-part.Although reversibiltiy came in the price of reduc-ing effective carrier capacity,the raw carrier capacity was improved by using multiple-base notational sys-tem[2].It was confirmed that image quality of the processed content could be improved by changing the entry values of QT.As future work,we want to verify performance of the proposed improvements in moving picture domain.We also want to improve effective carrier capacity without causing further bitstream size increment,and to encode the array of64-th coefficients more efficiently.References[1]Katsuhiro Nakajima,Kiyoshi Tanaka,Tetsuya Matsuoka,andYasuyuki Nakajima,“Rewritable data embedding on MPEG codeddata domain,”in IEEE Proc.of ICME,July 2005,pp.682–685.[2]X.Zhang and S.Wang,“Steganography using multiple-base notational system and human vision sensitivity,”IEEE Signal Processing Letters,vol.12,pp.67–70,2005.(a)Nakajima et.al[1](SSIM=0.4493)(b)Proposed(SSIM=0.8693) Figure7.Output image of[1]and the pro-posed improvement at QF=50,cropped to center of the face[3]S.Katzenbeisser and F.Petitcolas,Information HidingTechniques for Steganography and Digital Watermarking, Artech House Publishers,2000.[4]D.Upham,“Jsteg v4-JPEG steganography,”2000.[5]IWATA Motoi,MIYAKE Kyosuke,and SHIOZAKI Akira,“Digital steganography utilizing features of jpeg im-ages(image),”IEICE transactions on fundamentals of elec-tronics,communications and computer sciences,vol.87, no.4,pp.929–936,2004-04-01.[6]Andreas Westfeld,“F5-A steganographic algorithm-highcapacity despite better steganalysis,”LNCS Proc.4th Intl.Workshop on Information Hiding,vol.2137,pp.289–302, 2001.[7]Chih-Yang Lin,Chin-Chen Chang,and Yu-Zheng Wang,“Reversible steganographic method with high payload for jpeg images,”IEICE-Trans.Inf.Syst.,vol.E91-D,pp.836–845,March2008.[8]Jiri Fridrich,Miroslav Goljan,and Rui Du,“Invertibleauthentication watermark for jpeg images,”in ITCC,2001, pp.223–227.[9]Guorong Xuan,Yun Q.Shi,Zhicheng Ni,Peiqi Chai,XiaCui,and Xuefeng Tong,“Reversible data hiding for jpeg images based on histogram pairs,”in ICIAR,2007,pp.715–727.[10]W.Pennebaker and J.Mitchell,JPEG Still Image DataCompression Standard,Van Nostrand Reinhold,New York,1992.[11]Mustafa Safa Al-Wahaib and KokSheik Wong,“A losslessimage compression algorithm using duplication free run-length coding,”Network Applications,Protocols and Ser-vices,International Conference on,vol.0,pp.245–250, 2010.[12]S.Golomb,“Run-length encodings(corresp.),”Informa-tion Theory,IEEE Transactions on,vol.12,no.3,pp.399–401,jul1966.[13]Lajs Hanzo,Peter Cherriman,and Jurgen Streit,VideoCompression and Communications,IEEE PRESS,2007.[14]Z.Wang,A.C.Bovik,H.R.Sheikh,and E.P.Simoncelli,“Image quality assessment:From error visibility to struc-tural similarity,”IEEE Trans.on Image Processing,vol.13,no.4,pp.600–612,April2004.。
Unified_Framework

Introduction
Word Alignment Phrase Extraction
MLE
Training data
P(有|have) = 0.3 P(邦交|diplo. relat. ) = 3x 10⁻⁴ …….
The conventional approach
Word Alignment: Phrase Extraction:
与
北韩
有
邦交
have diplo. relat. with North Korea
Extract concept pairs which are consistent with the word alignment matrix
Legal: 与/with; 北韩/North Korea; 有/have; 邦交/diplomatic relations; 与 北韩/ with North Korea; Illegal: 北韩 有/North Korea ….
MLE
Training data
P(有|have) = 0.3 P(邦交|diplo. relat. ) = 3x 10⁻⁴ …….
The conventional approach suffers from two major problems:
Firstly, Phrase Extraction performs no search for optimal concept alignments for SMT performance. The second problem is generalization capacity: which is over-fitting to training data.
第十一章petri网

第11章P ETRI网本章研究Petri网及其在操作系统中的应用。
11.1包(bag)一个包(bag)是某个定义域上的元素集合,但是包不像集合,它允许元素的多次出现。
一个元素或者是一个集合中的元素,或者不是一个集合中的元素。
在包理论中,一个元素可以在一个包中0次(不在包中),或一次,两次,或任意规定次数。
例1。
考虑在域{a,b,c,d}上的下列包:B1={a,b,c} B4 = {a,a,a}B2 = {a} B5 ={a,a,a,b,b,c,d,d}B3 = {a,b,c,c} B6 = {a,b,c,c}某些包是集合,例如,B1和B2,,和集合一样,元素的次序是不重要的。
所以B3和B6是相同包(有序包是序列)。
11.1.1包的元素关系定义1 一个元素x在一个包B中的出现次数为#(x, B)。
对所有的x和B#(x, B)≥0。
若#(x, B)>0,则元素x是包B的一个成员,标志为x∈B。
类似地,若#(x, B)=0,则元素x不是包B的一个成员,x∉B。
我们定义空包φ为没有元素的包。
11.1.2包的运算在包上定义四个运算。
对两个包A和B定义:包联合A∪B #(x, A∪B )=max(#(x,A),#(x,B))包交A∩B #(x, A∩B )=min (#(x,A),#(x,B))包和A+B #(x,A+B)= #(x,A)+#(x,B)包差A-B #(x,A-B)= #(x,A)-#(x, A∩B )包的联合,交,及和满足交换律和结合律。
此外,成立下列包含关系:A∩B ⊆A ⊆ A∪BA-B ⊆ A ⊆ A+B包A的基数(cardinality)|A|是包中元素出现总数:|A| = ∑xA x) , (#联合与和之间的差别显然是| A∪B |≤|A| + |B||A+B| = |A| + |B|11.1.3包的包含和相等如果一个包A的每个元素也是包B的元素,并且至少有那么多次,即包A是包B的子包,标志为A ⊆ B。
2011al-e-bs
2011-AL-BUS STUD BUSINESS STUDIESADVANCED LEVELOBJECTIVES1. To provide a basic knowledge of the business environment and business activities in Hong Kong.2. To develop an understanding of the integrated and changing nature of modern business problems.3. To develop skills of analysis, synthesis and evaluation in the context of business decisions.THE EXAMINATIONThe examination will consist of two papers of 3 hours each.Paper 1 (50%) −This paper will consist of(a) short questions to test basic concepts and knowledge; and(b) questions on case studies to test comprehension and application of knowledge.Paper 2 (50%) −This paper will consist of essay questions. It will give candidates an opportunity to deal in depth with the topics of the syllabus.The content of the syllabus will be tested in both papers.THE SYLLABUSSYLLABUS EXPLANATORY NOTES Section 1 Business in the Hong Kong economyDefinitions of businessThe role of business in Hong Kong economy (i) Production of goods and services2011-AL-BUS STUDSYLLABUSEXPLANATORY NOTES(ii) Provision of employment opportunities (iii) Improvement of living standards, etc.The industrial structure in Hong Kong and its particular characteristics(i) Lack of primary industries, concentration on secondary andtertiary industries(ii) Scope and development of the service sectorThe factors affecting Hong Kong’s international trade(i) The risks of operating a business in Hong Kong (ii) Its dependence on international trade(iii) The susceptibility of Hong Kong business to world economicand political conditionsLegal considerations(i) The effects of international legislation on Hong Kong business (ii) Effects of local legislation on Hong Kong business: employee protection and consumer protectionBusiness and government relations Government authorities which exist to assist and control business operations, trade and industryBusiness ethics and social responsibilities(i) The relationship of business organization to the community (ii) The business response to environmental pollution problemsSection 2 Forms of business ownership and their objectivesThe formation and characteristics of differentforms of business ownership: sole trader,partnership and limited company(i) Objectives of each form (ii) Procedures for formation (iii) Advantages and disadvantages2011-AL-BUS STUD SYLLABUS EXPLANATORY NOTESOther forms of business ownership Cooperatives, joint-venture, franchise and public enterpriseThe problems of setting up a business organization (i) Internal e.g. factors of production(ii) External e.g. political and government restrictions, marketenvironmentThe challenge of small business (i) Reasons for survival and failure(ii) Its economic roles and contributionsMulti-national firms (i) Definition(ii) CharacteristicsSection 3 Management and operating functions within firms to achieve objectivesManagementFunctions of management (i) Definition of management(ii) Basic understanding of planning, organizing, staffing,co-ordinating, leading, controlling and decision making Means to effective management e.g. Division of work, subordinating individual goals, encouragingindividual effort, balancing responsibility with authority, anddeveloping team spiritTypes of formal organizational structure and control (i) Line, staff, line and staff(ii) Departmentalization(iii) Centralization and decentralization2011-AL-BUS STUD SYLLABUS EXPLANATORY NOTES(iv) Span of controlThe need for effective communication (i) Means of communication(ii) Importance of vertical/horizontal communication(iii) Ways to overcome communication barriersHuman Resource ManagementThe importance of manpower Its significance in achieving company objectivesFunctions of human resource management (i) Job analysis which includes job description and jobspecification(ii) Manpower planning(iii) Recruitment, selection, placement and orientation(iv) Training and development programmes(v) Evaluation: performance appraisal, transfer, promotion anddischarge(vi) Compensation: remuneration and fringe benefits(vii) Maintenance: employee health and safety, morale, absenteeismand turnoverFactors influencing motivation, morale and productivity (i) Basic understanding of Maslow’s Hierarchy of Needs Theoryand Herzberg’s Dual-factor Theory(ii) Basic understanding of McGregor’s Theory X and Theory Y (iii) Financial and non-financial rewardsIndustrial relations (i) Framework of industrial relations system: factors affecting the2011-AL-BUS STUD SYLLABUS EXPLANATORY NOTESsystem(ii) Agencies involved: employers’ associations and trade unions(iii) Collective bargaining(iv) The use of conciliation and arbitrationFinancial ManagementSources of capital (i) Short term capital(ii) Long term capital(iii) Factors affecting choice of the aboveFinancial markets (i) Primary and secondary markets(ii) Capital and money marketsThe nature of financial statements Basic understanding of financial statements: balance sheets andincome statements (study of basic bookkeeping is not required) The nature and significance of key financial ratios Types of financial ratios: liquidity, profitability, activity, leverage andequity ratiosCurrent assets management (i) Cash flow and its importance(ii) Stock control(iii) Debtors managementCapital budgeting (i) The concept of discounted cash flow(ii) Methods, their advantages and disadvantages: NPV, IRR,average rate of returns, payback method2011-AL-BUS STUD SYLLABUS EXPLANATORY NOTESThe use of budgets for management guidance Planning and controlRevenue and cost (i) Capital and revenue(ii) Fixed and variable costs(iii) Linear breakeven analysis and its limitationsOperations ManagementProduction processes (i) Production concepts(ii) Types: extractive, analytic, fabricating, synthetic, assembling Product innovation/development Steps in product innovation/developmentOperations systems (manufacturing and service industries) (i) Manufacturing processes: standard and custom production,continuous and intermittent production(ii) Production planning and control(iii) Materials management: purchasing, storage, stock control (simple calculation of EOQ is required)(iv) Concept of quality in manufacturing and service industries (v) Basic concepts of Total Quality Management and Re-engineering (details of implementation are not required)Mass production (i) Characteristics: mechanization, specialization of labor,standardization, and automation(ii) Advantages and disadvantages(iii) Favorable factors that make mass production possible2011-AL-BUS STUD SYLLABUS EXPLANATORY NOTESMarketing ManagementThe marketing concept DefinitionThe role of marketing Planning, organizing, implementing and controlling marketingactivities for goods and servicesMarketing research (i) Process of marketing research(ii) The role of marketing researchBuyer behaviour (i) Factors affecting consumer buying behaviour(ii) Factors affecting industrial buying behaviourMarketing strategy for goods and services (i) Selecting and analyzing target markets(ii) Developing a marketing mix: product/service, channels ofdistribution, price and non-price competition, promotion(iii) Applying various marketing mix strategies for different stagesof the product life cycle(iv) Basic concepts of relationship marketingConsumerism Rights, complaints and responsesInternational marketing (i) Environmental forces in international markets(ii) Adaptations versus standardization of international marketingmixes(iii) Methods of developing international marketing involvement2011-AL-BUS STUD SYLLABUS EXPLANATORY NOTESRisk ManagementGeneral features of business risks (i) Types of business risks(ii) Risk management: risk identification, evaluation, measurementand treatment, programme of implementation(iii) Instruments for risk reduction: futures and optionsInsurance (i) Principles(ii) Functions(iii) Types of insurance protection: life, property, liability, marineand credit insuranceBusiness InformationThe importance and use of information in business (i) The significance and usefulness of business information(ii) Basic understanding of the importance of information systemsin businessStatistical data in business (i) Application of the arithmetic mean, mode and median(ii) Interpretation of tables, graphs, histograms, bar charts and piecharts(iii) Basic understanding of trend interpretationThe role of information technology in business (i) Its applications(ii) Advantages and disadvantages。
Re-第一章
2. 面向对象方法学
面向对象方法把数据和行为看成同等重要,它 是一种以数据为主线,把数据和对数据的操作 紧密地结合起来的方法。 面向对象方法学具有下述4个要点。
1.1.3
消除软件危机的途径
1、应该对计算机软件有一个正确的认识。 正如1.1.2节中讲过的,应该彻底消除在计算机 系统早期发展阶段形成的“软件就是程序”的错误 观念。一个软件必须由一个完整的配置组成,事实 上,软件是程序、数据及相关文档的完整集合。其 中,程序是能够完成预定功能和性能的可执行的指 令序列;数据是使程序能够适当地处理信息的数据 结构;文档是开发、使用和维护程序所需要的图文 资料。
1.2.2 软件工程的基本原理(7)
著名的软件工程专家B.W.Boehm综合许多学者 们的意见并总结了TRW公司多年开发软件的经验, 于1983年在一篇论文中提出了软件工程的7条基本 原理。他认为这7条原理是确保软件产品质量和开 发效率的原理的最小集合。 1、这7条原理是互相独立的,其中任意6条原理的 组合都不能代替另一条原理,因此,它们是缺一不 可的最小集合。 2、这7条原理又是相当完备的。在此之前已经提出 的100多条软件工程原理都可以由这7条原理的任意 组合蕴含或派生。
二:软件工程的本质特性(理解) 1. 软件工程关注于大型程序的构造 2. 软件工程的中心课题是控制复杂性 3. 软件经常变化 4. 开发软件的效率非常重要 5. 和谐地合作是开发软件的关键 6. 软件必须有效地支持它的用户 7. 在软件工程领域中是由具有一种文化背景的 人替具有另一种文化背景的人创造产品
附录1
4、运算符 +、-、*、/ 5、语句 ①赋值语句 VariableName=Expression 如:a=123 str=“abcd” mle.text="春眠不觉晓,处处闻啼鸟"
②if… then 语句 If <….> then <….> else <….> End if
例1:从单行编辑框中输入考分,按“输入”按钮再根据考 分显示及格或不及格。 Integer s s = integer(sle_1.text) //sle_1 text单行编辑框文本 If s < 60 then
5.跨平台开发 目前支持的平台有: 1. Windows /Me/2000/xp 2. Macintosh 3. UNIX 4. Sun Solaris 5. HP-UX 6. IBM AIX RS6000
6.PowerScript语言与函数
PowerScript是PowerBuilder的编程语言,我们编写的事件处理 程序、用户自定义函数等都是使用PowerScript语言编写的。这 是一种自由格式的语言,它很宽容,也就是说,语句行中的空 格、缩进等格式编排信息完全被编译器忽略,为了阅读方便, 我们可以随意安排语句行的位置。 如: Open(w_main) //打开主窗口
(1)建立工作空间: 在PowerBuilder 9.0中用工作空间(Workspace)管理应用程 序。在一个工作空间中可以建立多个应用程序,可以同时开发 和管理多个应用程序。 (2)建立目标和应用对象 在PowerBuilder 8.0中工作空间管理的是目标(Target),每 个目标对应一个应用或应用程序,在建立应用程序目标时将自 动建立一个应用对象。
Bisphenol A impairs follicle growth, inhibits steroidoge
TOXICOLOGICAL SCIENCES119(1),209–217(2011)doi:10.1093/toxsci/kfq319Advance Access publication October18,2010Bisphenol A Impairs Follicle Growth,Inhibits Steroidogenesis,and Downregulates Rate-Limiting Enzymes in the Estradiol BiosynthesisPathwayJackye Peretz,Rupesh K.Gupta,Jeffrey Singh,Isabel Herna´ndez-Ochoa,and Jodi A.Flaws1Department of Comparative Biosciences,University of Illinois,Urbana,Illinois618021To whom correspondence should be addressed at Department of Comparative Biosciences,University of Illinois,2001S.Lincoln Avenue,Room3223,Urbana,IL61802.Fax:(217)244-1652.E-mail:jflaws@.Received July27,2010;accepted October8,2010Bisphenol A(BPA)is used as the backbone for plastics and epoxy resins,including various food and beverage containers.BPA has also been detected in95%of random urine samples and ovarian follicularfluid of adult women.Few studies have investigated the effects of BPA on antral follicles,the main producers of sex steroid hormones and the only follicles capable of ovulation.Thus,this study tested the hypothesis that postnatal BPA exposure inhibits antral follicle growth and steroidogenesis. To test this hypothesis,antral follicles isolated from32-day-old FVB mice were cultured with vehicle control(dimethyl sulfoxide [DMSO]),BPA(4.4–440m M),pregnenolone(10m g/ml),pregnen-olone1BPA44m M,and pregnenolone1BPA440m M.During the culture,follicles were measured for growth daily.After the culture,media was subjected to ELISA for hormones in the estradiol biosynthesis pathway,and follicles were processed for quantitative real-time PCR of steroidogenic enzymes.The results indicate that BPA(440m M)inhibits follicle growth and that pregnenolone cotreatment was unable to restore/maintain growth. Furthermore,BPA44and440m M inhibit progesterone,dehy-droepiandrosterone,androstenedione,estrone,testosterone,and estradiol production.Pregnenolone cotreatment was able to increase production of pregnenolone,progesterone,and dehy-droepiandrosterone and maintain androstenedione and estrone levels in BPA-treated follicles compared with DMSO controls but was unable to protect testosterone or estradiol levels.Further-more,pregnenolone was unable to protect follicles from BPA-(44–440m M)induced inhibition of steroidogenic enzymes compared with the DMSO control.Collectively,these data show that BPA targets the estradiol biosynthesis pathway in the ovary. Key Words:bisphenol A;steroidogenesis;ovary;antral follicle growth;StAR;pregnenolone.Bisphenol A(BPA),2,2-bis-4-hydroxyphenyl propane,is an estrogenic compound originally synthesized in1963to prevent miscarriage.BPA eventually became widely used as the backbone for epoxy resins,durable clear polycarbonate plastics such as reusable plastic food containers,food and beverage can liners,infant formula cans,baby bottles,and dental sealants, among many other plastic-based products.Unfortunately, aging,heating,and contact with acids and bases,including those commonly found in cleaning supplies and detergents, cause the BPA polymers to break apart.In a process commonly referred to as‘‘leaching,’’BPA seeps into the contents of various food packages,into saliva,and/or into dust particles, providing ample entry ways for BPA into animal physiological systems,including humans(Can et al.,2005;Kang et al.,2006; Lenie et al.,2008;Vandenberg et al.,2007;vom Saal and Hughes,2005;Welshons et al.,2006).Although BPA exposure can occur via food and drink (ingested),BPA can also be inhaled.Once in the lungs,BPA can travel through the bloodstream and into enterohepaticflow, where it can act as if ingested orally and travel through the digestive system.Various studies have detected BPA in blood, saliva,and human tissues as well as in95%of human urine samples taken in a random sampling(Calafat et al.,2005, 2008;Ouchi and Watanabe,2002).Additionally,though BPA is thought to be conjugated to glucuronide in the digestive system and to exit the body via the urinary system,the chemical is not solely confined to the digestive system.BPA has also been detected in mammary tissue,breast milk, amnioticfluid,and ovarian follicularfluid,indicating BPA travels not only through the digestive system but also through the venous network and thus into the many other organ and tissue systems of the body(Ikezuki et al.,2002;Lenie et al., 2008;Vandenberg et al.,2007,2009).Recent research has suggested that BPA persists in the human system longer than originally thought.In a study comparing BPA levels with fasting time,researchers found BPA persisting in the body well past the given4–6h half-life of BPA.Specifically,following17-h exposure,BPA levels only decreased56%instead of the expected100%elimination. This study suggests that BPA has a longer half-life than previously estimated;there are significant non-food source exposures of BPA or,more likely,a combination of the twoÓThe Author2010.Published by Oxford University Press on behalf of the Society of Toxicology.All rights reserved. For permissions,please email:journals.permissions@ at Shanghai Jiao Tong University on June 6, Downloaded fromexplanations(Stahlhut et al.,2009;Tillet,2009).Collectively, thesefindings suggest that humans are constantly exposed to BPA.Studies focusing on the effects of BPA exposure on the rodent female reproductive system have shown that maternal exposure to BPA during gestation can cause adverse de-velopmental effects in the offspring.Specifically,BPA has been shown to induce early puberty onset,changes in weight gain,early vaginal opening(Honma et al.,2002),and ovarian morphological abnormalities in the offspring.The ovarian abnormalities include cystic ovaries(Hartshorne,1997)and cystadenomas,hemorrhagic follicles,and large antral-like follicles seemingly unable to ovulate(Hartshorne,1997). BPA also can cause progressive proliferative lesions of the oviduct(Savabieasfahani et al.,2006)and leiomyomas in the uterus(Newbold et al.,2007).Furthermore,BPA increases estrogen receptor alpha(Esr1)and estrogen receptor beta(Esr2) receptor expression levels in the uterus(Richter et al.,2007). Few studies have investigated the direct effects of BPA on the ovarian follicle itself,the functional unit of the ovary and the main steroid hormone producer of the female reproductive system.Previous studies have focused mainly on meiotic abnormalities,such as cell cycle arrest,meiotic aneuploidy,and congression failure during the cell cycle(Eichenlaub-Ritter et al.,2008;Hunt et al.,2003)or on morphological indicators of ovulation,such as observing a lack of corpora lutea in the ovary(Hartshorne,1997).Although BPA has been reported to be present in follicularfluid of adult human ovaries,previously published studies have not focused on antral follicles of adult humans,and as a result,little information is available regarding the effect of postnatal BPA exposure on the proper functioning of adult human ovarian follicles.Furthermore,little informa-tion is available on the effect of BPA on the proper functioning of ovarian antral follicles in the adult mouse model.Thus,this study tested the hypothesis that postnatal exposure to BPA inhibits growth and steroidogenesis of adult ovarian antral follicles in mice.MATERIALS AND METHODSChemicals.BPA powder(99%)was purchased from Sigma-Aldrich (St Louis,MO).A stock solution of BPA was dissolved and diluted in dimethyl sulfoxide(DMSO)(Sigma-Aldrich)to achieve various BPA treatment concentrations(1.3,13.3,and133mg/ml)forfinal working concentrations of 1.0,10,and100l g of BPA per milliliter of culture media(4.4,44,and440l M BPA,respectively).Additionally,using these treatment concentrations allowed each working concentration to contain the same volume of chemical and vehicle(0.75l l BPA:DMSO per milliliter of culture media).The concentrations chosen for the cultures were based on concentrations used in previous studies(Can et al.,2005;Lee et al.,2007;Lenie et al.,2008; Mlynarcikova et al.,2009;Vandenberg et al.,2007;Watson et al.,2007;Xu et al.,2002;Zhou et al.,2008).BPA concentrations were also chosen based on studies showing the effects of BPA on ovarian cells.For example,BPA exposure between100fM and100l M for24–72h results in an increase in apoptosis and G2-to-M arrest in cultured mouse ovarian granulosa cells (Xu et al.,2002).The selected concentrations of BPA are relevant to current regulatory levels set for BPA.The lowest observable adverse effect level (LOAEL)is50mg/kg/day.This equates to210.6l M.The doses used in the experiments were4.4,44,and440l M(or1,10,and100l g/ml),encompassing the LOAEL concentration.5-Pregnen-3b-ol-20-one(Pregnenolone;pregn)powder was purchased from Sigma-Aldrich.A stock solution of pregn was prepared in DMSO for afinal concentration in culture of10l g/ml.Animals.Adult,cycling female FVB mice were purchased from Jackson Laboratory(Bar Harbor,ME)and allowed to acclimate to the facility for at least 5days before use.The mice were housed at the University of Illinois at Urbana-Champaign,Veterinary Medicine Animal Facility.Food(Harlan Teklad8626) and water were provided for ad libitum consumption.Temperature was maintained at22±1°C,and animals were subjected to12-h light-dark cycles. The Institutional Animal Use and Care Committee at the University of Illinois at Urbana-Champaign approved all procedures involving animal care, euthanasia,and tissue collection.In vitro follicle culture.Female FVB mice were euthanized on postnatal day32and their ovaries removed using aseptic technique.Antral follicles were mechanically isolated from the ovary based on relative size(250–400 l m),cleaned of interstitial tissue usingfine watchmaker forceps(Gupta et al., 2006;Miller et al.,2005),and individually placed in wells of a96-well culture plate and covered with unsupplemented a-minimal essential medium (a-MEM)prior to treatment.Sufficient numbers of antral follicles for statistical power were isolated from unprimed mouse ovaries;follicles from two to three mice were isolated per experiment providing approximately 20–40antral follicles from each mouse.Each experiment contained a minimum of8–16follicles per treatment group.Doses of vehicle control (DMSO),BPA(4.4,44,and440l M),pregn(10l g/ml),pregnþBPA (44l M),and pregnþBPA(440l M)were individually prepared in supplemented a-MEM.Supplemented a-MEM was prepared with:1%ITS (10ng/ml insulin,5.5ng/ml transferrin,and5.5ng/ml selenium),100U/ml penicillin,100mg/ml streptomycin,5IU/ml human recombinant follicle-stimulating hormone(Dr A. F.Parlow,National Hormone and Peptide Program,Harbor-UCLA Medical Center,Torrance,CA),and5%fetal calf serum(Atlanta Biologicals,Lawrenceville,GA)(Gupta et al.,2006;Miller et al.,2005).An equal volume of chemical was added for each dose to control for the amount of vehicle in each preparation(0.75l l/ml of media:BPA treatments;1.0l l/ml of media:DMSO and pregn treatments).Antral follicles were cultured for120h in an incubator supplying5%CO2at37°C.Analysis of follicle growth.Follicle growth was examined at24-h intervals by measuring follicle diameter on perpendicular axes with an inverted microscope equipped with a calibrated ocular micrometer.Follicle diameter measurements were averaged among treatment groups and plotted to compare the effects of chemical treatments on growth over time.Data were presented as percent change over time.Analysis of hormone levels.Media was collected after120h of follicle culture and subjected to ELISA for measurement of estradiol,estrone, testosterone,androstenedione,dehydroepiandrosterone sulfate(DHEA-S),and progesterone levels.ELISA kits and reagents were obtained from ALPCO Diagnostics(estrone,testosterone,androstenedione,progesterone,and DHEA-S) and Diagnostics Research Group(estradiol).The assays were run using the manufacturer’s instructions.All samples were run in duplicate and all intra-and interassay coefficients of variability were less than10%.Analysis of quantitative real-time PCR.Female FVB mouse antral follicles were cultured as described above for120h.At the end of culture, follicles were collected and snap frozen atÀ80°C for quantitative real-time PCR(qPCR)analysis.Total RNA was extracted from follicles using the RNeasy Micro Kit(Qiagen,Inc.,Valencia,CA)according to the manufac-turer’s protocol.Reverse transcriptase generation of complementary DNA (cDNA)was performed with0.3–1l g of total RNA using an iScript RT Kit (Bio-Rad Laboratories,Inc.,Hercules,CA).qPCR was conducted using the210PERETZ ET AL.at Shanghai Jiao Tong University on June 6, Downloaded fromCFX96Real-Time PCR Detection System(Bio-Rad Laboratories,Inc.)and accompanying software(CFX Manager Software)according to the manufac-turer’s instructions.The CFX96quantifies the amount of PCR product generated by measuring a dye(SYBR Green)thatfluoresces when bound to double-stranded DNA.A standard curve was generated fromfive serial dilutions of one of the samples,thus allowing analysis of the amount of cDNA in the exponential phase.Specific qPCR primers for the genes of interest and annealing temperatures are listed in Table1,along with GenBank accession numbers(Akingbemi et al.,2003;Hernandez-Ochoa et al.,2010;Pakarainen et al.,2005;Sha et al.,1996;Weihua et al.,2000).qPCR analysis was performed using2l l cDNA,forward and reverse primers(5pmol)for steroidogenic acute regulatory protein(StAR),cytochrome P450side-chain cleavage(P450scc),3b-hydroxysteroid dehydrogenase(3b-HSD),17b-hydroxysteroid dehydrogenase(17b-HSD),cytochrome P450aromatase (Cyp19),cytochrome P45017a-hydroxylase/17,20lyase(Cyp17a),or b-actin, in conjunction with a SsoFast EvaGreen Supermix qPCR Kit(Bio-Rad Laboratories).An initial incubation of95°C for10min was followed by denaturing at94°C for10s,annealing from56to61°C for10s,and extension at72°C for10s,for40cycles(b-actin),followed byfinal extension at72°C for 10min.A melting curve was generated at55–90°C to monitor the generation of a single product.The software also generated a standard curve.b-Actin was used as reference gene for each sample.Final values were calculated and expressed as the ratio normalized to b-actin.All analyses were performed in duplicate for at least three separate experiments.Statistical analysis.Data were expressed as means±SEM,and multiple comparisons between experimental groups were made using ANOVA followed by Tukey’s post hoc comparison.Tests for trend were analyzed using linear regression analyses for the overall effect of BPA concentration(continuous variable).At least three separate experiments were conducted for each treatment prior to data analysis.Statistical significance was assigned at p0.05.RESULTSEffect of BPA on Follicle GrowthExposure to BPA(440l M)significantly decreased antral follicle growth compared with DMSO controls beginning at 72h,and this decrease in follicle growth remained throughout the120-h culture(Fig.1).No significant differences in follicle growth were observed between follicles exposed to DMSO, BPA(44l M),or BPA(4.4l M).Effect of BPA on Sex Steroid Hormone ProductionBPA(440l M)exposure for120h significantly decreased estradiol,estrone,testosterone,androstenedione,DHEA-S,and progesterone levels produced by the follicles compared with DMSO(Fig.2).BPA(44l M)exposure for120h significantly decreased estradiol,estrone,testosterone,androstenedione, DHEA-S,and progesterone levels produced by the follicles. No significant differences in steroid levels were found between DMSO and4.4l M BPA.Effect of BPA on Gene ExpressionBecause BPA decreased steroidogenesis in the cultured antral follicles,studies were conducted to see if it did so by decreasing the expression of enzymes required for steroido-genesis.Specifically,levels of steroidogenic enzymes StAR,TABLE1PrimersusedinQuantitativeReal-TimePolymeraseChainReactions(qPCR)GenenameGenesymbolPrimersequencesAnnealingtemperatureGenBankaccession#ForwardReverseBeta-actinActbF:GGGCACAGTGTGGGTGACR:CTGGCACCACACCTTCTAC56°CNM_7393SteroidogenicacuteregulatoryproteinStARF:CAGGGAGAGGTGGCTATGCAR:CCGTGTCTTTTCCAATCCTCTG57°CNM_781CytochromeP45cholesterolside-chaincleavageCyp11a1F:AGATCCCTTCCCCTGGCGACAATGR:CGCATGAGAAGAGTATCGACGCATC6°CNM_82933b-Hydroxysteroiddehydrogenase1HSD3b1F:CAGGAGAAAGAACTGCAGGAGGTCR:GCACACTTGCTTGAACACAGGC59.5°CNM_8293CytochromeP45aromataseCyp19a1F:CATGGTCCCGCAAACTGTGAR:GTAGTAGTTGCAGGCACTTC56°CNM_781CytochromeP45steroid17-a-hydroxylase1Cyp17a1F:CCAGGACCCAAGTGTGTTCTR:CCTGATACGAAGCACTTCTCG56°CNM_78917B-hydroxysteroiddehydrogenase1HSD17b1F:ACTGTGCCAGCAAGTTTGCGR:AAGCGGTTCGTGGAGAAGTAG58°CNM_1475THE EFFECTS OF BISPHENOL A ON ANTRAL FOLLICLES211at Shanghai Jiao Tong University on June 6, Downloaded from3b -HSD,and Cyp17a were compared in control and BPA-treated follicles.Only StAR messenger RNA (mRNA)expression levels were significantly decreased following exposure to BPA44l M and BPA440l M compared with DMSO controls (Figs.3and 6;BPA-only treated follicles).Exposure to BPA440l M,however,resulted in a significant trend for decreased 3b -HSD expression compared with controls.Furthermore,BPA44l M and BPA440l M signifi-cantly decreased P450scc mRNA expression levels compared with DMSO controls (Fig.6;BPA-only treated follicles).Effect of Pregnenolone Cotreatment on BPA-Treated FolliclesThe BPA-induced inhibition of steroidogenesis and follicle growth could be the result of decreased StAR and P450scc levels in the follicles because these are rate-limiting enzymes for the estradiol biosynthesis pathway.Because addition of pregnenolone bypasses this disrupted enzyme,studies were conducted to investigate whether cotreatment of follicles with pregnenolone and BPA would protect follicles from the toxic effects of BPA on follicle growth and steroidogenesis.Addition of pregnenolone to the supplemented media did not protect follicles from BPA-induced follicle growth inhibition (Fig.4).However,cotreatment of follicles with pregnenolone and BPA did provide some protection against inhibition of steroidogenesis (Fig.5).Pregnenolone cotreatment with BPA increased pregnenolone,progesterone,and DHEA-S levels compared with DMSO controls and maintained androstene-dione and estrone levels similar to DMSO controls.Pregnen-olone cotreatment with BPA,however,did not increase levels of testosterone and estradiol production compared with DMSO controls.Specifically,progesterone levels were 2.9±0.4ng/ml with BPA44l M only and 14.1±2.5ng/ml with DMSO only,but progesterone levels were 5502.1±387.2ng/ml with pregn þBPA44l M.Androstenedione levels were 0.07±0.003ng/mL with BPA44l M only and 1.1±0.2ng/ml with DMSO only,but androstenedione levels were 1.0±0.04ng/ml with pregn þBPA44l M.Estradiol levels were 378.1±54.5pg/ml with BPA44l M only,5417.8±1849.9pg/ml with DMSO only,and 465.6±11.2pg/ml with pregn þBPA44lM.FIG.2.Effect of BPA exposure on antral follicle hormone production.After exposure of antral follicles to DMSO control or BPA (4.4–440l M)for 120h in vitro ,media was collected and subjected to various hormone measurements by ELISA.These graphs represent the means ±SEMs from separate experiments.A single asterisk (*)denotes a significant p value for overall effect of BPA concentration as the continuous variable using linear regression.A double asterisk (**)denotes a significant p value from the DMSO control via ANOVA,post hoc Tukey’s Honestly Significant Difference (test)(n ¼3–4;p0.05).at Shanghai Jiao Tong University on June 6, 2011 Downloaded fromEffect of Pregnenolone þBPA on Gene ExpressionBecause levels of pregnenolone,DHEA-S,progesterone,androstenedione,and estrone were protected from BPA-induced inhibition in the pregnenolone-treated groups compared with their nonpregnenolone counterparts,geneexpression levels of the enzymes responsible for their metabolism along the biosynthesis pathway were measured.Addition of pregnenolone treatment did not protect the follicles from BPA-induced alterations in steroidogenic enzyme gene expression (Fig.6).Specifically,StAR mRNA expression levels were 0.09±0.04genomic equivalents (ge)with BPA44l M only and 0.41±0.04ge with DMSO,but StAR mRNA expression levels were 0.09±0.006ge with pregn þBPA44l M.P450scc mRNA expression levels were 0.08±0.01ge with BPA44l M only and 0.37±0.07ge with DMSO only,but P450scc mRNA expression levels were 0.03±0.13ge with pregn þBPA44l M.DISCUSSIONUsing an in vitro follicle culture system,we have shown that BPA inhibits follicle growth and decreases hormone pro-duction in mouse ovarian antral follicles.Furthermore,although cotreatment with pregnenolone did not protect follicles from BPA-induced inhibition of follicle growth,it partially protected follicles from BPA-induced inhibition of steroidogenesis.Sex steroid hormone production is required for proper development of antral follicles (Cain et al.,1995).These hormones produced in the ovary have an autocrine effect on the growth and development of follicles.Estrogens,such as estradiol,stimulate follicle growth and protect the follicle from atresia (Quirk et al.,2004).Progestins,such as progesterone,have an inhibitory effect and induce atresia,although the specific actions of progesterone on the follicle are not currently well understood (Fukuda et al.,1980).Androgens,such as androstenedione,testosterone,and dehydrotestosterone,have been reported to both stimulate follicle growth and induce atresia in antral follicles (Drummond,2006).FIG.3.Effect of BPA exposure on StAR,3b -HSD,and Cyp17a mRNA expression levels.After exposure of antral follicles to DMSO control of BPA (4.4–440l M)for 120h in vitro ,the follicles were collected and subjected to qPCR analysis for StAR,3b -HSD,and Cyp17a mRNA expression levels.All values were normalized to b -actin as a loading control.Graph represents means ±SEMs from separate experiments.A single asterisk (*)denotes a significant p value for overall effect of BPA concentration as the continuous variable using linear regression.A double asterisk (**)denotes a significant p value from the DMSO control via ANOVA,post hoc Tukey’s HSD (n ¼8–16follicles per treatment per experiment from three separate experiments;p0.05).FIG.4.Effect of pregnenolone cotreatment with BPA on antral follicle growth.Antral follicles were mechanically isolated from FVB mice and exposed in vitro to BPA (4.4–440l M),pregnenolone (10l g/ml)or pregnenolone,and BPA (44–440l M)for 120h.Growth of follicles was monitored during culture and recorded in micrometers and reported as percent change.The graph represents means ±SEMs from at least three separate experiments.Lines with asterisks (*)are significantly different from DMSO controls (n ¼8–16follicles per treatment per experiment from at least three separate experiments;p 0.05).THE EFFECTS OF BISPHENOL A ON ANTRAL FOLLICLES213at Shanghai Jiao Tong University on June 6, 2011 Downloaded fromHormone production is dependent on the components of the estradiol biosynthesis pathway.More specifically,production of downstream hormones in the pathway,such as estradiol,is dependent on the availability of upstream hormones,such as progestins and androgens.All the hormones within the biosynthesis pathway are dependent on the availability of the lipid precursor,cholesterol.Furthermore,the rate-limiting step of the estradiol biosynthesis pathway is the transport of cholesterol by StAR from lipid droplets in the theca cells into the inner matrix of the mitochondria.Therefore,without this transport,cholesterol cannot be converted to pregnenolone via P450scc,and further hormone metabolism and production in the antral follicles is inhibited.Our results suggest that both StAR and P450scc mRNA expression are inhibited following exposure to BPA.This would prevent cholesterol uptake into the mitochondria and metabolism to pregnenolone,explaining the decrease in hormone production following exposure to BPA in our study.To try and bypass these enzymes,we added pregnenolone to the culture.We hypothesized that the pregnenolone addition would protect the follicles from inhibited growth and hormone production.Exposing the follicles concurrently to pregneno-lone and BPA did not prevent inhibition of follicle growth but protected hormone production in the theca cells,although not necessarily in the granulosa cells.These data support our finding that StAR and P450scc mRNA levels are inhibited by BPA.Thus,cholesterol uptake into the mitochondria and metabolism to pregnenolone is inhibited,impairing hormone production in the antral follicles.Without adequate hormone levels,late antral follicle growth and ovulation will be impaired,as well as further hormone production within the follicles,thus affecting fertility.Our results support previous work,indicating that BPA exposure affects progesterone production using porcine granulosa cells incubated for 24–72h,although this previous work was done in isolated granulosa cells not the wholefollicleFIG.5.Effect of pregnenolone cotreatment with BPA on antral follicle hormone production.After exposure of antral follicles to DMSO control,BPA (4.4–440l M)pregnenolone (10l g/ml)or pregnenolone,and BPA (44–440l M)for 120h in vitro ,media was collected and subjected to various hormone measurements by ELISA.These graphs represent the means ±SEMs from separate experiments.Asterisks (*)indicate a significant difference between no pregnenolone and pregnenolone groups;symbols (†)indicate a significant difference between BPA and control groups without pregnenolone;letters indicate a significant difference between BPA and control groups with pregnenolone groups (n ¼3–4;p 0.05).214PERETZ ET AL.at Shanghai Jiao Tong University on June 6, 2011 Downloaded from。
- 1、下载文档前请自行甄别文档内容的完整性,平台不提供额外的编辑、内容补充、找答案等附加服务。
- 2、"仅部分预览"的文档,不可在线预览部分如存在完整性等问题,可反馈申请退款(可完整预览的文档不适用该条件!)。
- 3、如文档侵犯您的权益,请联系客服反馈,我们会尽快为您处理(人工客服工作时间:9:00-18:30)。
The fourth year of schooling was chosen as a focal point for PIRLS because it is an important transition point in children’s development as readers. Typically, at this point, students have learned how to read and are now reading to learn.
The availability of prePIRLS enables IEA to target the PIRLS assessment to each country’s situation to provide the best possible measurement. Depending on a country’s educational development and the students’ reading level, countries can participate in either or both PIRLS and prePIRLS to conduct the most effective assessment. The goal is to provide the best policy-relevant information about how to improve teaching and learning and help children become accomplished and self-sufficient readers.
Monitoring Trends From its inception, PIRLS was designed to measure trends in reading literacy achievement. It is conducted every five years, and previous PIRLS assessments took place in 2001 and 2006. The next assessment after the 2011 assessment is planned for 2016. Many of the countries participating in PIRLS 2011 also participated in the previous study cycles. These countries will have the opportunity to measure progress in reading achievement across three time points—2001, 2006, and 2011.
In 2011, the PIRLS five-year cycle comes into alignment with the four-year cycle of TIMSS (IEA’s mathematics and science study).
Overview of IEA’s PIRLS Assessment | 7
known as IEA—conducts a regular assessment of children’s reading literacy and the factors associated with its acquisition in countries around the world. IEA’s Progress in International Reading Literacy Study, called PIRLS, focuses on the achievement of young children in their fourth year of schooling and the experiences they have at home and at school in learning to read.
y is vital to every child’s
development, the International Association for the Evaluation
of Educational Achievement—more widely
Inaugurated in 2001, PIRLS is conducted every five years to measure progress in students’ reading achievement as well as trends in the associated home and school contexts for learning
For a variety of reasons, however, there are countries where most children in the fourth grade are still developing fundamental reading skills. Thus, beginning in 2011, IEA has extended PIRLS to meet the needs of these countries by offering PIRLS at grade levels beyond fourth grade and by developing a less difficult reading assessment designed to be a stepping stone to PIRLS. Consistent with the purpose of extending PIRLS or bridging to PIRLS, the newly developed assessment has been named prePIRLS. The prePIRLS assessment follows the same conception of reading literacy as PIRLS outlined in this publication, but is intended to measure the reading comprehension skills of students who are still in the process of learning how to read.
Therefore, at fourth grade, by participating in both IEA studies, countries can conduct one comprehensive assessment of the three core curriculum subjects—reading, mathematics, and science.
to read. The number of countries participating
in PIRLS has grown with each subsequent
assessment cycle. Approximately 55 countries from all around the
world are planning to participate in PIRLS 2011.
Chapter 1
Overview of IEA’s PIRLS Assessment
1
Chapter 1
Overview of IEA’s PIRLS Assessment
Reading literacy is one of the most important abilities students acquire as they progress through their early school years. It is the foundation for learning across all subjects, it can be used for recreation and for personal growth, and it equips young children with the ability to participate fully in their communities and the larger society.
Throughout the framework, various sources that have provided a research and scholarly basis for the framework are referenced. These references are only a sample of the volumes of literature and research that have informed the PIRLS framework, including considerable research by countries participating in PIRLS.
PIRLS at the 5th or 6th Grades In some countries, students are more likely to have developed the reading comprehension competencies necessary for success on PIRLS by the fifth or sixth grade. IEA encourages participation in PIRLS 2011 at the fifth or sixth grade for these countries, because participation at a higher grade could provide valuable information about students’ strengths and weaknesses in reading, whereas participation at the fourth grade would provide little information except that the assessment was too difficult.