基于LabVIEW虚拟仪器平台的外文翻译
基于LabVIEW的虚拟双踪示波器的设计外文翻译

基于LabVIEW的虚拟双踪示波器的设计外文翻译外文文献A DAQ card based mixed signal virtual oscmoscopeAbstractComplex signals find many applications in SONAR, RADAR,Echo Location Systems and for studying the resonant frequencies. Digital StorageOscilloscopcs(DSO) is used these days for acquisition and display of routine signals. This instrument, found in every measurement laboratory, though potent in displaying simple periodic waveforms like sinusoids fails when frequency-varying time signals are applied, This problem surfaces because the underlying technique of oscilloscope used to trigger the waveform does not acquiesce with complex signals like chirp. Ready solution to this problem is the mixed signal oscilloscope. This is a costly solution and small laboratories cannot afford to have the costly instruments. In this paper, a cost effective DAQ card based mixed signal virtual 0scilloscope is proposed to study the complex signals. An intelligent technique, Weighted Hamming Distance (WHD) algorithm was used to accurately trigger the complex waveforms. Also for frequency domain analysis, Joint Time Frequency Analysis(JTFA) techniques were used. A LabVlEW'TM based virtual instrument was designed and developed with a capability to acquire, display and analyze the triggered signal. The integrated programming language LabVIEWTM was chosen as it offers many simple ready to use functions. In a way the proposal offers a cost effective, fast and flexible solution to treat the complex signals. The need to createsuch solutions is the consequence of costly hardware systems. The deficiency of conventional hardware. Scheme for the virtual oscilloscope for complex signals with some real time experimental results are presented in this work.Kevywords: Virtual instrumentation,Chirp signal,Data acquisition,Triggering, Complex signals, JTFA1.IntroductionFor the last two decades there has been a tremendous progress in computer technology. Measurement domain is no longer left unaffected. The way measurements are being done is totally revolutionized. Computer based measurement or say virtual instrumentation is gradually replacing the costly bench 1top instrumentation as it offers flexible,fast and cost effective solutions. Various classical instrumentation systems namely Oscilloscope, Multimeters and Spectrum analyzers ect. are almost phased out by their counter part virtual instrumentation. Our research extends the trend and demonstrates the developmen of the computer based mixed signal digital oscilloscope.Conventional signals such as the sinusoids have a constant frequency and the amplitede only varies with time throughout the signal definition. On the other hand, complex signals can be defined in this context as signals in which all the parameters vary. Fig.1 shows a typical complex signal i.e. Linear Chirp.Variation of amplitude and frequency with time can easily be understood by having a look at the signal. This requires a visually stable display of signal. The complex signal offers challenges f'or acquisition, display an analysis. Even the conventional modernage DSO is not capable of displaying and analyzing complex signals because these instruments employ simple triggering technique like level trigger. The conventional technnique of voltage trigger apparently fails when complex signals like chirp are analyzed on DSO. This is due to the very fact that these instruments consider chirp as a conventional sine wave and trigger for each cycle of the sine wave instead of triggering for the complete chirp cycle. This analysis of the chirp signal as several sine waveforms of different frequencies leads the DSO to display them as sinusoids in quick succession. As this rapid change occues at a very high rate and because of human eye not registering events occurring faster than 1/20th of a second the display appears as several overlapped sine waves. In the recent work[1], a new triggering technique was proposed for the complex signals based on WHD. Subsequent sections present the solution to the problem. For analysis of the complex signals in frequency domain JFFA technique is utilized and implemented[2-6].DSO uses the level trigger to display the waveform applied to it. This leads to trigger interval and the number of samples for this trigger interval is computed and these numbers of samples are display. The DSO considers the interval as the fundamental time period of the whole waveform and thus takes tbat much samples from its buffer and starts displaying it in quick succession. With simple waveform like a sine wave, level trigger can achieve stable display because trigger interval contains same number of cycles. This is shown in Fig. 2a.23Now for the complex signal as shown in Fig.2b, leveltriggering produces a trigger interval having variable number of cycles for the same number ofsamples/time resulting in a visually unstable display.The actual trigger interval should be one complete cycle for a chirp signal as indicated in Fig. 2c. Having done this the repeated chirp signal for this time duration will be displayed without any overlapping components as long as the entire time period is displayed.To observe the shortcomings experimentally in display of complex signals on the oscilloscope T ektronix dual channel signal generator AFG-3022 (250 MS/s, 25 MHz) was used to generate a chirp signal by choosing the sweep mode to sine waveform with its frequency varying linearly with respect to time. This signal was fed to TektronixTDS-2022 (2 GS/s, 200MHz) dual-channel DSO. The overlapping display as shown in Fig. 3 was observed.2. Intelligent method of triggeringAccurate triggering lies solely on correct identification of the time period of waveform under consideration. For this purpose, pattern recognition scheme was implemented to identify the pattern in the signal [1] and thus obtain the time period of one complete cycle of the chirp. First, a fixed number of samples N are taken as reference pattern. Then the signal is shifted by one sample to form the test pattern. This pattern is then tested for its closeness' to the reference pattern. Closeness' can be defined as the distance by which test pattern is away from reference pattern.WHD is used as the decision function for closeness. Hamming distance is defined for two binary vectors as the number of different' bits are given their vectors. InWHD the different bits are given their binary weightingaccording to the bit position45and their weights according to the bit position and their weights are summed up. WHD of two binary n bit number x and a is given byIf X and A are two binary vectors of n-bits element, then WHD for these two vectorsis computed by summing up the element by element WHD and is given byFor a vector of dimension N, the samples are shifted N times and its closeness is computed at each shift.When these computations are done, the difference 洫in the signals is found to be minimum (ideally zero when no noise) when the cycle repeated itself. Following are the major steps involved and implemented for intelligent trigger mechanism.1. Acquiring the long enough signal using DAQ card and to convert the decimal values of samples into binary form.2.A fixed number(N) of binary samples are stored in array. The stored samples are shifted by a fixedc number of samples, n (=1,inthis case).3. The original saved samples and the shifted samples are XORed bit-by-bit.The result is then multiplied by a factor of 2, where I represent the position of bit.4.The summation of all the resulting values gives the WHD for nth shifts.65.A plot of WHD vs. n is made and the minimum is calculated by peak detection method. The difference between two successive minima is the trigger interval in number of samples.6. The number of samples multiplied by the sampling rate results in trigger interval (in seconds).As a test case WHD algorithm is implemented for the following triangular waveforrn in Fig.4.The waveform is sampled at 8 points per eycle. Each sampled value is 3 bit length.The step by step implementation is given below.WHD waveforrn is plotted using WHD(1), WHD(2), …, WHD(8), and the location of the minima gives the triggering interval. Fig.5 shows the WHD waveform also clearly indicating the trigger interval at 8th sample.The WHD VI(Fig.6) was developed for this task. It takes the waveform, whose triggering interval is to be found, and the no of samples, on which computation is to be done, as input and outputs the sample at which minima occurs along with the value of minima and the WHD waveform. For typical chirp signal WHD waveformis obtained as shown in Fig.7. The number of samples between two consecutive minima is equal to the number of samples in one cycle of the waveform. The product of the number of samples with the sampling interval is the triggering interval of the input signal. Thus, the virtual instrument could also display complex waveformswith considerable aese. Fig.7 shows triggering interval of 5 cycles.3. Frequency domain analysisFor simple signals the frequency analysis is performed by traditional tools like FFT. For such signals the Fourier Transform works well as their frequency components remain constant throughout the signal existence and hence there is no need forthe time-frequency relationship. In case of complex signals the frequency varies with time. FFT fails to analyze these signals as it gives information about thefrequency and its amplitude. Time information is lost.78In order to overcome this difficulty, there are JTFA tools iike Short TimeFourier Transform(STFT) and Wavelet Transform. These are implemented for the signals under consideration.The STFT is a modified form of Fourier Transform. In this technique the signal is rnultiplied with a window function and their product's Fourier Transform (2).The main principle behind this technique is that the window function(w) breaks down the signal into segments of small finite durtion. The frequency component of the signal during this segment is assumed to be constant. By computing the Fourier Transform for this segment the frequency vs. amplitude information is obtained. Then the window is moved to another segment by a step having the same duration as the previous one giving the frequency component for that segment. Thus the frequency for different time intervals gives time-frequency relationship.However, there is a disadvantage with this tecnique. The size of the window function used is fixed, thus STFT will have same resolution for low and high frequencies. Resolution is the certainty by which one can determine time or9frequency information. It is generally seen that a larger window leads to better frequency resolution and a small windowleads to better time resolution. Thus, it depends upon the user whether he wants frequency or time resolution. Even if there is a need for change of resolution, the user has to do the same manually.To overcome the resolution problern, a more advanced technique called Wavelet Transform is used these days. In this the window size can be altered, using a scalingparameter a. The equation for Wavelet Transform is given as wherea is the scaling parameter,b is the translation parameter,x(t) is the signal to beanalyzed andis the wavelet functionThe wavelet function <(t) is known as the mother wavelet .Its scaled and time shifted versions are known as the daughter wavelets. These daughter wavelets having varying size offer different frequency and time resolutions at different frequencies. The scale parameter a represents the freequency component in an inverse relation. Thus the valuc of scale is inversely proportional to frequency component.Initially the wavelet function has scale a=1 and is placed at the starting of the signal. The wavelet transform and thus the frequency component of that segment. Then the wavelet function is moved by b steps and the wavelet transform is computed for that segment. This procecdure is continued till the end of the signal. Thus Wavelet transform for a=1 and all the time steps till the end of signal getscomputed. Similarly the wavelet function is again placed at the start of the signal but with changed value of scale a. Theprocedure is continued till the Wavelet transform for each scale and time step combination has been computed.It can be observed that the computation of Wavelet Transform leads to a lot of redundancy.To reduce the redundancy, the scale values and the time steps can be linked using dyadic sampling. a= 2" and b=k 2' where n and k are integers. This leads to reduction in redundancy. This is called Discrete Wavelet Transform(DWT).4. ImplementationA DAQ card based virtual instrument was designed and developed inLabVIEW TM programming environment. This virtual instrument has the capability to generate intelligent software trigger as described above for complex waveforms like chirp. The main decisionns during design of the virtual instrument are: choosing the data acquisition card and, what is equally important, choosing the set of features the instrument should offer. The choice of the data acquistion card has a great influence on the efficiency of the whole instrument[7,8].Particular DAQ cards are differentiated by price and, the specification it offers.A low cost NIPCI-6035E, 16bit, 200KS/s card was chosen. The hardware was programmed at maximum sampling rate. A separate problem is designing software, which, in that case, is the main part of instrument design phase. The major features of the developed virtual instrument are:The capability to acquire and process simple and complex waveforms.Dual channel mode: The instrument is capable of displaying two inputs simultaneously and can perform simple mathoperations between the two.Auto set: Runs the WHD code to re-compute the trigger interval for the new signal and thus achieve a stable display. In case, the two inputs do not have the same frequency, the LCM of the trigger intervals of A and B is found to so that integral number of cycles of both the channels can be shown simultaneously.Time domain measurements: The signal being displayed in time domain are measured on various parameters-Amplitude-Peak to peak-Mean(DC)-RMS101112Fig. 9. The results of wavelet transrorm implemented in the virtual instrument. (Channel A analyzing sine signal and Channel B analyzing a chirp signal). Frequency Domain Aalysis: The plot of Magnitude vs. frequency, Phase vs. frequency and the facility to choose the windowing function.STFT based Joint Time Frequency Analysis (JTFA): The spectrogram with the additional choices of the plotting the graph with scale in decibels, windowing functions and the window length for STFT analysis.Wavelet based Joint Time Frequency Analysis(JTFA):The scalogram which plots scales vs. time steps, choice of time-frequency sampling parameters like time steps and scales and the choice of wavelet functions.For the frequency domain analysis, DSP toolkit available withLabVIEW softwarewas utilized. Standard functions are available in the toolkit. The virtual instrument thus developed is intelligent as it takes different actions with different signals contrary to a digital storage oscilloscope. Trigger implemented enables us to obtian the correct value of the time period and a stable display. Analysis of complex signals can also be performed using this instrument. Fig.8 shows the front Panel of the virtual instrument showing Time-domain measurements. Fig.9 shows the time frequency relationship on both the channel B analyses the chirp signal. As seen clearly the chirp signal shows the varying frequency with time.5. Limitations of developed virtual instrumentSamples for few cycles are required to determin the triggering interval. One need to optimize tbe appropriate sampling rate and the number of samples to be processed. The processing time taken by the WHD technique is directly proportional to the number of samples and hence to the sampling rate as the higher sampling rate leadsto the more number of samples per cycle. The time required to compute trigger also depends upon the speed of the computing system. For large amount of data (if high sampling rates us fixed), computationally heavy WHD algorithm and other features for more analysis, the butter might overflow leading to loss of data. Every time the input waveform is changed user has to do retriggering.6. Conclusion and discussionSuccessful development of the virtual instrument with the capability of acquiring, displaying and analyzing complex signals is done. The instrument over comes the shortcomings of theDSOs, found commonly in laboratories, in achieving stable display for complex signals. The developd instrument is cost effective and flexible in nature and had the large number of features to choose from. The computer towards the measurement systems. The VI developed is expected to go a long way in the instrumentation area.1314 基于混合信号的数据采集卡的虚拟示波器摘要:复杂的信号在声纳、雷达、回声定位系统和谐振频率的研究中有多种应用。
Labview外文翻译(带中文对照)
LabVIEWLabVIEW is a highly productive graphical programming language for building data acquisition an instrumentation systems.With LabVIEW, you quickly create user interfaces that give you interactive control of your software system. To specify your system functionality,you simply assemble block diagrams - a natural design notation for scientists and engineers. Tis tight integration with measurement hardware facilitates rapid development of data acquisition ,analysis,and presentation bVIEW contains powerful built -in measurement analysis and a graphical compiler for optimum performance. LabVIEW is available for Windows 2000/NT/Me/9x, Mac OS, Linux, Sun Solaris, and HP-UX, and comes in three different development system options.Faster DevelopmentLabVIEW accelerates development over traditional programming by 4 to 10 times! With the modularity and hierarchical structure of LabVIEW, you can prototype ,design, and modify systems in a short amount of time. You can also reuse LabVIEW code easily and quickly in other applications.Better InvestmentUsing a Lab VIEW system, each user has access to a complete instrumentation laboratory at less than the cost of a single commercial instrument. In addition, user configurable LabVIEW systems are flexible enough to adapt to technology changes, resulting in a better bong-term investment.Optimal PerformanceAll LabVIEW applications execute at compiled speed for optimal performance. With the LabVIEW Professional Development System or Application Builder, you can build stand-alone executables or DLLs for secure distribution of your code. You can even create shared libraries or DLLs to call LabVIEW code from other programming languages.Open Development EnvironmentWith the open development environment of LabVIEW, you can connect to other applications through ActiveX, the Web, DLLs, shared libraries, SQL(for databases), DataSocket, TCP/IP,and numerous other e LabVIEW to quickly create networked measurement and automation systems that integrate the latest technologies in Web publishing and remote data sharing. LabVIEW also has driver libraries available for plug-in data acquisition, signal conditioning , GPIB,VXI,PXI, computer-based instruments,serial protocols, image acquisition, and motion control. In addition to the LabVIEW development systems, National Instruments offers a variety of add-on modules and tool sets that extend the functionality of LabVIEW .This enables you to quickly build customizable, robust measurement and automation systems.LabVIEW Datalogging and Supervisory Control ModuleFor high channel count and distributed applications, the LabVIEW Datelogging and Supervisory Control Module provides a complete solution. This module delivers I/O management, event logging and alarm management, distributed logging, historical and real-time trending, built-in security, configurable networking features, OPC device connectivity, and over 3,300 built-in graphics.LabVIEW Real-TimeFor applications that require real-time performance, National Instruments offers LabVIEWReal-Time. LabVIEW Real-Time downloads standard LabVIEW code to a dedicated hardware target running a real-time operating system independent from Windows.LabVIEW Vision Development ModuleThe LabVIEW Vision Development Module is for scientists, automation engineers,and technicians who are developing LabVIEW machine vision and scientific imaging applications. The LabVIEW Vision Development Module includes IMAQ Vision, a library of vision functions, and IMAQ Vision Builder, an interactive environment for vision applications. Unlike any other vision products, IMAQ Vision Builder and IMAQ Vision work together to simplify vision software development so that you can apply vision to your measurement and automation applications.Countless ApplicationsLabVIEW applications are implemented in many industries worldwide including automotive, telecommunications, aerospace, semiconductor, electronic design and production, process control, biomedical, and many others, Applications cover all phases of product development from research to design to production and to service. By leveraging LabVIEW throughout your organization you can save time and money by sharing information and software.Test and MeasurementLabVIEW has become an industry-standard development tool for test and measurement applications. With Test Stand, LabVIEW-based test programs, and the industry's largest instrument driver library, you have a single, consistent development and execution environment for your entire system.Process Control and Factory AutomationLabVIEW is used in numerous process control and factory automation applications.Many scientists and engineers look to LabVIEW for the high speed, high channel count measurement and control that graphical programming offers.For large, complex industrial automation and control applications, the LabVIEW Data logging and Supervisory Control Module provides the same graphical programming as LabVIEW, but is designed specifically for monitoring large numbers of I/O points, communicating with industrial controllers and networks, and providing PC-based control.Machine Monitoring and ControlLabVIEW is ideal for machine monitoring and predictive maintenance applications that need deterministic control, vibration analysis, vision and image processing, and motion control. With the LabVIEW platform of products including LabVIEW Real-Time for real-time deterministic control and the LabVIEW Data logging and Supervisory Control Module, scientists and engineers can create powerful machine monitoring and control applications quickly and accurately.Research and AnalysisThe integrated LabVIEW measurement analysis library provides everything you need in an analysis package. Scientists and researchers have used LabVIEW to analyse and compute real results for biomedical, aerospace, and energy research applications, and in numerous other industries. The available signal generation and processing, digital filtering, windowing, curve-fitting, For specialized analysis, such as joint time-frequency analysis, wavelet,and model-based spectral analysis, LabVIEW offers the specially designed Signal Processing Toolset.The Sound and Vibration Toolset offers octave analysis, averaged and nonaveraged frequency analysis, transient analysis, weighted filtering, and sound-level measurement, and more.Draw Your Own SolutionWith LabVIEW, you build graphical programs called virtual instruments (VIs) instead of writing text-based programs. You quickly create front panel user interfaces that give you the interactive control of your system. To add functionality to the user interface, you intuitively assemble block diagrams- a natural design notation for engineers and scientists.Create the Front PanelOn the front panel of your VI, you place the controls and data displays for your system by selecting ob jects from the Controls palette, such as numeric displays, meters, gauges, thermometers, LEDs, charts,and graphs.When you complete and run your VI,you use the front panel to control your system whether you move a slide, zoom in on a graph, or enter a value with the keyboard.Construct the Graphical Block DiagramTo program the VI, you construct the block diagram without worrying about the syntactical details of text-based programming languages. You do this by selecting objects (icons) from the Functions palette and connecting them together with wires to transfer data among block diagram objects. These objects include simple arithmetic functions, advanced acquisition and analysis routines, network and file I/O operations, and more.Dataflow ProgrammingLabVIEW uses a patented dataflow programming model that frees you from the linear architecture of text-based programming languages. Because the execution order in LabVIEW is determined by the flow of data between nodes,and not by sequential lines of text,you can create block diagrams that execute multiple operations in parallel. Consequently, LabVIEW is a multitasking system capable of running multiple execution threads and multiple VIs in parallel.Modularity and HierarchyLabVIEW VIs are modular in design, so any VI can run by itself or as part of another VI. You can even create icons for your own VIs, so you can design a hierarchy of VIs that serve as application building blocks. You can modify, interchange, and combine them with other VIs to meet your changing application needs.Graphical CompilerIn many applications, execution speed is critical. LabVIEW is the only graphical programming system with a compiler that generates optimized code with execution speeds comparable to compiled C programs. You can even use the LabVIEW profiler to analyse and optimize time-critical operations. Consequently, you increase your productivity with graphical programming without sacrificing execution speed.Measurements and MathematicsLabVIEW includes a variety of other measurement analysis tools. Examples include curve fitting, signal generation, peak detection, and probability and statistics. Measurement analysis functions can determine signal characteristics such as DC/RMS levels, total harmonic distortion (THD),impulse response, frequency response, and cross-power spectrum. LabVIEW users can also deploy numerical tools for solving differential equations, optimization, root finding, and other mathematical problems.In addition, you can extend these built-in capabilities by entering MATLAB or HIQ scripts directly in your LabVIEW programs. For charting and graphing, you can rely on the built-in LabVIEW 2D and 3D visualization tools. 2D tools include features such as autoscaling X and Y ranges, reconfigurable attributes (point/line styles, colors, and more)andcursors, Microsoft Windows users can employ OpenGL-based 3D graphs and then dynamically rotate, zoom, and pan these graphs with the mouse.Development SystemThe LabVIEW Professional Development System facilitates the development of high-end, sophisticated instrumentation systems for developers working in teams, users developing large suites of VIs, or programmers needing to adhere to stringent quality standards.Built on the Full Development System, the Professional Development System also includes the LabVIEW Application Builder for building stand-alone executables and shared libraries (DLLs)and creating distribution kits. In addition, the development system furnishes source code control tools and offers utilities for quantitatively measuring the complexity of your applications. With graphical differencing, you can quickly identify both cosmetic and functional differences between two LabVIEW applications.We include programming standards and style guides that provide direction for consistent LabVIEW programming methodology. The system also contains quality standards documents that discuss the steps LabVIEW users must follow to meet internal regulations or FDA approval. The Professional Development System operates on Windows 2000/NT/Me/9x,Mac OS, HP-UX, and Linux.LabVIEW Full Development SystemThe LabVIEW Full Development System equips you with all of the tools you need to develop instrumentation systems. It includes GPIB, VISA, VXI, RS-232, DAQ, and instrument driver libraries for data acquisition and instrument control. The measurement analysis add DC/RMS measurements, single tone analysis, harmonic distortion analysis, SINAD analysis, limit testing, signal generation capabilities, signal processing, digital filtering, windowing, curve fitting, statistics, and a myriad of linear algebra and mathematical functions. The development system also provides functions for direct access to DLLs, ActiveX, and other external code. Other features of the system include Web publishing tools, advanced report generation tools, the ability to call MATLAB and HiQ scripts, 3D surface, line, and contour graphs, and custom graphics and animation. The Full Development System operates on Windows 2000/NT/Me/9x, Mac OS, HP-UX, and Linux.LabVIEW Base PackageUse the LabVIEW Base Package, the minimum LabVIEW configuration, for developing data acquisition and analysis, instrument control, and basic data presentation. The Base Package operates on Windows 2000/NT/Me/9x.Debug License for LabVIEWIf you deploy LabVIEW applications, including LabVIEW tests for use with Test Stand, the debug license allows you to install the LabVIEW development system on the target machines so you can step into your test code for complete test debugging. This license is not intended for program development.虚拟仪器(LabVIEW)虚拟仪器是一种高效用于构建数据采集与监测系统图形化编程语言。
外文翻译---基于LabVIEW的电流互感器校验仪
附录A LabVIEW Based Instrument Current Transformer CalibratorXin Ai Hal Bao Y.H. Song1) North China Electric Power University, Beijing, China 1072062) Brunel University. UKABSTRACTThe Virtual Instrument (VI) mainly refers to build all kinds of instruments by software such as LabVIEW, which likes a real instrument build in a computer. Its' main characteristics are flexibility, multi-functions, multiple uses for one PC computer, giving high performance, and is less costly. In this paper, the VI technology is applied to the test and measurement of instrument current transformer (TA). By using the LabVIEW, the TA accuracy calibrator was developed. This virtual T.4 calibrator can automatically measure the accuracy of T.4 and can indicate the ratio error and phase error curves. The tests and calibration for the TA show that the virtual TA calibrator can be used in place of the traditional calibrator and is much better than the traditional one.Keywords:Instrument current transformer (TA), TA calibrator, Virtual Instruments, LabVIEW.I. INTRODUCTIONSince 1992 the VXIbus Rev.1.4 standard was established by the United States and LabVIEW was presented by the National Instruments co.(Nl), the Virtual Instrument (VI) have lain the foundation for its commercial use. The main characteristic of Virtual Instrument is that it makes instruments by software. Most of the traditional instrument can be developed by VI. The VI is a real instrument made by the personal computer.The Instrument current transformer (TA) is widely used in all kinds of current measurement and it has the functions of protection, isolation and extending the measuring range. With the rapid development of computer measurement and controltechnology, and with the sequent emergence of current transformer and transducer, there is an increasing number of current transformers with high accuracy and low secondary current. The standard TA secondary current is usually1A or 5A: some non-standard TA secondary current may be 0 1A or lower. Although we have the technique to make this kind of calibrator by means of hardware such as single chip computer and electronic circuit, DSP and so on, it will cost too much money for these no-standard calibrator and will take too much time and the calibrator made by these hardware mill not be satisfactory in both function and practicality for designing all kinds of new TA.The calibrator that adopts VI technology not only can meet the requirements of the traditional one but also can satisfy customers with such advantages as multi-functions, convenience, and high ratio between performance and cost. The experiment results indicate that the virtual calibrator can provide excellent condition for TA measurement and design. The VI technology and personal computer must be widely used in the area of calibration on instrument transformer.Ⅱ. THE WORKING PRINCIPLE OF TA CALIBRATOR The error of TA includes ratio error and phase error. The measuring of the error of TA or the calibration of the accuracy of TA usually applies differential measuring method. The method needs a standard TA except the measured TA and a TA calibrator. There is the same turn ratio between the standard and measured T4 and the standard TA's accuracy should be 2 levels higher than the measured one. The calibrator function lies in forming comparison circuits, measuring, and showing the error at all range. The comparison circuit, also referred to the difference measuring principle circuit, is showed in Fig. 1. By measuring the voltage on I, and Rd, calculate the corresponding current. Then the calibrator can indicate the error.When a TA has the same turn ratio between the primary and secondary winding, the self-comparison circuit could be used and is shown in Fig.2. In the figures, TA0 and TAX are standard and TA being measured respectively. Np and Ns are primary and secondary winding turns. ip and io, id, i, are primary current secondary standard current, secondary error current, secondary current of TA being measured respectively. Ro and R,R, are secondary winding's resistance of standard TA, error current detecting resistance, burden resistance of TA being measured respectively. To and K, Tb. T, are voltage sampling points which can calculate the current In this paper, only voltage between K and T, voltage between Tb and T, are being measured and they represent the voltage on R, and R, respectively.In general, the TA calibrator's principle of the sample resistance should be: 1) it can not affect the accuracy of the comparison circuit. In the ideal condition R, and Rd should be 0, but it can not be sampled. So there must be sample resistance, in this paper, R, as shown in Fig, is used;1)the magnitude of the sample resistance should make the sampled standard current and error current in pro rata and should not have too much difference. The sampled resistance is set by experiment: R, is the secondary standard current sampling resistance and can be 0.1-0.50, R, is the error current sampling resistance and can be, R, is the burden resistance and it depends on the TA being measured. E$ sampling the voltage uo and U, on R, and R, respectively, the ratio error and phase error are showed on the LED through some process and calculations.According to the TA error's phase diagram, when io is maximum, the value of id is the ratio error; when io changes from negative to positive and equals to 0, the value of id is the phase error. For the same principle, the relationship is equal to the voltage signal U, and ud. showed in Fig.3. a and b is represent the ratio error and phase error separately. the TA's real ratio error C and phase error 6 can be found out through proper calculation,Where U, is the amplitude of uo The T.4 calibrator doesn't need very high accuracy. 1% to 3% error for the calibrator is enough. Because of the difference measuring principle, the error is the read error of calibrator, that is, the TA's error's error being measured. But the calibrator needs to have a suitable enlargement factor. The calibrator maximum enlargement factor through all channels should be 1000 times.III. THE PRINCIPLE OF VIRTUAL CA LIBRATORThe Virtual Instrument consists of three parts: the external comparison circuit (showed in Fig.1 or Fig.2), data acquisition card (PCI-6023) installed in the PC and the VI program by LabVIEW Then, after the two channels' signal U, and ud come into the PC through the ADC, the rest of the work is done by the software. In this paper we use voltage U, on R, substitute for U, approximatively. The virtual calibrator's work flow chart is shown as follow:1) Set the essential initial values of the virtual calibrator;2) Press the start button to start to work, adjusting the voltage regulator andchanging the primary current, let the ratio between primary current and the rated current change from10% to 120%;3) The VI program will group the voltage signal U, and ud , then use the digitalfilter to eliminate the harmonic:4) Calculate the root-mean-square (RMS) value of tlx and 14, find out the amplitude of 21;5) Calculate the RMS valve of io (substitute for f, ), i, and the ratio between io and it's rated current and show the results.6) Find out the a and b showed in Fig. 3, calculate the ratio error and phase error and show the results.7) Set the L times loop, record and show the errors acquired by every time,8) Show and print all the results of calibration.9)Stop.The front panel of the virtual calibrator has the Controls, indictor and Switch.The function of Controls is to set the initial value before it works, The function of the Indictor is to show at1 kinds of needed values, including digital, curve and diagram etc.. 'The switch decides the start and stop of the virtual calibrator.Of course, to change the measuring range, the operator needs to adjust the voltage regulator and change the primary current. This operation is necessary like that of the traditional calibration, but the recording for the error in any range is done by the virtual calibration. This confirms the accuracy of recording and relieves the operator's work. The use of virtual calibrator is most interesting.The controls of virtual calibrator include:1) Setting the two sampling (analogue input) channels;2) Setting the magnitude of sampling resistance in the comparison circuit;3) Setting the secondary rated current of measured TA;4) Setting the number of sampling of error curve;The Indictor of virtual calibrator has:1) Showing ratio and phase error, ratio between the primary current and the rated ones in digital;2) Showing ratio and phase error, ratio between the primary) current and the ratedones In curves and diagram, where the curve include the active sampling points and function fitting curves;3) Showing the error for the ratio between the primary current and the rated current from 10% to 1 20°%;4) Showing the waveform of standard and error current, digital value of amplitude;5) Showing of digita1 RMS value the standard and error current;6) Showing the pole of TA in the comparison circuit;The above shows that the function of virtual calibrator is greatly expended that of the traditional ones. 7111s kind of calibrator is not only convenient to use, but also makes the performance of the calibrator much better. From the function that shows the waveform, we can find out if there are some harmonics in the current, and confirm the accuracy for the calibrator.IV. EXPERIMENTThe virtual calibrator is mainly characterized by the flexibility compared with the traditional ones. Although the front panel has many functions, they can be easily extended by the user. So the virtual calibrator is of important value for the non-standard TA calibration.In the experiment, the primary current produce by a step-up current transformer and its' current controlled by a voltage regulator. Through fitting the comparison circuit, the measuring range of the virtual calibrator can be set in any value. This paper gives SA and 0.1A two kinds of TA’s calibration experiment. The pa rameter and method, results are presented below.A. 5A TA experimentThe parameter of TA being measured is:Because of the 1:1 ratio of turn, the calibration for it doesn't need standard TA. The calibration circuit show in Fig2 We can apply self calibration method to measure it’s accuracy. The results are presented in the Ftg.4 and Fig5 and show that this TA's accuracy can be defined as 0.5 degree.B. 0.1A TA experimentThe parameter of standard TA:From the Fig4 and 5, the accuracy of the TA being measured can be defined as 0.5 degree. In the experiment, the input signal of virtual calibrator should be properly grounded to avoid the disturbance. The sampling resistance in the comparison circuit should use precise ones and with no induction.V. CONCLUSIONSThe VI technique is one of the new scientific and technique productions. Theappearance of VI is called“Revolution of Measuring and Control Technology”. According to the development of the software and hardware for computers, the VI t~hn01Ogy will have more developing space. The VIS will replace most of the traditional ones in the 21th century. With its flexibility, the virtual calibrator can measure any kind of T.4 including standard and non-standard ones. But the traditional calibrator can not measure most of the non-standard TA. It can record and save, display the data automatically. The method presented in this paper gives a new way to make he TA calibration. The main characteristics of the virtual calibrator are:1) Flexibility, virtual calibrator is mainly made of LabVIEW software and can beeasily modified by rewrite some software;2.) Multi function, VI is designed on PC. It has waveform indictor, parametercontrols and so on. At the time we calibrating a TKs accuracy, these functions can indicate many information such as waveform quality and so on;3) Convenience to carry and use;4) High efficiency and accuracy.;5) High ratio between performance and cost;6) For multiple use in one PC.7) It can record and save, display the calibration data automatically.基于LabVIEW的电流互感器校验仪Xin Ai Hai Bao T. H. Song---布鲁塞尔大学摘要虚拟仪器(VI),指的是利用软件在计算机上建立各种各样的仪器,比如说LabVIEW,就象是真的建立在计算机上的仪器一样。
Labview毕业论文毕业论文中英文资料外文翻译文献

Labview毕业论文毕业论文中英文资料外文翻译文献中英文资料Draw Your Own SolutionWith LabVIEW, you build graphical programs called virtual instruments (VIs) instead of writing te某t-based programs. You quickly create front panel user interfaces that give you the interactive control of your system. To add functionality to the user interface, you intuitively assemble block diagrams- a natural design notation for engineers and scientists.Create the Front PanelConstruct the Graphical Block DiagramTo program the VI, you construct the block diagram without worrying about the syntactical details of te某t-based programming languages. You do this by selecting objects (icons) from the Functions palette and connecting them together with wires to transfer data among block diagram objects. These objects include simple arithmetic functions, advanced acquisition and analysis routines, network and file I/O operations, and more.Dataflow ProgrammingLabVIEW uses a patented dataflow programming model that frees you from the linear architecture of te某t-basedprogramming languages. Because the e某ecution order in LabVIEWis determined by the flow of data between nodes,and not by sequential lines of te某t,you can create block diagrams that e某ecute multiple operations in parallel. Consequently, LabVIEWis a multitasking system capable of中英文资料running multiple e某ecution threads and multiple VIs in parallel.Modularity and HierarchyMeasurements and MathematicsLabVIEW includes a variety of other measurement analysis tools. E某amples include curve fitting, signal generation, peak detection, and probability and statistics. Measurement analysis functions can determine signal characteristics such as DC/RMS levels, total harmonic distortion (THD),impulse response, frequency response, and cross-power spectrum. LabVIEW users can also deploy numerical tools for solving differential equations, optimization, root finding, and other mathematical problems.In addition, you can e某tend these built-in capabilities byentering MATLAB or HIQ scripts directly in your LabVIEW programs. For charting and graphing, you can rely on the built-in LabVIEW2D and 3D visualization tools. 2D tools include features such as autoscaling X and Y ranges, reconfigurable attributes(point/line styles, colors, and more)and cursors, Microsoft Windows users中英文资料can employ OpenGL-based 3D graphs and then dynamically rotate, zoom, and pan these graphs with the mouse.Development SystemLabVIEW Full Development SystemThe LabVIEW Full Development System equips you with all of the tools you need to develop instrumentation systems. It includes GPIB, VISA, VXI, RS-232, DAQ, and instrument driver libraries for data acquisition and instrument control. The measurement analysis add DC/RMS measurements, single tone analysis, harmonic distortion analysis, SINAD analysis, limit testing, signal generation capabilities, signal processing, digital filtering, windowing, curve fitting, statistics, and a myriad of linear algebra and mathematical functions. The development system also provides中英文资料functions for direct access to DLLs, ActiveX, and other e某ternal code. Other features of the system include Web publishing tools, advanced report generation tools, the ability to call MATLAB and HiQ scripts, 3D surface, line, and contour graphs,and custom graphics and animation. The Full Development System operates on Windows 2000/NT/Me/9某, Mac OS, HP-UX, and Linu某.LabVIEW Base PackageUse the LabVIEW Base Package, the minimum LabVIEW configuration, for developing data acquisition and analysis, instrument control, and basic data presentation. The Base Package operates on Windows 2000/NT/Me/9某.Debug License for LabVIEW。
虚拟仪器的简介外文翻译
中文3800字毕业设计(论文)外文资料翻译系(院):交通工程系专业:车辆工程姓名:学号:外文出处:LabVIEW based Advanced Instrumentation Systems, 2007: 1-31(用外文写)附件: 1.外文资料翻译译文;2.外文原文。
附件1:外文资料翻译译文虚拟仪器的简介Author : Grzegorz Polakqw , Mieczyslaw摘要:本文介绍了基于Lab VIEW软件虚拟仪器的技术特点和设计方法。
虚拟仪器的关键技术是应用软件,仪器的主要功能多是由软件来实现的。
所谓“软件即仪器”。
目前设备多采用单一模拟器技术,无法真正实现装备的实际性能。
使用虚拟仪器不但可以节约大量模拟设备的经费投入,而且能够提高质量与效率。
与目前大多数模拟设备的经费投入,而且能够提高质量和效率。
与目前大多数模拟设备相比,虚拟仪器能够让使用人员主动参与生产过程甚至设计过程。
有利于使用者进行主动和与探索式学习。
关键词:虚拟仪器 Lab VIEW 设计学习目标读者在完成本章阅读将有下面一个了解:—虚拟仪器的历史—虚拟仪器的演变—虚拟仪器的定义—虚拟仪器的体系结构—Lab VIEW的演变—使用Lab VIEW创建的虚拟仪器—Lab VIEW的优势—虚拟仪器在发动机工程的应用—超越个人电脑的虚拟仪器1.1简介一种基于用户从环境或从被测单元收集数据,并显示信息的一种仪器,这样一种仪器可以采用变频器来测试如随着温度或压力的变化的物理参数的变化,采集信息并将其转换成相应的电信号,例如电压和频率的变化。
这种仪器也被定义为一种物理软件设备。
它对获得的来自另一台仪器的数据进行分析和处理,然后在显示器或录音设备上输出数据,这种记录仪包括示波器,频谱分析仪等。
基于对源数据的收集和分析的这种形式仪器得到广泛应用。
1.2虚拟仪器简介虚拟仪器是一个跨学科领域,包括温度、压力、距离、光和声音的频率和振幅,以及包括电压、电流和频率在内的电气参数。
基于LabVIEW的虚拟仪器外文翻译
基于LabVIEW的虚拟仪器模拟风力太阳能系统混合动力站(节选)介绍在最简单的层面上,数据采集可以手动完成如使用纸笔记录读数或任何其他工具。
对于某些应用这种形式的数据采集是足够的。
然而,数据记录中的应用这需要大量的数据读数,非常频繁的录音是有必要的,它包括了仪器或微控制器获取和记录数据准确(1995里格比和多尔比,)。
急诊化验室虚拟仪器工程平台(LabVIEW)是一个功能强大的灵活的仪器仪表和分析应用软件工具,(美国国家仪器仪表,2002)在今天这新兴技术并被广泛采用的学术界,工业LabVIEW已成为一个重要的工具,已代替了政府实验室数据的标准采集,仪器控制和分析软件。
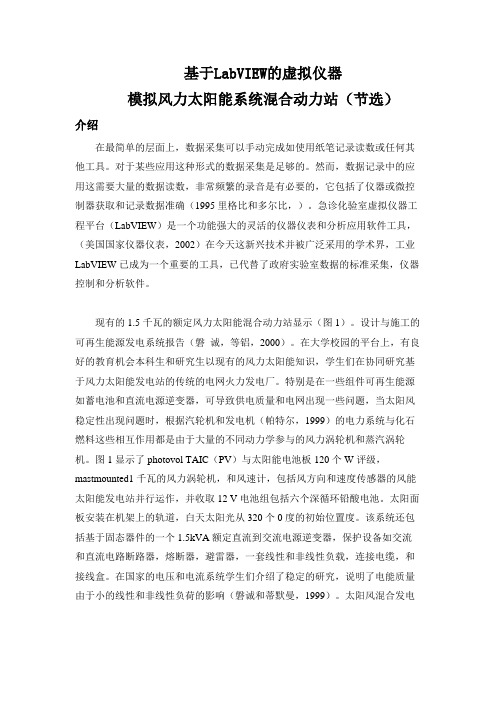
现有的1.5千瓦的额定风力太阳能混合动力站显示(图1)。
设计与施工的可再生能源发电系统报告(磐诚,等铝,2000)。
在大学校园的平台上,有良好的教育机会本科生和研究生以现有的风力太阳能知识,学生们在协同研究基于风力太阳能发电站的传统的电网火力发电厂。
特别是在一些组件可再生能源如蓄电池和直流电源逆变器,可导致供电质量和电网出现一些问题,当太阳风稳定性出现问题时,根据汽轮机和发电机(帕特尔,1999)的电力系统与化石燃料这些相互作用都是由于大量的不同动力学参与的风力涡轮机和蒸汽涡轮机。
图1显示了photovol TAIC(PV)与太阳能电池板120个W评级,mastmounted1千瓦的风力涡轮机,和风速计,包括风方向和速度传感器的风能太阳能发电站并行运作,并收取12 V电池组包括六个深循环铅酸电池。
太阳面板安装在机架上的轨道,白天太阳光从320个0度的初始位置度。
该系统还包括基于固态器件的一个1.5kVA额定直流到交流电源逆变器,保护设备如交流和直流电路断路器,熔断器,避雷器,一套线性和非线性负载,连接电缆,和接线盒。
在国家的电压和电流系统学生们介绍了稳定的研究,说明了电能质量由于小的线性和非线性负荷的影响(磐诚和蒂默曼,1999)。
Labview外文翻译
LabVIEWLabVIEW is a highly productive graphical programming language for building data acquisition an instrumentation systems.With LabVIEW, you quickly create user interfaces that give you interactive control of your software system. To specify your system functionality,you simply assemble block diagrams - a natural design notation for scientists and engineers. Tis tight integration with measurement hardware facilitates rapid development of data acquisition ,analysis,and presentation bVIEW contains powerful built -in measurement analysis and a graphical compiler for optimum performance. LabVIEW is available for Windows 2000/NT/Me/9x, Mac OS, Linux, Sun Solaris, and HP-UX, and comes in three different development system options.Faster DevelopmentLabVIEW accelerates development over traditional programming by 4 to 10 times! With the modularity and hierarchical structure of LabVIEW, you can prototype ,design, and modify systems in a short amount of time. You can also reuse LabVIEW code easily and quickly in other applications.Better InvestmentUsing a Lab VIEW system, each user has access to a complete instrumentation laboratory at less than the cost of a single commercial instrument. In addition, user configurable LabVIEW systems are flexible enough to adapt to technology changes, resulting in a better bong-term investment.Optimal PerformanceAll LabVIEW applications execute at compiled speed for optimal performance. With the LabVIEW Professional Development System or Application Builder, you can build stand-alone executables or DLLs for secure distribution of your code. You can even create shared libraries or DLLs to call LabVIEW code from other programming languages.Open Development EnvironmentWith the open development environment of LabVIEW, you can connect to other applications through ActiveX, the Web, DLLs, shared libraries, SQL(for databases), DataSocket, TCP/IP,and numerous other e LabVIEW to quickly create networked measurement and automation systems that integrate the latest technologies in Web publishing and remote data sharing. LabVIEW also has driver libraries available for plug-in data acquisition, signal conditioning , GPIB,VXI,PXI, computer-based instruments,serial protocols, image acquisition, and motion control. In addition to the LabVIEW development systems, National Instruments offers a variety of add-on modules and tool sets that extend the functionality of LabVIEW .This enables you to quickly build customizable, robust measurement and automation systems.LabVIEW Datalogging and Supervisory Control ModuleFor high channel count and distributed applications, the LabVIEW Datelogging and Supervisory Control Module provides a complete solution. This module delivers I/O management, event logging and alarm management, distributed logging, historical and real-time trending, built-in security, configurable networking features, OPC device connectivity, and over 3,300 built-in graphics.LabVIEW Real-TimeFor applications that require real-time performance, National Instruments offers LabVIEWReal-Time. LabVIEW Real-Time downloads standard LabVIEW code to a dedicated hardware target running a real-time operating system independent from Windows.LabVIEW Vision Development ModuleThe LabVIEW Vision Development Module is for scientists, automation engineers,and technicians who are developing LabVIEW machine vision and scientific imaging applications. The LabVIEW Vision Development Module includes IMAQ Vision, a library of vision functions, and IMAQ Vision Builder, an interactive environment for vision applications. Unlike any other vision products, IMAQ Vision Builder and IMAQ Vision work together to simplify vision software development so that you can apply vision to your measurement and automation applications.Countless ApplicationsLabVIEW applications are implemented in many industries worldwide including automotive, telecommunications, aerospace, semiconductor, electronic design and production, process control, biomedical, and many others, Applications cover all phases of product development from research to design to production and to service. By leveraging LabVIEW throughout your organization you can save time and money by sharing information and software.。
基于LabVIEW的虚拟仪器设计实验
基于LabVIEW的虚拟仪器设计实验张巧梅专业:电子信息工程摘要:随着电子技术、计算机技术的高速发展及其在电子测量技术与仪器领域中的应用,新的测试理论、方法以及新的仪器结构不断出现,虚拟仪器也随之出现并得到了很大的发展。
目前在这一领域内,使用较为广泛的计算机语言是美国NI公司的LabVIEW。
LabVIEW(Laboratory Virtual instrument Engineering Workbench)是一种图形化的编程语言开发环境,LabVIEW也是一种通用编程系统,具有各种各样、功能强大的函数库,包括数据采集、GPIB、串行仪器控制、数据分析、数据显示及数据存储,甚至还有目前十分热门的网络功能,是一个功能强大且灵活的软件。
LabVIEW也有完善的仿真、调试工具,如设置断点、单步等,其动态连续跟踪方式,可以连续、动态地观察程序中的数据及其变化情况,并且LabVIEW与其它计算机语言相比,有一个特别重要的不同点:其它计算机语言都是采用基于文本的语言产生代码行,而LabVIEW采用图形化编程语言--G语言。
关键词 LabVIEW软件虚拟仪器实验设计Abstract: With the electronic technology, computer technology's rapid development in electronic measurement and instrument field of application of testing new theories,Virtual instrument has emerged and obtained very big development.Now in this field,Using a wide range of computer language is the NI company bVIEW is a kind of graphical programming language,of the development bVIEWalso is a kind of common programming system,With various and powerful function,Including data acquisition, GPIB,Serial instrumen t control,Data analysis,Data display and data storage,Even now very popular network function,Is a powerful and flexible software.LabVIEW also have simulation and Debugging tools.If set breakpoint and Single-step etc.The dynamic continuosly,Can continuously and dynamic observations of the data and programs.And with other computer language LabVIEW have a particularly important difference: Other computer language is based on the text of the language code, but LabVIEW using graphical programming language - G language. Keywords: LabVIEW Software Virtual instrument Experiment目录引言 (4)1.虚拟仪器系统概述 (4)1.1.虚拟仪器概念 (4)1.2.虚拟仪器的特点 (4)1.3.虚拟仪器的分类 (5)1.4.虚拟仪器的软件开发环境 (5)2.图形化编程语言LabVIEW (5)2.1.LabVIEW概述 (5)2.2.LabVIEW的使用 (6)3.LabVIEW虚拟仪器实验 (7)3.1.一个虚拟温度报警器 (7)3.1.1.此实验的前面板设置 (7)3.1.2.此实验的程序框设置 (7)3.1.3.结果演示 (13)3.2.一个虚拟示波器 (14)3.2.1.前面板设置 (14)3.2.2.函数程序框图 (19)3.2.3.演示结果 (21)3.3.一个虚拟滤波器 (23)3.3.1.前面板设置 (23)3.3.2程序框设计 (23)3.3.3.运行结果: (25)结束语 (26)参考文献 (27)引言虚拟仪器是基于计算机的软硬件测试平台,它可代替传统的测量仪器,如示波器,逻辑分析仪,信号发生器,频谱分析仪等;可集成于自动控制,工业控制系统;可自由构建成专有仪器系统。
基于LabVIEW的虚拟仪器设计与应用
基于LabVIEW的虚拟仪器设计与应用LabVIEW是一款由美国国家仪器公司(National Instruments)开发的图形化编程语言和集成开发环境,广泛应用于虚拟仪器设计与控制系统开发。
本文将介绍基于LabVIEW的虚拟仪器设计与应用,包括LabVIEW的特点、虚拟仪器设计原理、应用案例等内容。
1. LabVIEW简介LabVIEW全称Laboratory Virtual Instrument Engineering Workbench,是一种用于快速开发、测试和部署基于虚拟仪器的工程应用程序的软件系统。
LabVIEW以图形化编程为特色,用户可以通过拖拽、连接图形化元件来构建程序,而无需编写传统的文本代码。
这种直观的编程方式使得LabVIEW成为工程师和科学家们喜爱的工具之一。
2. LabVIEW的特点图形化编程:LabVIEW采用数据流图(Dataflow Diagram)作为编程范式,用户通过将各种函数模块进行连接来实现程序逻辑,直观清晰。
丰富的函数库:LabVIEW提供了丰富的函数库,涵盖了数据采集、信号处理、控制算法等各个领域,用户可以方便地调用这些函数来完成各种任务。
跨平台支持:LabVIEW支持多种操作系统,包括Windows、macOS和Linux,用户可以在不同平台上进行开发和部署。
3. 虚拟仪器设计原理虚拟仪器是指利用计算机软件和硬件模拟实际仪器的工作原理和功能,实现数据采集、处理和控制等功能。
基于LabVIEW的虚拟仪器设计主要包括以下几个步骤:界面设计:通过LabVIEW提供的界面设计工具,设计出符合用户需求的操作界面,包括按钮、滑动条、图表等元素。
数据采集:利用LabVIEW提供的数据采集模块,连接传感器或其他设备,实时采集数据并显示在界面上。
数据处理:通过LabVIEW内置的信号处理函数或自定义算法对采集到的数据进行处理,如滤波、傅里叶变换等。
控制算法:根据需求设计控制算法,并通过LabVIEW实现对实际设备的控制,如PID控制、状态机等。
虚拟仪器外文翻译
LabVIEW1.overviewLabVIEW is a program development environment, by the national instruments (NI) research and development company, similar to the C and BASIC development environment, but with other computer language LabVIEW significant difference is: other computer language is based on the text, and the language code of graphical LabVIEW use scripting language G program, application is in the form of block diagram.A complete, LabVIEW virtual instrument system of open application software development, and use it to form instrument testing system and data collecting system can simplify the design procedure. With Visual C++ LabVIEW, Visual Basic,LabWindows/CVI, etc, which adopts different programming language is based on the text language program Code (Code), and abVIEW L is using graphical programming language), Graphic (G instead of the traditional diagram of the Code. The Lab VIEW of equipment with the scientists and engineers icon in the habit of basic agreement, this makes the icon programming process and thinking process is very similar.LabVIEW convenient calls Windows DLL and user-defined function in the DLL, LabVIEW also provides CIN (C) Node with any users can use by C + + language or, if the ANSI C, compiled program modules, makes a open LabVIEW development platform. LabVIEW also directly support dynamic data exchange (DDE), structured query language (SQL), TCP and UDP network protocol. In addition, the LabVIEW also provides special used for program development kit, users can easily set breakpoints, dynamic program execution to very intuitive image observation data transmission process, and convenient debug.The operation mechanism is LabVIEW macroeconomic sense is no longer the von neumann traditionally computer system structure of the method. The traditional computer language (such as C) to the order of execution by parallel structure in LabVIEW mechanism; Essentially, it is a kind of control Flow structure with graphical Data Flow pattern (Data Flow Mode), this kind of means to ensure the process of any Node Function in hire those knowledgeable programmers only after all it can only be executed Data.That is to say, in the data flow in the concept of program execution, and it is the data driven by operating system, calculate machine and so on.Since LabVIEW program is data flow driven, data flow design program, a goal only when it's all input can only be effective, And the goal of output only when it is complete. So, in VIEW of the Lab is connected the data flow between nodes function control program execution sequence, and don't like text program execution sequence by rows of constraint. Thus, we can be connected through the rapid development of concise function node applications, even can have multiple data synchronization operation channel, the so-called Multithreading (Multithreading).2.Data Storage and Reporting with NI LabVIEWThe continued increase in processing and storage capacity and the decrease of hardware and software costs has resulted in an explosion of collected data being acquired. But while technology is enabling faster and richer data retention, storing, managing, and sharing data remains the real challenge. Traditional software packages tend to take one of two limiting approaches: 1) they force you into a particular format that is not exchangeable with other applications or users or 2) saving data is left so open ended you waste time trying to determine the best way to organize and save your data to disk so you can share it.NI LabVIEW, designed for the entire engineering process, includes built-in functionality to help you easily save data to disk and create professional reports. By providing easy yet robust interfaces for file I/O and reporting, you can make the most of your acquired data to make decisions faster.(1)File I/O Designed Specifically for Engineering DataDespite the fact that LabVIEW offers a wide variety of file I/O options, these traditional file types rarely meet all the criteria you need in a file format. For example, ASCII files are exchangeable, but are very large and slow to read and write. On the other hand, binary file read and write speeds can keep up with high-speed hardware, but are difficult to share with others.Because of the drawbacks of traditional file I/O, National Instruments developed the Technical Data Management Streaming (TDMS) file format to meet the specific needs and high demands of engineers and scientists. TDMS files are based on the TDM data model for saving well-organized and documented test and measurement data. The TDM data model offers three levels of hierarchy, as shown in Figure 2 – file, group, and channel. The file level can contain an unlimited number of groups, and each group can contain and unlimited number of channels. Because of this channel grouping, you can organize your data to make it easier to understand. For example,you may have one group for your raw data and another group for your analyzed data within one file, or you may have multiple groups that correspond to sensor types or locations.Figure 1. The TDM data model meets the specific requirements of measurementdata.Also, you can insert your own custom properties at each of the three levels. Each level accepts an unlimited number of custom-defined attributes to achieve well-documented and search-ready data files. The descriptive information located in the TDMS file, a key benefit of this model, provides an easy way to document the data much like you would document code. As your documentation requirements increase, you do not have to redesign your application, you simply extend the data model to meet your needs.(2)Multiple Easy-to-Use Programming InterfacesBecause it was developed to meet the needs of all engineers, TDMS offers ease of use, high-speed streaming, and exchangeability. Like many operations in LabVIEW, you can use multiple interfaces to write TDMS files. Y ou can quickly read and write TDMS files using a virtual instrument (VI) such as the Write To Measurement File Express VI or, for the best performance and customization, use the primitive TDMS VIs from the File I/O palette. Also, when using LabVIEW with NI-DAQmx, you can use the Configure Logging VI from the DAQ palette or log directly from the NI DAQ Assistant(3)Files Exchangeable with Other Programs such as Microsoft ExcelBecause you may be required to work in additional applications, TDMS is easily exchangeable across other programs. Y ou can open TDMS files in Microsoft Excel using the TDM Excel Add-In, which installs with NI software and is available free at. Y ou also can use a C DLL for reading and writing TDMS files in other programming languages. NI is committed to helping you write well-organized and documented data using the TDMS file format, regardless of which products you use.(4)Custom and Legacy File Format Reading and WritingAlthough ideally you can choose the file format for each application you work on, you may still be restricted to reading and writing in a custom format due to legacy files or hardware that uses custom formats. Understanding that many engineers face this challenge, NI developed the DataPlugin technology so that you can use these custom formats in LabVIEW. As seen in Figure 4, a DataPlugin acts as a file parser that tells LabVIEW and other NI software how to read your custom file formats and maps them to the TDM hierarchy model in memory.Figure 2. Using a DataPlugin, you can map any file format onto the TDM datamodel.National Instruments provides more than 200 free, downloadable DataPlugins for the most common file formats. For custom formats, you can create your own DataPlugins in LabVIEW and NI DIAdem software using a documented API, or request that an NI expert create a DataPlugin for you. Using DataPlugins, you are no longer limited by custom formats and applications, and have options for how to use your data.3.Organizing and Managing Y our Data with DataFinder T echnology With many applications, the amount of data being collected can quickly become overwhelming. Typically, at that point, you might turn to a database to begin storing your data for faster search and trending. National Instruments makes it easy to interact with a database using the LabVIEW Database Connectivity Toolkit by abstracting the low-level structured query language (SQL) queries. However, moving your existing data to a database, maintaining the database, and creating applications for accessingdata can become extremely costly and time-consuming.In response to this challenge, NI developed NI DataFinder technology, included in the LabVIEW DataFinder Toolkit and DIAdem, for managing test files without the headache and expense of setting up and maintaining a large database. With NI DataFinder, you can perform Internet-like searches across all your data files, regardless of format and location within your company intranet. Simply point NI DataFinder to the location of your data files, and within seconds you can search for your files just as you would search for information on the Internet.NI DataFinder automatically builds and maintains an index of all files that meet the file type and location criteria in the NI DataFinder configuration. Y ou can use properties automatically stored in the NI DataFinder index in query conditions. When a valid data file is created, deleted, or edited, NI DataFinder automatically notices and reindexes the hierarchy and properties of the file. When you save properties not yet in NI DataFinder in a newly created file, these properties are automatically added to the index. NI DataFinder dynamically manages its own data tables and updates them based on file events and the contents of each file. Therefore, unlike many expensive database solutions, you can change and add information as your needs change without redesigning your data management solution. Using the NI DataFinder, you can quickly find trends and correlations in the large amounts of data you have saved during your tests.4.Multiple Programming Approaches in NI LabVIEWNI LabVIEW is a graphical dataflow programming environment. When using dataflow in LabVIEW, you define an execution flow in code by creating diagrams that show how data moves between functions (known as virtual instruments, or VIs). However, with LabVIEW, you can combine multiple programming approaches besides graphical data flow (G) in a single application. Use this flexibility to select your tool of choice for creating algorithms and solving an infinite variety of engineering problems.(1)Defining Programming ApproachesThe phrase …programming approaches‟ encompasses different languages for programming, models of computation, levels of abstraction, methods for interacting with existing code, and ways for representing algorithms. Over the years, National Instruments has added interfaces and methods for communication in LabVIEW to extend the number of approaches that are available.Y ou can write and import multipleapproaches into the same block diagram as the familiar G dataflow language. LabVIEW compiles all of these approaches for the appropriate hardware target, which can span desktop computers, real-time OSs, field-programmable gate arrays (FPGAs), mobile devices, and embedded processors such as ARM.1(2)Programming in GData flow, the fundamental LabVIEW programming method, was the original, and only, programming approach when NI introduced LabVIEW 1.0 in 1986. Unlike sequential-style programming, the flow of data in a dataflow program dictates when, and in what order, operations are executed. In sequential languages such as C and C++, the order of the commands in the source code (as opposed to the availability of data) determines the order in which execution will occur.G follows a dataflow model for running functions and primitives, or VIs. A block diagram function or node executes when all its inputs are available. When a node completes execution, it supplies data to its output terminals and passes the output data to the next node in the dataflow path.Figure 3. A and B are added, and the result is multiplied by C and displayed.The graphical code in Figure 2 shows how a mathematical equation can be represented in G. This diagram consists of two nodes (an add node and a multiply node), and has three numerical inputs (A, B, and C). First, A and B are added. The multiplication node does not execute until both inputs are provided, so it depends on the addition node to complete and provide the result of A + B, at which point it computes the result – (A+B)*C.Although it is possible to explicitly define variables in G, one of the most obvious differences between G code and other languages is that the functional equivalent of a traditional variable is a wire. Instead of passing variables between functions, wires define the functions to which a value is passed. Other familiar programming concepts such as While Loops, For Loops, conditional code, callback functions, and digital logic are all part of the G dataflow programming language(3)Using Configuration-Based ProgrammingIn 2003, National Instruments released NI LabVIEW 7 Express, which featured Express VIs – a new technology designed to further simplify common programming tasks and algorithm creation. Unlike traditional VIs, Express VIs abstracted tasks by offering a configuration-based approach to programming.LabVIEW distinguishes Express VIs with large blue icons. When you place an Express VI on the block diagram, a dialog appears so you can configure how the function executes. After completing the configuration, the LabVIEW development environment writes the necessary code (represented by the Express VI) for you. Y ou can view and modify this code, and you can change the Express VI configuration by simply double-clicking the Express VI icon.Consider the task of reading real-world signals into software for analysis. LabVIEW is designed to make integration with hardware for I/O simple and easy thanks to native drivers and support for thousands of instruments. However, even a task that would otherwise take a handful of VIs to execute can be simplified to a single Express VI. The DAQ Assistance Express VI prompts you to select the channels you want to send and receive I/O to and from, and configure parameters such as sample rate, terminal configuration, scales, triggering, and synchronization. Y ou also can preview the data within the interface before saving the configuration.Express VIs do not offer the same low-level control as VIs, which is why you may prefer to write the code entirely using VIs. New users interested in learning low-level constructs can easily convert an Express VI to the underlying G code by right-clicking the Express VI and selecting Open Front Panel. Normal VIs can do everything an Express VI can do. The LabVIEW Professional Development System also includes a utility for creating custom Express VIs.(4)Incorporating C-Based SyntaxWe can incorporate sequentially executed text-based syntax into a VI block diagram using one of several techniques. The Formula Node offers an inline structure that supports a syntax similar to traditional C programming. Much like C, every line ends with a semicolon and variables must have a defined scope.The Inline C Node is similar to the Formula Node with additional support and functionality for low-level programming and header files without the overhead of a function call. Y ou can use the Inline C Node for any C code, including assembly directives and #defines, that syntactically is between the curly braces in a C file.The Inline C Node is available only for targets that use generated C code. The Inline C Node is not supported for desktop Windows targets.(5)Interfacing with Built AssembliesInstead of importing source code to a LabVIEW block diagram, you may want to call into built assemblies or reuse built LabVIEW applications in other environments. Applications written in LabVIEW can easily reuse existing code and algorithms developed in other languages or programming approaches. Additionally, you might need to build an assembly from LabVIEW code, which includes the programming approaches discussed above, to be called by a different environment.LabVIEW offers multiple solutions for both scenarios. LabVIEW can call external code in DLLs or shared libraries and code exposed through ActiveX or .NET interfaces. In addition, you can reuse LabVIEW code in other programming languages by building a LabVIEW DLL or shared library, or by using ActiveX.If you have existing C code and need to reuse it in LabVIEW, one technique is to build the code as a DLL and call it using the Call Library Function Node. In fact, based on your C application architecture, you can use simple LabVIEW parallel programming to run two or more existing C routines in parallel without the additional complexity of C-based multithreaded programming. To make importing external libraries simple, LabVIEW includes the Import Shared Library Wizard, which automatically creates or updates a LabVIEW wrapper VI project library for Windows .dll file, Mac OS .framework file, or Linux .so file functions.Interfacing with the command-line is also possible with the System Exec.vi, which provides OS-specific interfaces for calling executables and other build libraries.(6)aking Advantage of Flexible ProgrammingThe combination of multiple programming approaches in a single development environment offers the advantage of reusing existing code and algorithms developed in other languages. It also makes it possible to combine simple, high-level abstractions with lower-level code that gives you more visibility and control of your application. These abstraction layers represent highly complex operations in simple, easy-to-read representations, but can be coupled with functions that give low-level control over application behavior and hardware interfaces. Thanks to tight integration with I/O, you can combine these approaches with real-world signals to take advantage of the most recent hardware technology such as multicore CPUs, FPGAs, andembedded processors.5.The Benefits of Programming Graphically in NI LabVIEW Graphical program design and programming simple, intuitive, and development of high efficiency. With the continuous development of the virtual instrument technology and graphical programming language test and control will become the most promising field development direction.Graphical programming language, which is also known as "G" language. Use this kind of language programming, basically don't write code, instead of chart or diagram. It was possible use technical personnel, scientists, engineers, familiar terminology and concepts, therefore, ICONS, LabVIEW is a tool for end users. It can enhance your own science and engineering construction, provides realizing instrument programming and convenient way of data acquisition system. Use it to research, design, testing principle and realization instrument system, can greatly improve the work efficiency.(1)abVIEW: Graphical, Dataflow ProgrammingLabVIEW is different from most other general-purpose programming languages in two major ways. First, G programming is performed by wiring together graphical icons on a diagram, which is then compiled directly to machine code so the computer processors can execute it. While represented graphically instead of with text, G contains the same programming concepts found in most traditional languages. For example, G includes all the standard constructs, such as data types, loops, event handling, variables, recursion, and object-oriented programming.The second main differentiator is that G code developed with LabVIEW executes according to the rules of data flow instead of the more traditional procedural approach (in other words, a sequential series of commands to be carried out) found in most text-based programming languages like C and C++. Dataflow languages like G (as well as Agilent VEE, Microsoft Visual Programming Language, and Apple Quartz Composer) promote data as the main concept behind any program. Dataflow execution is data-driven, or data-dependent. The flow of data between nodes in the program, not sequential lines of text, determines the execution order.This distinction may seem minor at first, but the impact is extraordinary because it renders the data paths between parts of the program to be the developer‟s main focus. Nodes in a LabVIEW program (in other words, functions, structures such as loops, subroutines, and so on) have inputs, process data, and produce outputs. Onceall of a given node‟s inputs contain valid data, that node executes its logic, produc es output data, and passes that data to the next node in the dataflow path. A node that receives data from another node can execute only after the other node completes execution.(2)ntuitive Graphical ProgrammingLike most people, engineers and scientists learn by seeing and processing images without any need for conscious contemplation. Many engineers and scientists can also be characterized as “visual thinkers,” meaning that they are especially adept at using visual processing to organize information. In other words, they think best in pictures. This is often reinforced in colleges and universities, where students are encouraged to model solutions to problems as process diagrams. However, most general-purpose programming languages require you to spend significant time learning the specific text-based syntax associated with that language and then map the structure of the language to the problem being solved. Graphical programming with G provides a more intuitive experience.Figure 4. Data originates in the acquisition function and then flows intuitively to the analysis and storage functions through wires.(3)utomatic Parallelism and PerformanceDataflow languages like LabVIEW allow for automatic parallelization. In contrast to sequential languages like C and C++, graphical programs inherently contain information about which parts of the code should execute in parallel. For example, a common G design pattern is the Producer/Consumer Design Pattern, in which two separate While Loops execute independently: the first loop is responsible for producing data and the second loop processes data. Despite executing in parallel (possibly at different rates), data is passed between the two loops using queues, which are standard data structures in general-purpose programming languages.Parallelism is important in computer programs because it can unlockperformance gains relative to purely sequential programs due to recent changes in computer processor designs. For more than 40 years, computer chip manufacturers increased processor clock speed to increase chip performance. Today, however, increasing clock speeds for performance gains is no longer viable because of power consumption and heat dissipation constraints. As a result, chip vendors have instead moved to new chip architectures with multiple processor cores on a single chip.To take advantage of the performance available in multicore processors, you must be able to use multithreading within your applications (in other words, break up applications into discrete sections that can be executed independently). If you use traditional text-based languages, you must explicitly create and manage threads to implement parallelism, a major challenge for nonexpert programmers.In contrast, the parallel nature of G code makes multitasking and multithreading simple to implement. The built-in compiler continually works in the background to identify parallel sections of code. Whenever G code has a branch in a wire, or a parallel sequence of nodes on the diagram, the compiler tries to execute the code in parallel within a set of threads that LabVIEW manages automatically. In computer science terms, this is called “implicit parallelism” because you do not have to specifically write code with the purpose of running it in parallel; the G language takes care of parallelism on its own.Beyond multithreading on a multicore system, G can provide even greater parallel execution by extending graphical programming to field-programmable gate arrays (FPGAs). FPGAs are reprogrammable silicon chips that are massively parallel – with each independent processing task assigned to a dedicated section of the chip –but they are not limited by the number of processing cores available. As a result, the performance of one part of the application is not adversely affected when more processing is added.6.Hardware Integration with NI LabVIEW(1)ave Development Time with Simpler System IntegrationMost measurement and control hardware comes with software. Usually, that software only works with the device or devices similar to the one the software came with, and the software likely has a fixed, limited feature set. When you want to do more than you can with the included software, such as incorporate multiple devices or add processing and reporting, you face the often daunting task of getting the hardware to work in a different software environment.System integration, getting everything setup and configured such that you begin programming a system, can be a major undertaking, often taking more time than the programming, measurement, or test you wish to perform. Integrating different hardware devices with traditional tools is littered with time-wasting steps and possible incompatibilities, increasing risk. First, you have to find the correct drivers for all of your hardware, and then you have to figure out how to install them and call them from software. Once your drivers are usable, you need them to communicate with the hardware and learn the programming model that the driver designer decided was appropriate for that particular device. LabVIEW can help save you time and frustration by eliminating some of these steps and making others markedly easier.LabVIEW is one software tool that can span all of your hardware components. Drivers are readily available for common hardware devices. Each hardware driver shares a similar, familiar programming model, and examples of how to use the model install directly into LabVIEW.(2)onnect to Any HardwareWith LabVIEW, you can use all of your hardware with a single development environment. Connectivity is made possible with driver software, which serves as the communication layer between LabVIEW and your hardware. LabVIEW driver software supplies seamless integration across multiple types of instruments, buses, and sensors, including data acquisition devices; boxed instruments; modular instruments; motion controllers and motor drives; machine vision and image processing hardware; wireless sensors; and field-programmable gate arrays (FPGAs). In the rare event that a LabVIEW driver doesn‟t already exist, you also can import drivers from other programming languages or use low-level communication to implement your own driver.(3)I HardwareWith more than 50 million I/O channels sold in the last 10 years, National Instruments is a global market leader in PC-based data acquisition, with a complete family of data acquisition products for desktop, portable, industrial, and embedded applications. Y ou can use NI-DAQmx driver software to integrate more than 200 data acquisition devices in LabVIEW on a variety of major buses and form factors, including USB, PCI, PCI Express, PXI, PXI Express, wireless, and Ethernet.(4)Third-Party HardwareLabVIEW does more than just connect to NI hardware. LabVIEW also connectsto thousands of third-party instruments through instrument drivers. The Instrument Driver Network (IDNet) offers more than 8,000 free drivers for instruments from more than 275 third-party vendors that make your hardware work with LabVIEW.From:。
- 1、下载文档前请自行甄别文档内容的完整性,平台不提供额外的编辑、内容补充、找答案等附加服务。
- 2、"仅部分预览"的文档,不可在线预览部分如存在完整性等问题,可反馈申请退款(可完整预览的文档不适用该条件!)。
- 3、如文档侵犯您的权益,请联系客服反馈,我们会尽快为您处理(人工客服工作时间:9:00-18:30)。
LabVIEW-based system components for militarysubmarines compact test system"We used LabVIEW, NI TestStand, and PXI to build a prototype to demonstrate that the new system can not only use modern test equipment and methods, but without sacrificing functionality under the premise of the current test system cost is only a small part."Vickie Hoffmann, Orbis Inc.LabVIEW graphics of signal processing platform by syllabary signal processing, and analysis and mathematics operations function composition of signal processing and mathematics function library composition, contains Wavelet transform, and time-frequency analysis, and image processing, and filter design, and sound and vibration, and system identification, and RF analysis, professional method of tool package, while compatible. m file, mathematics script language and function interface, may and NI hardware of seamless combination, makes algorithm get fast validation and deployment. LabVIEW signal processing platform has been successfully used in electronics, telecommunications, electrical and mechanical, chemical, medical, aerospace, physics and other fields of teaching and research work.ChallengeBased VERSAmodule European standard bus (VME bus) test equipment is often used submarine system, verify whether the module is in its sub-components can be ready to use (ready for issue, RFI) state requires the use of large, complex, and laboratory environments testing equipment, and requires all the sub-components of the module in a unified center for testing.SolutionUse compact the NI PXI modular instruments, LabVIEW software and NI TestStand to develop and VME bus test equipment test function with the same military test systems, while significantly reducing the size, reduce complexity andcosts, so that the Navy can be deployed in the test system strategic location, and reduce overall maintenance costs and submarine fleet logistics costs.Orbis Inc. (Orbis) is a company with 130 employees of small businesses, is headquartered in the state of South Carolina in Charleston. Its core business is the U.S. Department of Defense (DoD) to provide engineering and project management services. Orbis is also committed to conduct cutting-edge research and development projects, focusing on developing innovative automated test systems (ATS).To meet military needsCritical operational systems and support suite many systems based on VME technology. These systems maintenance and troubleshooting involves sub-assemblies between the module and the RFI spare parts are interchangeable. System troubleshooting procedures use any of the modules must be re-tested and verified before they can return to RFI status and kept as a spare. As the traditional system, all tests were carried out in a central position, the total cost of ownership will increase. In addition to the cost of transport module, another major cost from the parts to maintain sufficient inventory to replace being tested and the components during transport.Based on the automated testing and functional testing for the U.S. Department of Defense to write code for the experience, the Navy found Orbis to help them develop a compact, flexible and can meet or exceed the existing test systems functional prototype test system. We have successfully built a prototype to demonstrate the new system can not only use modern testing equipment and methods, and in the premise without sacrificing functionality test systems currently cost only a small part.From the NI PXI modular instruments to find solutionsBy using the stand-alone instruments and modular instruments for comparing various solutions, we decided to use PXI modular instrumentation platform, because we need a compact and flexible test system. Next, we analyzed the suppliers, chose NI PXI devices as the sole supplier because the company is the leader in PXI, NI offers a wide range of PXI modules to meet the needs of our test systems and technical requirements, the The company also provides a "plug and play" environment. PXI platform for our development provides a good start, because NI Modules and LabVIEW to ensure that all devices can communicate without having to create custom device drivers.We use two NI PXI-2531 module to create an 8 × 128 crosspoint switch matrixto the PXI measurement module connected to all points on the mass interconnect interface test adapters (ITA). With this switch matrix, we have to connect to the ITA DUT (UUT) to achieve full functional test configurations all the required connections. Additionally, we will VME interface is integrated into the test system and connect it to the ITA, which provides for each UUT comprehensive VME bus test. Integrated NI PXI and LabVIEW, NI TestStandWe primarily written in LabVIEW and NI TestStand test systems test assembly. By eliminating the need to write custom drivers, NI software greatly simplifies the hardware and software systems integration. After starting the program, LabVIEW will call each PXI modules for self-test operation, check the calibration date is valid, and then the functional tests. Each test written in LabVIEW, NI TestStand to call in the execution. The end of the test execution, the test will be based on the collected data and generate a readable report can be exported in XML format.NI Technology ListOur application through the NI PXI-8108 embedded controller to achieve the management tasks through the NI PXI-6653 and NI PXI-6651 module to control the timing and synchronization. For the connection, cycle computing and communications, we use NI PXI-7813R to achieve data integration, NI PXI-7853R module process connection and signal processing as well as NI PXI-7854R module for signal processing.In order to develop the current stabilization system, we use NI LabVIEW 2010 software, LabVIEW FPGA Module and the LabVIEW Real-Time Module. Development process largely depends on training and NI LabVIEW volume license agreement.Changing views on Compact ATSOrbis will PXI-based test system with a custom ITA and VME interfaces combine design and build a prototype called Compact Tester test system. Compact Tester with 12 cubic feet of 18-slot PXI chassis test system replaces the 84 cubic feet of test systems. Compared with the previous test systems, cost reduction of 3 times, 15 times smaller footprint, weight 25 times, this difference is very significant. In addition, the use of industry-standard PXI hardware and LabVIEW software, we were also able to reduce the daily operation and maintenance costs.In addition to achieving all the goals set for the Compact Tester, the PXI-basedsystem also has other advantages. Interconnection due to the size and mass reduction, thereby completing the number of cables required for each test is significantly reduced. Which in turn allows us to reduce the cable can acquire more real signals, greatly improving the accuracy of each measurement.With LabVIEW, NI TestStand and NI PXI modular instruments, Orbis Compact Tester quickly developed a prototype to demonstrate the Navy. Navy test new functionality provided by the system, the potential cost savings, as well as reducing signal noise RFI spares returned to the Treasury to reduce the time and other advantages cooing.Multithreaded programming challengeTo date, the processor technology in the field of innovation has made your computer is working at higher clock speed of the central processing unit (CPU). However, as the clock rate approaching its theoretical physical limits with multiple (rather than individual) among the new processors are in the research and development of nuclear. Take advantage of these new multicore processor for automated test applications using parallel programming techniques, you can achieve the best performance and highest throughput. Dr Edward Lee-the University of California, Berkeley, distinguished professor of electrical and computer engineering department--describe parallel processing technology."Many technology experts predicted that response will be the end of Moore's increasingly parallel computer architectures. If we want to continue to improve performance, computer programs must be able to take advantage of the parallelism. ”Also, take advantage of multi-core processor application programming is a huge programming challenges, and this is widely accepted. --Microsoft founder Bill Gates--about this challenge has this passage:"To fully harness the power of parallel processors, ... Software must be able to deal with concurrency issues. But, as any writing multi-threaded code developer tell you that, this is one of the most daunting tasks in the field of programming. ”Was lucky, LabVIEW for multicore processors provide an ideal programming environment, because it provides a visual environment for creating parallel algorithm, and it can be dynamically assigning multiple threads to a given application. In fact, the use of automated test applications for multi-core processors, can easily be optimized to obtain the best performance. Moreover, PXIe modular instrument to enhance this technical advantage, because the PCIe bus high data transfer ratespossible. From multicore processors and PXIe devices two specific applications are: multichannel signal analysis and online processing (hardware in the loop). In the subsequent sections of this article, we will examine the various parallel programming techniques, characterization and performance advantages associated with each technology.基于LabVIEW用于军用潜艇系统组件的紧凑型测试系统“我们采用LabVIEW、NI TestStand和PXI来构建原型,以证明新系统不仅可以利用现代化测试设备和方法,而且在无需牺牲功能的前提下成本仅为当前测试系统的一小部分。