A Chaotic Direct-Sequence Spread-Spectrum System for Underwater Communication
Tektronix MDO3000 Series 数字多功能作业仪用户指南说明书
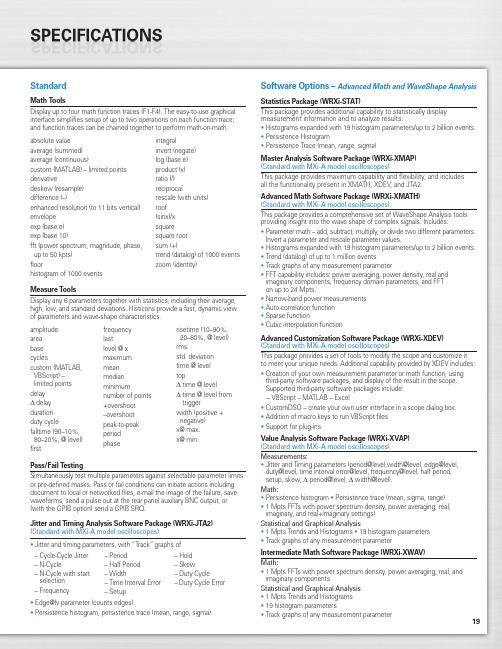
19StandardMath ToolsDisplay up to four math function traces (F1-F4). The easy-to-use graphical interface simplifies setup of up to two operations on each function trace;and function traces can be chained together to perform math-on-math.absolute value integralaverage (summed)invert (negate)average (continuous)log (base e)custom (MATLAB) – limited points product (x)derivativeratio (/)deskew (resample)reciprocaldifference (–)rescale (with units)enhanced resolution (to 11 bits vertical)roof envelope (sinx)/x exp (base e)square exp (base 10)square root fft (power spectrum, magnitude, phase,sum (+)up to 50 kpts) trend (datalog) of 1000 events floorzoom (identity)histogram of 1000 eventsMeasure ToolsDisplay any 6 parameters together with statistics, including their average,high, low, and standard deviations. Histicons provide a fast, dynamic view of parameters and wave-shape characteristics.Pass/Fail TestingSimultaneously test multiple parameters against selectable parameter limits or pre-defined masks. Pass or fail conditions can initiate actions including document to local or networked files, e-mail the image of the failure, save waveforms, send a pulse out at the rear panel auxiliary BNC output, or (with the GPIB option) send a GPIB SRQ.Jitter and Timing Analysis Software Package (WRXi-JTA2)(Standard with MXi-A model oscilloscopes)•Jitter and timing parameters, with “Track”graphs of •Edge@lv parameter (counts edges)• Persistence histogram, persistence trace (mean, range, sigma)Software Options –Advanced Math and WaveShape AnalysisStatistics Package (WRXi-STAT)This package provides additional capability to statistically display measurement information and to analyze results:• Histograms expanded with 19 histogram parameters/up to 2 billion events.• Persistence Histogram• Persistence Trace (mean, range, sigma)Master Analysis Software Package (WRXi-XMAP)(Standard with MXi-A model oscilloscopes)This package provides maximum capability and flexibility, and includes all the functionality present in XMATH, XDEV, and JTA2.Advanced Math Software Package (WRXi-XMATH)(Standard with MXi-A model oscilloscopes)This package provides a comprehensive set of WaveShape Analysis tools providing insight into the wave shape of complex signals. Includes:•Parameter math – add, subtract, multiply, or divide two different parameters.Invert a parameter and rescale parameter values.•Histograms expanded with 19 histogram parameters/up to 2 billion events.•Trend (datalog) of up to 1 million events•Track graphs of any measurement parameter•FFT capability includes: power averaging, power density, real and imaginary components, frequency domain parameters, and FFT on up to 24 Mpts.•Narrow-band power measurements •Auto-correlation function •Sparse function• Cubic interpolation functionAdvanced Customization Software Package (WRXi-XDEV)(Standard with MXi-A model oscilloscopes)This package provides a set of tools to modify the scope and customize it to meet your unique needs. Additional capability provided by XDEV includes:•Creation of your own measurement parameter or math function, using third-party software packages, and display of the result in the scope. Supported third-party software packages include:– VBScript – MATLAB – Excel•CustomDSO – create your own user interface in a scope dialog box.• Addition of macro keys to run VBScript files •Support for plug-insValue Analysis Software Package (WRXi-XVAP)(Standard with MXi-A model oscilloscopes)Measurements:•Jitter and Timing parameters (period@level,width@level, edge@level,duty@level, time interval error@level, frequency@level, half period, setup, skew, Δ period@level, Δ width@level).Math:•Persistence histogram •Persistence trace (mean, sigma, range)•1 Mpts FFTs with power spectrum density, power averaging, real, imaginary, and real+imaginary settings)Statistical and Graphical Analysis•1 Mpts Trends and Histograms •19 histogram parameters •Track graphs of any measurement parameterIntermediate Math Software Package (WRXi-XWAV)Math:•1 Mpts FFTs with power spectrum density, power averaging, real, and imaginary componentsStatistical and Graphical Analysis •1 Mpts Trends and Histograms •19 histogram parameters•Track graphs of any measurement parameteramplitude area base cyclescustom (MATLAB,VBScript) –limited points delay Δdelay duration duty cyclefalltime (90–10%, 80–20%, @ level)firstfrequency lastlevel @ x maximum mean median minimumnumber of points +overshoot –overshoot peak-to-peak period phaserisetime (10–90%, 20–80%, @ level)rmsstd. deviation time @ level topΔ time @ levelΔ time @ level from triggerwidth (positive + negative)x@ max.x@ min.– Cycle-Cycle Jitter – N-Cycle– N-Cycle with start selection – Frequency– Period – Half Period – Width– Time Interval Error – Setup– Hold – Skew– Duty Cycle– Duty Cycle Error20WaveRunner WaveRunner WaveRunner WaveRunner WaveRunner 44Xi-A64Xi-A62Xi-A104Xi-A204Xi-AVertical System44MXi-A64MXi-A104MXi-A204MXi-ANominal Analog Bandwidth 400 MHz600 MHz600 MHz 1 GHz 2 GHz@ 50 Ω, 10 mV–1 V/divRise Time (Typical)875 ps500 ps500 ps300 ps180 psInput Channels44244Bandwidth Limiters20 MHz; 200 MHzInput Impedance 1 MΩ||16 pF or 50 Ω 1 MΩ||20 pF or 50 ΩInput Coupling50 Ω: DC, 1 MΩ: AC, DC, GNDMaximum Input Voltage50 Ω: 5 V rms, 1 MΩ: 400 V max.50 Ω: 5 V rms, 1 MΩ: 250 V max.(DC + Peak AC ≤ 5 kHz)(DC + Peak AC ≤ 10 kHz)Vertical Resolution8 bits; up to 11 with enhanced resolution (ERES)Sensitivity50 Ω: 2 mV/div–1 V/div fully variable; 1 MΩ: 2 mV–10 V/div fully variableDC Gain Accuracy±1.0% of full scale (typical); ±1.5% of full scale, ≥ 10 mV/div (warranted)Offset Range50 Ω: ±1 V @ 2–98 mV/div, ±10 V @ 100 mV/div–1 V/div; 50Ω:±400mV@2–4.95mV/div,±1V@5–99mv/div,1 M Ω: ±1 V @ 2–98 mV/div, ±10 V @ 100 mV/div–1 V/div,±10 V @ 100 mV–1 V/div±**********/div–10V/div 1 M Ω: ±400 mV @ 2–4.95 mV/div, ±1 V @5–99 mV/div, ±10 V @ 100 mV–1 V/div,±*********–10V/divInput Connector ProBus/BNCTimebase SystemTimebases Internal timebase common to all input channels; an external clock may be applied at the auxiliary inputTime/Division Range Real time: 200 ps/div–10 s/div, RIS mode: 200 ps/div to 10 ns/div, Roll mode: up to 1,000 s/divClock Accuracy≤ 5 ppm @ 25 °C (typical) (≤ 10 ppm @ 5–40 °C)Sample Rate and Delay Time Accuracy Equal to Clock AccuracyChannel to Channel Deskew Range±9 x time/div setting, 100 ms max., each channelExternal Sample Clock DC to 600 MHz; (DC to 1 GHz for 104Xi-A/104MXi-A and 204Xi-A/204MXi-A) 50 Ω, (limited BW in 1 MΩ),BNC input, limited to 2 Ch operation (1 Ch in 62Xi-A), (minimum rise time and amplitude requirements applyat low frequencies)Roll Mode User selectable at ≥ 500 ms/div and ≤100 kS/s44Xi-A64Xi-A62Xi-A104Xi-A204Xi-A Acquisition System44MXi-A64MXi-A104MXi-A204MXi-ASingle-Shot Sample Rate/Ch 5 GS/sInterleaved Sample Rate (2 Ch) 5 GS/s10 GS/s10 GS/s10 GS/s10 GS/sRandom Interleaved Sampling (RIS)200 GS/sRIS Mode User selectable from 200 ps/div to 10 ns/div User selectable from 100 ps/div to 10 ns/div Trigger Rate (Maximum) 1,250,000 waveforms/secondSequence Time Stamp Resolution 1 nsMinimum Time Between 800 nsSequential SegmentsAcquisition Memory Options Max. Acquisition Points (4 Ch/2 Ch, 2 Ch/1 Ch in 62Xi-A)Segments (Sequence Mode)Standard12.5M/25M10,00044Xi-A64Xi-A62Xi-A104Xi-A204Xi-A Acquisition Processing44MXi-A64MXi-A104MXi-A204MXi-ATime Resolution (min, Single-shot)200 ps (5 GS/s)100 ps (10 GS/s)100 ps (10 GS/s)100 ps (10 GS/s)100 ps (10 GS/s) Averaging Summed and continuous averaging to 1 million sweepsERES From 8.5 to 11 bits vertical resolutionEnvelope (Extrema)Envelope, floor, or roof for up to 1 million sweepsInterpolation Linear or (Sinx)/xTrigger SystemTrigger Modes Normal, Auto, Single, StopSources Any input channel, External, Ext/10, or Line; slope and level unique to each source, except LineTrigger Coupling DC, AC (typically 7.5 Hz), HF Reject, LF RejectPre-trigger Delay 0–100% of memory size (adjustable in 1% increments, or 100 ns)Post-trigger Delay Up to 10,000 divisions in real time mode, limited at slower time/div settings in roll modeHold-off 1 ns to 20 s or 1 to 1,000,000,000 events21WaveRunner WaveRunner WaveRunner WaveRunner WaveRunner 44Xi-A 64Xi-A 62Xi-A104Xi-A 204Xi-A Trigger System (cont’d)44MXi-A64MXi-A104MXi-A204MXi-AInternal Trigger Level Range ±4.1 div from center (typical)Trigger and Interpolator Jitter≤ 3 ps rms (typical)Trigger Sensitivity with Edge Trigger 2 div @ < 400 MHz 2 div @ < 600 MHz 2 div @ < 600 MHz 2 div @ < 1 GHz 2 div @ < 2 GHz (Ch 1–4 + external, DC, AC, and 1 div @ < 200 MHz 1 div @ < 200 MHz 1 div @ < 200 MHz 1 div @ < 200 MHz 1 div @ < 200 MHz LFrej coupling)Max. Trigger Frequency with400 MHz 600 MHz 600 MHz 1 GHz2 GHzSMART Trigger™ (Ch 1–4 + external)@ ≥ 10 mV@ ≥ 10 mV@ ≥ 10 mV@ ≥ 10 mV@ ≥ 10 mVExternal Trigger RangeEXT/10 ±4 V; EXT ±400 mVBasic TriggersEdgeTriggers when signal meets slope (positive, negative, either, or Window) and level conditionTV-Composite VideoT riggers NTSC or PAL with selectable line and field; HDTV (720p, 1080i, 1080p) with selectable frame rate (50 or 60 Hz)and Line; or CUSTOM with selectable Fields (1–8), Lines (up to 2000), Frame Rates (25, 30, 50, or 60 Hz), Interlacing (1:1, 2:1, 4:1, 8:1), or Synch Pulse Slope (Positive or Negative)SMART TriggersState or Edge Qualified Triggers on any input source only if a defined state or edge occurred on another input source.Delay between sources is selectable by time or eventsQualified First In Sequence acquisition mode, triggers repeatedly on event B only if a defined pattern, state, or edge (event A) is satisfied in the first segment of the acquisition. Delay between sources is selectable by time or events Dropout Triggers if signal drops out for longer than selected time between 1 ns and 20 s.PatternLogic combination (AND, NAND, OR, NOR) of 5 inputs (4 channels and external trigger input – 2 Ch+EXT on WaveRunner 62Xi-A). Each source can be high, low, or don’t care. The High and Low level can be selected independently. Triggers at start or end of the patternSMART Triggers with Exclusion TechnologyGlitch and Pulse Width Triggers on positive or negative glitches with widths selectable from 500 ps to 20 s or on intermittent faults (subject to bandwidth limit of oscilloscope)Signal or Pattern IntervalTriggers on intervals selectable between 1 ns and 20 sTimeout (State/Edge Qualified)Triggers on any source if a given state (or transition edge) has occurred on another source.Delay between sources is 1 ns to 20 s, or 1 to 99,999,999 eventsRuntTrigger on positive or negative runts defined by two voltage limits and two time limits. Select between 1 ns and 20 sSlew RateTrigger on edge rates. Select limits for dV, dt, and slope. Select edge limits between 1 ns and 20 s Exclusion TriggeringTrigger on intermittent faults by specifying the normal width or periodLeCroy WaveStream Fast Viewing ModeIntensity256 Intensity Levels, 1–100% adjustable via front panel control Number of Channels up to 4 simultaneouslyMax Sampling Rate5 GS/s (10 GS/s for WR 62Xi-A, 64Xi-A/64MXi-A,104Xi-A/104MXi-A, 204Xi-A/204MXi-A in interleaved mode)Waveforms/second (continuous)Up to 20,000 waveforms/secondOperationFront panel toggle between normal real-time mode and LeCroy WaveStream Fast Viewing modeAutomatic SetupAuto SetupAutomatically sets timebase, trigger, and sensitivity to display a wide range of repetitive signalsVertical Find ScaleAutomatically sets the vertical sensitivity and offset for the selected channels to display a waveform with maximum dynamic range44Xi-A 64Xi-A 62Xi-A104Xi-A 204Xi-A Probes44MXi-A 64MXi-A104MXi-A 204MXi-AProbesOne Passive probe per channel; Optional passive and active probes available Probe System; ProBus Automatically detects and supports a variety of compatible probes Scale FactorsAutomatically or manually selected, depending on probe usedColor Waveform DisplayTypeColor 10.4" flat-panel TFT-LCD with high resolution touch screenResolutionSVGA; 800 x 600 pixels; maximum external monitor output resolution of 2048 x 1536 pixelsNumber of Traces Display a maximum of 8 traces. Simultaneously display channel, zoom, memory, and math traces Grid StylesAuto, Single, Dual, Quad, Octal, XY , Single + XY , Dual + XY Waveform StylesSample dots joined or dots only in real-time mode22Zoom Expansion TracesDisplay up to 4 Zoom/Math traces with 16 bits/data pointInternal Waveform MemoryM1, M2, M3, M4 Internal Waveform Memory (store full-length waveform with 16 bits/data point) or store to any number of files limited only by data storage mediaSetup StorageFront Panel and Instrument StatusStore to the internal hard drive, over the network, or to a USB-connected peripheral deviceInterfaceRemote ControlVia Windows Automation, or via LeCroy Remote Command Set Network Communication Standard VXI-11 or VICP , LXI Class C Compliant GPIB Port (Accessory)Supports IEEE – 488.2Ethernet Port 10/100/1000Base-T Ethernet interface (RJ-45 connector)USB Ports5 USB 2.0 ports (one on front of instrument) supports Windows-compatible devices External Monitor Port Standard 15-pin D-Type SVGA-compatible DB-15; connect a second monitor to use extended desktop display mode with XGA resolution Serial PortDB-9 RS-232 port (not for remote oscilloscope control)44Xi-A 64Xi-A 62Xi-A104Xi-A 204Xi-A Auxiliary Input44MXi-A 64MXi-A104MXi-A 204MXi-ASignal Types Selected from External Trigger or External Clock input on front panel Coupling50 Ω: DC, 1 M Ω: AC, DC, GND Maximum Input Voltage50 Ω: 5 V rms , 1 M Ω: 400 V max.50 Ω: 5 V rms , 1 M Ω: 250 V max. (DC + Peak AC ≤ 5 kHz)(DC + Peak AC ≤ 10 kHz)Auxiliary OutputSignal TypeTrigger Enabled, Trigger Output. Pass/Fail, or Off Output Level TTL, ≈3.3 VConnector TypeBNC, located on rear panelGeneralAuto Calibration Ensures specified DC and timing accuracy is maintained for 1 year minimumCalibratorOutput available on front panel connector provides a variety of signals for probe calibration and compensationPower Requirements90–264 V rms at 50/60 Hz; 115 V rms (±10%) at 400 Hz, Automatic AC Voltage SelectionInstallation Category: 300 V CAT II; Max. Power Consumption: 340 VA/340 W; 290 VA/290 W for WaveRunner 62Xi-AEnvironmentalTemperature: Operating+5 °C to +40 °C Temperature: Non-Operating -20 °C to +60 °CHumidity: Operating Maximum relative humidity 80% for temperatures up to 31 °C decreasing linearly to 50% relative humidity at 40 °CHumidity: Non-Operating 5% to 95% RH (non-condensing) as tested per MIL-PRF-28800F Altitude: OperatingUp to 3,048 m (10,000 ft.) @ ≤ 25 °C Altitude: Non-OperatingUp to 12,190 m (40,000 ft.)PhysicalDimensions (HWD)260 mm x 340 mm x 152 mm Excluding accessories and projections (10.25" x 13.4" x 6")Net Weight7.26kg. (16.0lbs.)CertificationsCE Compliant, UL and cUL listed; Conforms to EN 61326, EN 61010-1, UL 61010-1 2nd Edition, and CSA C22.2 No. 61010-1-04Warranty and Service3-year warranty; calibration recommended annually. Optional service programs include extended warranty, upgrades, calibration, and customization services23Product DescriptionProduct CodeWaveRunner Xi-A Series Oscilloscopes2 GHz, 4 Ch, 5 GS/s, 12.5 Mpts/ChWaveRunner 204Xi-A(10 GS/s, 25 Mpts/Ch in interleaved mode)with 10.4" Color Touch Screen Display 1 GHz, 4 Ch, 5 GS/s, 12.5 Mpts/ChWaveRunner 104Xi-A(10 GS/s, 25 Mpts/Ch in interleaved mode)with 10.4" Color Touch Screen Display 600 MHz, 4 Ch, 5 GS/s, 12.5 Mpts/Ch WaveRunner 64Xi-A(10 GS/s, 25 Mpts/Ch in interleaved mode)with 10.4" Color Touch Screen Display 600 MHz, 2 Ch, 5 GS/s, 12.5 Mpts/Ch WaveRunner 62Xi-A(10 GS/s, 25 Mpts/Ch in interleaved mode)with 10.4" Color Touch Screen Display 400 MHz, 4 Ch, 5 GS/s, 12.5 Mpts/Ch WaveRunner 44Xi-A(25 Mpts/Ch in interleaved mode)with 10.4" Color Touch Screen DisplayWaveRunner MXi-A Series Oscilloscopes2 GHz, 4 Ch, 5 GS/s, 12.5 Mpts/ChWaveRunner 204MXi-A(10 GS/s, 25 Mpts/Ch in Interleaved Mode)with 10.4" Color Touch Screen Display 1 GHz, 4 Ch, 5 GS/s, 12.5 Mpts/ChWaveRunner 104MXi-A(10 GS/s, 25 Mpts/Ch in Interleaved Mode)with 10.4" Color Touch Screen Display 600 MHz, 4 Ch, 5 GS/s, 12.5 Mpts/Ch WaveRunner 64MXi-A(10 GS/s, 25 Mpts/Ch in Interleaved Mode)with 10.4" Color Touch Screen Display 400 MHz, 4 Ch, 5 GS/s, 12.5 Mpts/Ch WaveRunner 44MXi-A(25 Mpts/Ch in Interleaved Mode)with 10.4" Color Touch Screen DisplayIncluded with Standard Configuration÷10, 500 MHz, 10 M Ω Passive Probe (Total of 1 Per Channel)Standard Ports; 10/100/1000Base-T Ethernet, USB 2.0 (5), SVGA Video out, Audio in/out, RS-232Optical 3-button Wheel Mouse – USB 2.0Protective Front Cover Accessory PouchGetting Started Manual Quick Reference GuideAnti-virus Software (Trial Version)Commercial NIST Traceable Calibration with Certificate 3-year WarrantyGeneral Purpose Software OptionsStatistics Software Package WRXi-STAT Master Analysis Software Package WRXi-XMAP (Standard with MXi-A model oscilloscopes)Advanced Math Software Package WRXi-XMATH (Standard with MXi-A model oscilloscopes)Intermediate Math Software Package WRXi-XWAV (Standard with MXi-A model oscilloscopes)Value Analysis Software Package (Includes XWAV and JTA2) WRXi-XVAP (Standard with MXi-A model oscilloscopes)Advanced Customization Software Package WRXi-XDEV (Standard with MXi-A model oscilloscopes)Spectrum Analyzer and Advanced FFT Option WRXi-SPECTRUM Processing Web Editor Software Package WRXi-XWEBProduct Description Product CodeApplication Specific Software OptionsJitter and Timing Analysis Software Package WRXi-JTA2(Standard with MXi-A model oscilloscopes)Digital Filter Software PackageWRXi-DFP2Disk Drive Measurement Software Package WRXi-DDM2PowerMeasure Analysis Software Package WRXi-PMA2Serial Data Mask Software PackageWRXi-SDM QualiPHY Enabled Ethernet Software Option QPHY-ENET*QualiPHY Enabled USB 2.0 Software Option QPHY-USB †EMC Pulse Parameter Software Package WRXi-EMC Electrical Telecom Mask Test PackageET-PMT* TF-ENET-B required. †TF-USB-B required.Serial Data OptionsI 2C Trigger and Decode Option WRXi-I2Cbus TD SPI Trigger and Decode Option WRXi-SPIbus TD UART and RS-232 Trigger and Decode Option WRXi-UART-RS232bus TD LIN Trigger and Decode Option WRXi-LINbus TD CANbus TD Trigger and Decode Option CANbus TD CANbus TDM Trigger, Decode, and Measure/Graph Option CANbus TDM FlexRay Trigger and Decode Option WRXi-FlexRaybus TD FlexRay Trigger and Decode Physical Layer WRXi-FlexRaybus TDP Test OptionAudiobus Trigger and Decode Option WRXi-Audiobus TDfor I 2S , LJ, RJ, and TDMAudiobus Trigger, Decode, and Graph Option WRXi-Audiobus TDGfor I 2S LJ, RJ, and TDMMIL-STD-1553 Trigger and Decode Option WRXi-1553 TDA variety of Vehicle Bus Analyzers based on the WaveRunner Xi-A platform are available.These units are equipped with a Symbolic CAN trigger and decode.Mixed Signal Oscilloscope Options500 MHz, 18 Ch, 2 GS/s, 50 Mpts/Ch MS-500Mixed Signal Oscilloscope Option 250 MHz, 36 Ch, 1 GS/s, 25 Mpts/ChMS-500-36(500 MHz, 18 Ch, 2 GS/s, 50 Mpts/Ch Interleaved) Mixed Signal Oscilloscope Option 250 MHz, 18 Ch, 1 GS/s, 10 Mpts/Ch MS-250Mixed Signal Oscilloscope OptionProbes and Amplifiers*Set of 4 ZS1500, 1.5 GHz, 0.9 pF , 1 M ΩZS1500-QUADPAK High Impedance Active ProbeSet of 4 ZS1000, 1 GHz, 0.9 pF , 1 M ΩZS1000-QUADPAK High Impedance Active Probe 2.5 GHz, 0.7 pF Active Probe HFP25001 GHz Active Differential Probe (÷1, ÷10, ÷20)AP034500 MHz Active Differential Probe (x10, ÷1, ÷10, ÷100)AP03330 A; 100 MHz Current Probe – AC/DC; 30 A rms ; 50 A rms Pulse CP03130 A; 50 MHz Current Probe – AC/DC; 30 A rms ; 50 A rms Pulse CP03030 A; 50 MHz Current Probe – AC/DC; 30 A rms ; 50 A peak Pulse AP015150 A; 10 MHz Current Probe – AC/DC; 150 A rms ; 500 A peak Pulse CP150500 A; 2 MHz Current Probe – AC/DC; 500 A rms ; 700 A peak Pulse CP5001,400 V, 100 MHz High-Voltage Differential Probe ADP3051,400 V, 20 MHz High-Voltage Differential Probe ADP3001 Ch, 100 MHz Differential Amplifier DA1855A*A wide variety of other passive, active, and differential probes are also available.Consult LeCroy for more information.Product Description Product CodeHardware Accessories*10/100/1000Base-T Compliance Test Fixture TF-ENET-B †USB 2.0 Compliance Test Fixture TF-USB-B External GPIB Interface WS-GPIBSoft Carrying Case WRXi-SOFTCASE Hard Transit CaseWRXi-HARDCASE Mounting Stand – Desktop Clamp Style WRXi-MS-CLAMPRackmount Kit WRXi-RACK Mini KeyboardWRXi-KYBD Removable Hard Drive Package (Includes removeable WRXi-A-RHD hard drive kit and two hard drives)Additional Removable Hard DriveWRXi-A-RHD-02* A variety of local language front panel overlays are also available .† Includes ENET-2CAB-SMA018 and ENET-2ADA-BNCSMA.Customer ServiceLeCroy oscilloscopes and probes are designed, built, and tested to ensure high reliability. In the unlikely event you experience difficulties, our digital oscilloscopes are fully warranted for three years, and our probes are warranted for one year.This warranty includes:• No charge for return shipping • Long-term 7-year support• Upgrade to latest software at no chargeLocal sales offices are located throughout the world. Visit our website to find the most convenient location.© 2010 by LeCroy Corporation. All rights reserved. Specifications, prices, availability, and delivery subject to change without notice. Product or brand names are trademarks or requested trademarks of their respective holders.1-800-5-LeCroy WRXi-ADS-14Apr10PDF。
DirectDNAandPNAp...

Direct DNA and PNA probe binding to telomeric regions without classical in situ hybridizationMatthew D Genet †,Ian M Cartwright †and Takamitsu A Kato *BackgroundThe PNA probe is similar to a DNA probe,except the phosphate backbone is instead a pseudo-peptide polymer.The pseudo-peptide polymer has no charge,which does not repeal DNA or RNA.This allows the PNA probe to bind to a complimentary sequence of either DNA or RNA with a higher affinity than the DNA or RNA would have when binding with itself [1].Traditional FISH staining protocols have required factors that denature the DNA double helix in order for the probe to gain sufficient access to the DNA sequence and further hybridize to it [2,3].This is achieved by exposing the chromosomes to a concentrated solution of formamide at high temperatures,70to 80°C,for a few minutes,followed by the addition of the probe which is then allowed to hybridize for multiple hours at 37°C in a formamide solution.Formamide is a useful denaturant as it lowers both the stability and melting point of DNA linearly as the concentration of formamide increases [4].This hybridization period has been recently shortened to only a few minutes with theuse of a microwave;however,the use of formamide in the staining solution was still used [5].Our study has shown that the telomere PNA and DNA probes were able to bind to the telomeric regions without the use of either heat or formamide,while the centromere PNA probe still require both.It is a well-known fact that cytogenetic analysis,especially analysis of dicentric and centric ring formation,is the most reliable and strongest biomarker for assessing the exposure of an individual who has been exposed to radiation when no physical dose estimate is available.Because of this,it is crucial to understand the full extent of PNA FISH probes [6,7].Not only is PNA FISH staining effective in identifying dicentrics and other types of chromosomal damages,it also has had implications in CO-FISH and various other assays that address specific gene amplification and deletions [8-11].We have shown in our study that not only PNA,but also DNA probes have the ability to hybridize with their target,especially telomeric sequences,without denaturing the DNA and minimal incubation.This has the potential to allow for more sensitivity and rapid assays because the DNA is not as altered and retains more of its true structure.*Correspondence:****************************†Equal contributorsDepartment of Environmental and Radiological Health Sciences,Colorado State University,1618Campus Delivery,Fort Collins,CO 80523,USA©2013Genet et al.;licensee BioMed Central Ltd.This is an open access article distributed under the terms of the Creative Commons Attribution License (/licenses/by/2.0),which permits unrestricted use,distribution,and reproduction in any medium,provided the original work is properly cited.Genet et al.Molecular Cytogenetics 2013,6:42/content/6/1/42ResultsTreatment conditions in goat serum,formamide,or traditional denatureThe strength of the signals for TelC-Cy3,TelG-Cy3, CENPB Box-FAM and Cent-FAM in both the FISH protocol and the non-traditional situ hybridization at a hybridization period of18hours at4°C,room temperature,and37°C were analyzed.In Table1,the signal strength of the centromere and telomere probes were rated separately as;absent for no staining,poor high background for a signal on only a few chromosomes with high background,fair for over half being stained with moderate signal strength,and strong for a clear signal on all chromosomes.When using the goat serum alone at room temperature only the telomere signals showed on all chromosomes,but some centromere signals were lost in both CENPB Box-FAM and Cent-FAM probes(Figure1).On the other hand,the formamide without heat denature method,three probes except Cent-FAM probe had a strong signal on all chromosomes (Figure2).We confirmed all four probes stained on all chromosomes with traditional FISH method.For the non-traditional situ hybridization method,the TelC-Cy3 signal was strong on all chromosomes similar to FISH at all combinations of time periods and temperatures. The TelG-Cy3signal was present in all cases,however, the signal quality was often rated poor or fair as the signals were not always as strong or present on as many chromosomes as TelC-Cy3.As for the centromeres, CENPB Box-FAM signal was absent at lower temperatures in goat serum,and was only strong in formamide at room temperature or37°C.Cent-FAM probe signals were absent in both staining solutions at all temperatures.Time dependenceThe strength of the signals for TelC-Cy3and CENPB Box-FAM were analyzed at hybridization periods of1,4, and18hours at room temperature,and rated.Again, TelC-Cy3showed the strong signals on all chromosomes at all time points.The CENPB Box-FAM signal was absentTable1The signal strength of the telomere and centromere probes after an18-hour hybridization period at varying temperatures and conditions were rated as absent,poor,fair or strongProbes Goat Serum Formaldehyde FISH 4°C RT37°C4°C RT37°C TelC Strong Strong Strong Strong Strong Strong Strong TelG Poor HB Fair Strong Poor HB Fair Strong Strong CENPB Box Absent Poor Strong Fair Strong Strong Strong Cent Absent Absent Absent Absent Absent Absent Strong High background was indicated as,HB,frequently found accompanying that signal only at the specified conditions.FISH indicates the traditional FISH protocol was used.spread of the mouse fibroblast cell line,B70,stained with the TelC-Cy3and CENPB Box-FAMserum without denature protocol with a hybridization of4hours at room temperature.as strong while B shows the centromere(green),rated as poor.at a treatment period of1hour,poor at4hours,and strong at18hours.18hour hybridization at room temperature gives strong signals of TelC-Cy3and CENPB Box-FAM PNA probes to not only metaphase chromosome spreads,but also interphase nuclei(Figure3).Telomere DNA probes also bind to telomere without heat denatureDNA telomere probes were able to stain the telomere region of all chromosomes when they are incubated room temperature or37°C,but not4°C for overnight. Their signal strength was much lower than the PNA counterparts.Without heat denaturing,the PNA probes can achieve fair staining.DiscussionIn this study,we have shown that the heat-denaturing step in traditional FISH protocols is not required for PNA probes to bind to their target strand of DNA.Additionally, it was also noted that TelC-Cy3and TelG-Cy3PNA probes did not require any denaturing to hybridize with their target DNA strand.This supports results from prior studies performed outside the cell and chromosome which indicated that PNA probes have the ability to displace their target double strand DNA and form internal Watson-Crick bonds[12-14].As discussed in an earlier study,the classic heat denaturing step has been found to not be as critical as once believed for correct binding of DNA probes to their target DNA sequence[15].The study showed that in an ethylene carbonate buffer DNA probes could hybridize with their target when incubated overnight at 45°C.This supports our findings that PNA probes are capable of displacing a DNA double strand in the presence of only formamide.Initially,the strong telomere signal may be attributed to the fact that the telomere region of the chromosome is composed of loop structures possibly allowing the PNA probes easier access to single stranded DNA[16]. TelC-Cy3had a stronger signal than TelG-Cy3and it is important to note that TelC-Cy3targets the sequencespread allowing with TelC-Cy3and CENPB Box-FAM PNA probes using the direct staininghybridization of18hours at room temperature.Both the telomere(A)and centromere signals Figure3An interphase nucleus stained with the sameconditions as Figure2.contained in the single stranded T-Loop.Slides where treated with RNase and Pepsin prior to staining which allows us to rule out the binding of the PNA probe to either single stranded RNA or any proteins associated with the target region of the telomere.The differences in signal strength between telomere and centromere probes can be attributed to their target region and also the target sequence.In conclusion,this study shows that the need to denature the target DNA with any type of heat,and with certain PNA probes formamide,could possibly be avoided with the use of high affinity PNA probes.These results could possibly lead to more accurate cytogenetic analytics of chromosome aberrations.ConclusionsIn this study we have effectively demonstrated that telo-mere and centromere PNA probes could bind to their targets with limited denaturing by formamide alone.It was seen that TelC-Cy3and TelG-Cy3PNA probes bound to their telomere target at all temperatures and without formamide treatment.It was noted that CENPB Box-FAM and Cent-FAM did not bind to their target when formamide was omitted from the staining solution, indicating that the target region may play a role in how much the DNA has to be denatured before the PNA probe can bind.These findings suggest that PNA probes have a high enough affinity for their targets that they are able to bind to the target DNA strand without having to have the DNA helix separated.MethodsCell culturingB70mouse fibroblast cell strains were isolated from the skin of female C57/B6mice,using only early passages3 and4.B70cells were cultured in Minimum Essential Medium Alpha media(Hyclone,ThermoFisher,Waltham, MA)with15%FBS(Sigma,St.Louis,MO)antibiotics (Anti-Anti,Invitrogen,Indianapolis,IN)[5]. Chromosome harvestingApproximately8hours before harvesting,0.1μg/ml colcemid was added to the flasks to arrest the cells in M-phase.Cells were trypsinized and were suspended in 6ml of a75mM KCl solution warmed to37°C and placed in a37°C water bath for20min.Carnoy’s solution (3:1methanol to acetic acid)was added to the samples according to the standard protocol.Slides were placed in ice water and allowed to chill.The cell solution was dropped onto the cold slides.These were set aside and allowed to dry until the Carnoy’s solution had evaporated, roughly4–5minutes[7].FISH protocolThe slides were first submersed in RNase A(0.1mg/mL) at37°C for10minutes,followed by a PBS wash.Then, they were placed in4%paraformaldehyde in PBS for 10minutes at room temperature,washed in PBS,and then dehydrated in70%,85%,and100%ethanol for two minutes each in an ice water bath.They were then placed in a2XSSC70%Formamide solution at80°C for 2minutes,followed by the same ethanol wash.The PNA probe solution consisted of60%of Formamide,20mM of Tris–HCl,200nM of either TelG-Cy3(Cy3-O-TT AGGGTTAGGGTTAGGG)or TelC-Cy3(Cy3-O-CCCT AACCCTAACCCTAA)and200nM of either CENPB Box-FAM(FAM-O-ATTCGTTGGAAACGGGA)or Cent-FAM(FAM-O-AAACTAGACAGAAGCATT).This solu-tion was denatured at85°C for5minutes,then cooled down to37°C before adding30μL to each slide.The probes were allowed to hybridize overnight at37°C,and the slides were then washed in the2XSSC70%Formamide solution for15minutes at37°C,followed by5minutes in PN Buffer at room temperature.The chromosomes were counter stained with Prolong Gold Antifade with 4′,6-diamidino-2-phenylindole(DAPI)(Invitrogen)[17]. Direct staining without heat denature protocolThe slides were placed into4%paraformaldehyde in PBS for10minutes at room temperature,and then washed in PBS.Next,the slides were treated in RNase A(0.1mg/mL) in PBS at37°C for15minutes,followed by pepsin(0.002%) in100mM HCl treatment at37°C for15minutes,with washing with PBS in between and after.Finally,the slides were placed in70%,85%,and100%ethanol for two minutes each[5].Then,the probe solution the same as above was used,and in addition,a modified PNA probe solution was also used,consisting of200nM of either TelG-Cy3or TelC-Cy3and200nM of CENPB Box-FAM or Cent-FAM in60%of Formamide,20mM of Tris–HCl, 200nM or10%goat serum in PBS.These probe solutions were not heat denatured before adding30μL to the slides and secured with a coverslip and allowed to hybridize at either4°C,room temperature,or37°C for either1,4,or 18hours.After hybridization,the slides were submersed in1X PN buffer for5minutes at37°C,followed by a 5-minute wash in PBS at room temperature.The chromo-somes were counter stained with Prolong Gold Antifade with4′,6-diamidino-2-phenylindole(DAPI)(Invitrogen). Direct staining without heat denature with DNA TelC-Cy3 and TelG-Cy3probes were carried out in the same manner as a PNA probe.Those DNA telomere probes have same sequence as their PNA counter parts.Fluorescence imagingA Zeiss Axioplan fluorescence microscope(Zeiss, Oberkochen,Germany)was used with a Q-imaging Aquacooled CCD camera (Q-imaging,Surrey,BC,Canada).Images were combined using QCapture Pro 6.0software.Competing interestThe authors declare that they have no competing interest.Authors ’contributionsMG contributed primarily to image analysis and writing of the manuscript.IC contributed to the experiments and the writing of the oversaw the project in its entirety.All authors read and approved the final manuscript.AcknowledgementsWe would like to thank the Dr.Akiko M.Ueno Radiation Biology Research Fund,the Dr.John H.Venable Memorial Scholarship and the Technology Fee Stipend Student Experimental Learning Fund in College of Veterinary Medicine and Biosciences in Colorado State University for helping support our research and making this project a possibility.Received:8August 2013Accepted:11September 2013Published:8October 2013References1.Paulasova P,Pellestor F:The peptide nucleic acids (PNAs):a newgeneration of probes for genetic and cytogenetic analyses.Ann Genet 2004,47:349–358.2.Garcia-Sagredo JM:Fifty years of cytogenetics:a parallel view of theevolution of cytogenetics and genotoxicology.Biochim Biophys Acta 2008,1779:363–375.3.Durm M,Haar FM,Hausmann M,Ludwig H,Cremer C:Optimization offast-fluorescence in situ hybridization with repetitive alpha-satellite probes.Z Naturforsch C 1996,51:253–261.4.Ijichi K,Fujiwara M,Hanasaki Y,Katsuura K,Shigeta S,Konno K,Yokota T,Baba M:Inhibitory effect of 4-(2,6-dichlorophenyl)-1,2,5-thiadiazol-3-yl-N-methyl,N-ethylcarbamate on replication of human immunodeficiency virus type 1and the mechanism of action.Biochem Mol Biol Int 1996,39:41–52.5.Cartwright IM,Genet MD,Kato TA:A simple and rapid fluorescence in situhybridization microwave protocol for reliable dicentric chromosome analysis.J Radiat Res 2013,54:344–348.6.Hayata I,Kanda R,Minamihisamatsu M,Furukawa M,Sasaki MS:Cytogenetical dose estimation for 3severely exposed patients in the JCO criticality accident in Tokai-mura.J Radiat Res 2001,42(Suppl):S149–S155.7.Sasaki MS,Hayata I,Kamada N,Kodama Y,Kodama S:Chromosomeaberration analysis in persons exposed to low-level radiation from the JCO criticality accident in Tokai-mura.J Radiat Res 2001,42(Suppl):S107–S116.8.Williams ES,Cornforth MN,Goodwin EH,Bailey SM:CO-FISH,COD-FISH,ReD-FISH,SKY-FISH.Methods Mol Biol 2011,735:113–124.9.Williams ES,Bailey SM:Chromosome orientation fluorescence in situhybridization (CO-FISH).Cold Spring Harb Protoc 2009,2009:pdb prot5269.10.Bailey SM,Goodwin EH,Cornforth MN:Strand-specific fluorescence in situhybridization:the CO-FISH family.Cytogenet Genome Res 2004,107:14–17.11.Bailey SM,Goodwin EH,Meyne J,Cornforth MN:CO-FISH revealsinversions associated with isochromosome formation.Mutagenesis 1996,11:139–144.12.Wittung P,Nielsen P,Norden B:Extended DNA-recognition repertoire ofpeptide nucleic acid (PNA):PNA-dsDNA triplex formed with cytosine-rich homopyrimidine PNA.Biochemistry 1997,36:7973–7979.13.Egholm M,Buchardt O,Christensen L,Behrens C,Freier SM,Driver DA,BergRH,Kim SK,Norden B,Nielsen PE:PNA hybridizes to complementary oligonucleotides obeying the Watson-Crick hydrogen-bonding rules.Nature 1993,365:566–568.14.Bukanov NO,Demidov VV,Nielsen PE,Frank-Kamenetskii MD:PD-loop:acomplex of duplex DNA with an oligonucleotide.Proc Natl Acad Sci USA 1998,95:5516–5520.15.Matthiesen SH,Hansen CM:Fast and non-toxic in situ hybridizationwithout blocking of repetitive sequences.PLoS One 2012,7:e40675.16.Neidle S,Parkinson GN:The structure of telomeric DNA.Curr Opin StructBiol 2003,13:275–283.17.Maeda J,Yurkon CR,Fujisawa H,Kaneko M,Genet SC,Roybal EJ,Rota GW,Saffer ER,Rose BJ,Hanneman WH,et al :Genomic instability and telomere fusion of canine osteosarcoma cells.PLoS One 2012,7:e43355.。
Direct sequence spread spectrum data transmission

专利名称:Direct sequence spread spectrum datatransmission发明人:LUCIDARME, THIERRY JEAN,LE GARREC,GUY,COUSTY, JEAN-PIERRE PATRICK申请号:EP94401836.5申请日:19940810公开号:EP0644673A1公开日:19950322专利内容由知识产权出版社提供专利附图:摘要:In accordance with the invention, on transmission, the data are coded by a "transition" coding of differential type and drive a multiplexer which, for each data bit,selects a pseudo-random sequence at high throughput or the same sequence shifted by one code clock period according to the value of the data bit; on reception, the received signal is correlated with a pseudo-random code identical to that produced ontransmission and synchronised to the received signal. The synchronisation error signal ismeasured, and error pulses are detected every time the pseudo-random sequence selected on transmission changes. With the changes in pseudo-random sequence corresponding to changes of state of the transmitted information, this transmitted information is reconstituted by comparison of the error pulses with two threshold levels, respectively positive and negative, followed by differential demodulation.申请人:SOCIETE NATIONALE D'ETUDE ET DE CONSTRUCTION DE MOTEURSD'AVIATION, "S.N.E.C.M.A."地址:2, Boulevard du Général Martial Valin F-75015 Paris FR国籍:FR更多信息请下载全文后查看。
短距离无线通讯产品认证简介(胡
精心整理无线通讯产品验证一、前言近年来,由於无线产品之发展日新月异,产品不断普及,市场需求大幅增加,应用市场亦随之蓬勃发展,虽然从设计、研发以至於制造技术不断创新,然而市场之竞(DGT (一)(二) 1.2.3.4.5.6.7.8.9.(三)1.收发信机成套销售者,收发信机应一并送审,或提出经DGT型式认证合格之对应收、发信机之证书影本(盖公司大、小章)。
2.经型式认证合格之低功率射频电机,其型号、设计、射频性能或功能如有变更,应重新申请型式认证。
3.无线网路卡内键於笔记型电脑,允许以无线网路卡名称申请认证,申请书受)6.听觉辅助器材,系指用於传送声音以辅佐残障人士之电波收发信器材,故72-73MHz及216-217MHz频带不适用家用音响之无线传输。
7.待测物之输出功率可由软体控制,则测试时应将功率调至最高或其出厂之预设值。
8.申请认证之产品,其工作频率较高(如76-77GHz),国内通过电信总局认可之实验室无法测试,电信总局可接受国外实验室之报告,相关文件亦应备齐。
9.工作在5.25-5.35GHz之无线资讯传输设备,应在说明书上注明“限於室内使用”。
特别规格(依频率范围)● 1.705~10MHz(FCC15.223)●13.553~13.567MHz(FCC15.225)●26.29~27.28MHz(FCC15.227,26.96~27.28MHz)●40.66~40.70MHz及大於70MHz(FCC15.231)防盗器40.66~40.70MHz非间歇性发射。
●●●●●,但●(FCC15.247,亦包含902?928MHz,但不含24?24.25MHz)使用跳频(Frequencyhopping)或直接序列展频(DirectSequenceSpreadSpectrum)(1)使用频率:2400?2483.5MHz5725?5875MHz其他任何发射型式:应符合2.8节。
●2435~2465MHz,5785~5815MHz,10500~10550MHz,24075~24175MHz(FCC15.245)电场扰动侦测器(不含防盗器)其他任何发射型式:应符合2.8节●2.9~3.26GHz,3.267~3.332GHz,3.339~3.3458GHz,3.358~3.6GHz车辆识别系统其他任何发射型式:应符合2.8节特殊器材规格●●●、●民用无线电对讲机227.1~227.4MHz,229.4~230.0MHz,230.1~231.9MHz,794.0~806.0MHz 三、美国FCC无线产品之型式认证(一)申请作业流程(二)申请申请认证1.授权书(AuthorizedLetter) 5.说明书(UserManual)2.电路图(Schematics) 6.标签格式及其位置(FCCIDLabel&Location)3.方块图(BlockDiagram)7.工作原理说明(PrincipleDescription)4.产品规格(Specification)(三)贴於产品本体之FCC标签图解范例(四)制作文件有何应注意事项?1.厂商除了在标签上应注明FCCID:XXXOOOO,产品名称、型号与制造地点,如果产品本身亦应符合FCCDOC(如NotebookPC内键无线网路卡),则应标上mark,此外,下列文字应标注在标签上,如果标签位置大小,亦允许放在说明书上。
PrimeDirect Probe RT-qPCR Mix产品说明书

URL:
3
PrimeDirect™ Probe RT-qPCR Mix
mRNA
cDNA 3’
Specific primer (forward) 5’
3’
5’ 3’ 5’ 3’ 5’ 3’
Cat. #RR650A
v201906Da
3’
5’
Specific primer (reverse)
IV. Materials Required but not Provided
2
URL:
PrimeDirect™ Probe RT-qPCR Mix
Cat. #RR650A
v201906Da
I. Description
PrimeDirect Probe RT-qPCR Mix is designed for one-step real-time RT-PCR via probe detection (5'-nuclease method). This product is supplied as a 2X premix to facilitate easy preparation of reaction mixtures, requiring only the addition of your primer, probe, and sample. The RT-qPCR can be performed by simply adding your sample directly to the reaction mixture without intervening nucleic acid purification steps. The protocol for performing all steps in a single tube, from extraction of the nucleic acid to reverse transcription and qPCR, greatly reduces hands-on time and risk of contamination. The continuous reaction from nucleic acid extraction (90℃) through reverse transcription (55 to 65℃) is also suitable for the detection of RNA viruses with complex higher-order structures. High-efficiency PCR after cDNA synthesis detects DNA amplification in real time by increasing fluorescence from the probe. Because this product is highly resistant to various PCR inhibitory substances such as heparin (blood) and humic acid (soil), it can be used to directly detect viruses and bacteria in various biological specimens and to directly analyze gene expression in cells.
几种无线标准的简单规格

IEEE 802是⽬前所有⽆线上的传输标准,⽬前已经有IEEE 802.11、IEEE 802.11a、IEEE 802.11b、IEEE 802.11g以及最新的IEEE 802.11n等⼏种⽆线传输标准,这⼏种不同的⽆线传输标准之间的区别就在于传输速度的差异,802.11n是⽬前速度最快的⽆线传输标准,理论最快速度可以达到300Mbps。
为了对各种⽆线标准进⾏区别,下⾯笔者给⼤家介绍⼀下⼏种⽆线标准的简单规格。
802.11 -- 初期的规格采直接序列展频技术(Direct Sequence Spread Spectrum,DSSS)或跳频展频技术(Frequency Hopping Spread Spectrum,FHSS),制定了在RF射频频段2.4GHz上的运⽤,并且提供了1Mbps、2Mbps和许多基础讯号传输⽅式与服务的传输速率规格。
802.11a -- 802.11的衍⽣版,于5.8GHz频段提供了54 Mbps的速率规格,并运⽤orthogonal frequency division multiplexing encoding scheme以取代802.11的FHSS 或 DSSS。
802.11b (即所谓的⾼速⽆线路或Wi-Fi标准),1999年再度发表IEEE802.11b⾼速⽆线路标准,在2.4GHz频段上运⽤DSSS技术,且由于这个衍⽣标准的产⽣,将原来⽆线路的传输速度提升⾄11 Mbps并可与⼄太路(Ethernet)相媲。
802.11g -- 在2.4GHz频段上提供⾼于20 Mbps的速率规格。
802.11n :使⽤2.4GHz频段和5GHz频段,传输速度300Mbps,可达600Mbps,可向下兼容802.11b、802.11g,⽬前其还仅处于草案状态,还不是⼀个正式的⽆线传输标准。
从规格上来看,⼀些技术性的东西可能还⽆法理解,不过⼤家对⽆线络更为关⼼的可能还是传输速度的问题。
无线通信与网络chap7
User B code = <1, 1, –1, – 1, 1, 1>
To send a 1 bit = <1, 1, –1, –1, 1, 1>
Receiver receiving with A’s code
(A’s code) x (received chip pattern)
User A ‘1’ bit: 6 -> 1 User A ‘0’ bit: -6 -> 0 User B ‘1’ bit: 0 -> unwanted signal ignored
Property 3:
Sequence contains one run of ones, length n One run of zeros, length n-1 One run of ones and one run of zeros, length n-2 Two runs of ones and two runs of zeros, length n-3 2n-3 runs of ones and 2n-3 runs of zeros, length 1
Spread Spectrum
On receiving end, digit sequence is used to demodulate the spread spectrum signal Signal is fed into a channel decoder to recover data
FHSS Using MFSK
MFSK signal is translated to a new frequency every Tc seconds by modulating the MFSK signal with the FHSS carrier signal For daead Spectrum
无线2
Wireless NetworkExperiment Two:Direct Sequence Spread Spectrum Techniques 直序扩频通信仿真ABSTRACTThis experiment is designed to learn the spread spectrum techniques on which 3G wireless communication based. During the experiment, we will use MA TLAB to simulate the whole process of direct sequence spread spectrum.Keywords: direct sequence spread spectrum (DSSS), m sequence, autocorrelation, BPSK.INTRODUCTIONIn telecommunications, direct sequence spread spectrum (DSSS) is a modulation technique. As with other spread spectrum technologies, the transmitted signal takes up more bandwidth than the information signal that is being modulated. The name 'spread spectrum' comes from the fact that the carrier signals occur over the full bandwidth (spectrum) of a device's transmitting frequency. Direct sequence spread spectrum has outstanding resistance to intended or unintended jamming. And different signals of direct sequence spread spectrum can share of a single channel among multiple users.Its characteristics reduced signal/background-noise level hampers interception.STEPS AND RESULTS OF THE EXPERIMENTS1.Generate an m sequence:2.Calculate the autocorrelation sequence of it:3.Then we define a input signal and multiply the m sequence with it:4.After the multiplication of m sequence and modulation without noise:5.We add the Added Gaussian White Noise and get the signal as below:7.After filter the AGWN and doing sampling judgment, we get the input signal again:CONCLUSIONFrom this lab, we have learned the MA TLAB language of realizing direct sequence spread spectrum, which is widely used in modern communication and military communication. Besides,we have got familiar with much relative mathematical knowledge, such as correlation andorthogonality, by this lab. In this experience, we modeled a direct sequence spread procedure, and that give us a deeper understanding to this lecture.APPENDIXmain:connections = '1010001110100001';%n阶反馈寄存器系数c = bin2dec(connections);[f a] = smodulate(c,8,1,64,128);figure();plot(f);axis([0 256 -2 2]);xlabel('Modulated Signal');figure();plot(a);axis([0 128 -2 2]);xlabel('Original Signal');g = noise(f,8);figure();plot(g);axis([0 256 -2 2]);xlabel('Modulated Signal with Noise');x = sdemodulate(f,c,8,1,64,128);x = x*2-1;comp(a,x);figure();plot(x);axis([0 128 -2 2]);xlabel('Demodulated Signal');chip:function [out,Tc] = chip(ms,T)Tc = 1/64;N_s = 8;N = length(ms);dt = Tc/N_s;t = 0:dt:N*Tc - dt;gt = ones(1,N_s);mt = sigexpand(ms,N_s);mt = conv(mt,gt);out = mt(1:N*N_s);comp:function [out] = comp(in1,in2);l1 = length(in1);l2 = length(in2);if l1 ~= l2out = -1;elsed = 0;l =l1;for i = 1:lc = in1(l) - in2(l);d = d + c;endout = d;endms_gen:function [out,l] = ms_gen2(g,state,N)lA = length(g);if lA == 1connections = dec2bin(g) - '0';elseconnections = g;endlB = length(connections);regState = dec2bin(state,lB -1) - '0';l = 2^(lB - 1) -1;loop = min(l,N);for k = 1:loopperiod(k) = regState(lB - 1);an = rem(sum(connections(2:end).*regState),2);regState = [an regState(1:lB-2)];endif N > li = fix(N/l);j = rem(N,l);for i1 = 1:iout(((i1-1)*l+1):(i1*l)) = period(1:l);endout((i*l+1):N) = period(1:j);elseout = period;endd = 1 - 2*out;l = min(l,N);auto_corr = conv(d,d(l:-1:1))/l;figure();stem(auto_corr(l:end));axis([0 100 -2 2]);xlabel('Autocorrelation of m sequence'); msignal:function [out,d] = msignal(ms,Tc)N_s = 8;A = 1;Sr = 1;N1 = length(ms);N = N1*Tc/N_s;Ts = 1/Tc;fc = 1;dt = 1/fc/N_s;t = 0:dt:N*Ts-dt;Lt = length(t);d=sign(randn(1,N));dd = sigexpand(d,fc*N_s*Ts);gt = ones(1,fc*N_s*Ts);d_NRZ= conv(dd,gt);out = d_NRZ(1:N1).*ms;AGWN:function [out] = noise(in,EsN0dB)l = length(in);sigma = sqrt( 10.^(-EsN0dB/10)/2 );out = in + sigma*randn(1,l);sdemodulate:function [out] = sdemodulate(in,g,state,symRate,spreG,cf)le = length(in);A = 1;fc = cf;N_s = 8;N = le/cf/N_s;Ts = symRate;Tc = Ts/spreG;dt = 1/fc/N_s;t = 0:dt:1*Ts-dt;Lt = length(t)N1 = N/Tc;ms = ms_gen2(g,state,N1);msd = 1 - ms*2;msd = sigexpand(msd, fc*Tc*N_s);gc = ones(1,fc*Tc*N_s);md = conv(msd,gc);md = md(1:le);ht = A*cos(2*pi*fc*t);in2 = in.*md;psk = reshape(in2',(1/dt/Ts),le*dt/Ts);psk = psk';for i = 1:le*dt/Tss = sum(psk(i,:).*ht);if s > 0out(i) = 1;elseout(i) = 0;endendsigexpand:function [out]=sigexpand(d,M)N=length(d);out=zeros(M,N);out(1,:)=d;out=reshape(out,1,M*N);smodulate:function [out,d] = smodulate(g,state,symRate,spreG,cf)A = 1;fc = cf;N_s = 8;N = 1000;Ts = symRate;Tc = Ts/spreG;dt = 1/fc/N_s;t = 0:dt:N*Ts-dt;Lt = length(t)N1 = N/Tc;ms = ms_gen2(g,state,N1);msd = 1 - ms*2;msd = sigexpand(msd, fc*Tc*N_s);gc = ones(1,fc*Tc*N_s);md = conv(msd,gc);md = md(1:Lt);d=sign(randn(1,N));dd = sigexpand(d,fc*N_s*Ts);gt = ones(1,fc*N_s*Ts);d_NRZ = conv(dd,gt);ht = A*cos(2*pi*fc*t);d_2psk = d_NRZ(1:Lt).*md; out = d_2psk.*ht;。
ChromasPro1.41使用说明
ChromasPro 1.41使用说明1.0TITLE(标题)使用ChromasPro 1.41版本软件对基因型进行分析2.0PURPOSE(用途)2.1ChromasPro是对基因和蛋白质序列进行分析的生物软件。
应用生物系统公司基因分析仪和西门子Trugene产生的序列和图谱可以用ChromasPro软件查看、编辑和制图。
2.2ChromasPro用于基因序列的剪切和编辑和抗病毒药物的耐药监测2.3ChromasPro有能力组装成一个连续的重叠共享序列片段。
此外,该软件还可以用来识别发现在同一区域的不同片段的序列多态性3.0EQUIPMENT(设备)3.1有奔腾处理器的电脑或等同的3.2ChromasPro 1.41版本软件4.0SUPPLIESN/A5.0SPECIAL SAFETY PRECAUTIONSN/A6.0PROCEDURE (步骤)6.1Procedure Limitations and Requirements(程序的限制和要求)6.1.1确保待分析的序列有最好的质量。
如果序列的图谱片段较差,需要重新测序6.1.2每次测序需要加入已知序列的阳性质控对照6.1.3序列片段小于350个碱基时的准确性是非常好的。
(误差<0.1%)。
6.1.4序列片段在500个碱基的准确性取决于PCR的产物质量和所使用的测序技术。
6.2Sequence Assembly(序列的拼接)6.2.1从file菜单中选择new,在new选sequencing project.6.2.2.Choose Settings 在目project项单中选择setting 显示出project setting 对话框。
设置序列输入的长度及输入比对序列。
6.2.3Import Sequence Fragments 从project项单中选择add files 把序列片段导入project。
多个序列片段可以被导入,已经导入的文件不能再被导入。
氮化镓_GaN_纳米材料的制备
[收稿日期]20060520 [作者简介]赵永生(1979),男,2003年本科毕业,助教,现主要从事物理学方面的教学与研究。
氮化镓(GaN )纳米材料的制备 赵永生,高晓亮 (武警沈阳指挥学院训练部,辽宁沈阳110113)[摘要]通过直流电弧等离子体方法制备了氮化镓纳米晶,并研究了制备的样品的基本特性。
使用N 2和N H 3的混合气体进行反应,并对样品进行了电子显微镜扫描(SEM ),X 射线衍射(X RD )和Raman 散射分析。
试验发现,样品为纤锌矿结构,平均大小为50nm 左右,晶格常数为a =3.186,c =5.174。
[关键词]氮化镓纳米晶;直流电弧等离子体;X 射线衍射(XRD );Raman 散射[中图分类号]O484.1[文献标识码]A [文章编号]16731409(2006)02050003 在常温常压下,氮化镓(GaN )的结构为六方晶系纤锌矿型结构,可以看成是由Ga 的六方密堆格子与N 的六方密堆格子沿Ga —N sp 3键方向错位套构而成。
GaN 是一种宽禁带半导体材料,其带隙宽为3.4eV ,是制作蓝、绿发光二极管(LED )和激光二极管(LD )的理想材料。
此外,GaN 还具有许多独特性质:高电导率和热导率、高硬度及较大的饱和电子迁移率等等。
氮化镓纳米晶的制备方法有很多种,如物理粉碎、激光加热、溶胶凝胶、化学沉积、等离子体和电爆炸等方法。
鉴于GaN 的高硬度、高熔点、分解温度等特性,笔者采用直流电弧等离子体方法制备氮化镓纳米粉。
1 制备方法制备氮化镓纳米粉末的试验装置,主要是由直流电弧等离子体发生系统、可升降的坩锅系统、粉末的冷却系统、密闭的收集系统及真空系统等5大部分组成。
试验中将反应系统预置真空后(20Pa 以下),将反应原料金属镓块体材料置于阳极坩埚之中,用机械泵抽真空至10-2To rr (1To rr =133.322Pa ),然后充入反应气体至特定气压(1Pa 以下)。
- 1、下载文档前请自行甄别文档内容的完整性,平台不提供额外的编辑、内容补充、找答案等附加服务。
- 2、"仅部分预览"的文档,不可在线预览部分如存在完整性等问题,可反馈申请退款(可完整预览的文档不适用该条件!)。
- 3、如文档侵犯您的权益,请联系客服反馈,我们会尽快为您处理(人工客服工作时间:9:00-18:30)。
A Chaotic Direct-Sequence Spread-Spectrum System for UnderwaterCommunicationS. Azou1 and G. Burel11Laboratoire d’Electronique et Systèmes deTélécommunications (UMR CNRS 6165)6, Avenue Le Gorgeu, BP 80929285 BREST Cedex, Francee-mail : {Stephane.Azou, Gilles.Burel}@univ-brest.frC. Pistre22Groupe d’Etudes Sous-Marines de l’Atlantique(GESMA), BP 4229240 BREST Naval, Francee-mail : pistre@gesma.frAbstract-The recent advances in acoustic modem technology have enabled the development of Underwater Acoustic Networks (UAN). Application interests include oceanographic information gathering, environmental monitoring or coastal defense. Due to its ability of simultaneously sharing the same frequency band for various users and the poor propagation conditions usually encountered in shallow water environment, the Code Division Multiple Access (CDMA) is a promising scheme for UAN. Recent results show that a standard CDMA direct-sequence spread spectrum approach is not sufficient to ensure Low Probabilities of Detection (LPD) and/or Interception (LPI), that is an unauthorized observer may notice that a communication signal is present. For many applications, this drawback is not acceptable.In this paper, the application of chaos to transmission of information is under investigation to achieve an LPI/LPD objective in an UAN context. Performance results of two receivers are shown for a single user through a realistic simulation scenario. An experiment at sea will be conducted by GESMA soon to confirm these first results.I. I NTRODUCTIONFor many applications the data transmission has to be carried out at low Signal-to-Noise Ratio (SNR). For UAN [1], the minimization of the output power at each node is desirable to reduce the battery consumption (immersed autonomous transmitter). In a military context, the low SNR constraint comes from a discretion purpose (preventing the ennemy to detect the transmission). Due to severe propagation conditions usually encountered in shallow water (limited bandwidth, time varying multipath, noise), resulting in Inter Symbol Interference (ISI) and Doppler effect, Spread Spectrum (SS) techniques are often used at low SNR. Two major spreading techniques are available [2] : Frequency Hopped (FH) or Direct-Sequence (DS) spreading. The two approaches allow multiple users to operate simultaneously in time over the same frequency band, by using pseudo-noise (PN) codes (Code Division Multiple Access). A FH-SS system changes the frequency of the carrier signal continuously, in a pattern obtained from a PN code. This scheme is able to combat great Doppler spread but is less efficient than DS-SS for low SNR.In a standard DS-SS system, the data to be transmitted are multiplied by a PN sequence, generally produced by linear feedback shift registers (e.g. maximal length sequences, Gold sequences…). The resulting wideband signal modulates the carrier. The transmitted wave has then to be demodulated by the receiver : it is realized by correlating the received signal with a copy of the direct-sequence (periodic) used by the transmitter, in a synchronous manner.As demonstrated in recent papers [3][4], a transmission by DS-SS is not secured, even if the SNR is below 0 dB, due to the periodic nature of the spreading code. Hence, a receiver unaware of the transmission on the channel will be able to determine that any signal is being sent (Interception). Then, the demodulation becomes possible if the construction process of the spreading code is well known (Detection). These remarks make the principal motivation for the study presented in this paper.There has been significant interest in recent years in exploiting chaos in communication systems [5][6]. Due to its random-like behavior and its wideband characteristics, a chaotic dynamical system can be very helpful for discretion purposes. Chaos not only spreads the spectrum of the information signal but also acts as an encryption key. Thus, without knowledge of the type of nonlinearity on which the transmission is based (the chaotic dynamic), it is extremely difficult for the unauthorized user aware of the transmission to access the information. Furthermore, such signals are potentially robust against channel imperfections such as multipath propagation or jamming. As a result of their sensitive dependence on their initial conditions, chaotic systems are able to produce large sets of uncorrelated signals. This extreme sensitivity can be demonstrated by giving two very close initial states to a chaotic map ; After a few iterations, the two resulting sequences will look completely decorrelated. This can be observed even for very simple (one dimensional discrete-time) chaotic dynamical system. The large signal set generated is an attractive feature in a multiple access transmission context.In this paper, it is proposed to replace the periodic PN-code used in standard DS-SS communication systems by a chaotic code and we propose a new and robustdemodulator based on dual Unscented Kalman Filters. The idea of a chaos based DS-SS system is not new [7][8] ; however few results are available concerning experimental results or realistic scenarios at the moment.A fundamental difference for a Chaotic DS-SS (CD3S) system in comparison with a classical DS-SS system is that each data symbol is multiplied by a different spreading code each time. Consequently, demodulation of CD3S signals will be more tricky than in the standard case (periodic sequence), especially if the SNR is low.In this paper, the feasibility of a CD3S system is examined in shallow water environment, for a single user. Two new schemes of demodulation are proposed for the receiver, namely the Exact Spreading Sequence (ESS) demodulation and the Dual Unscented Kalman Filtering (UKF) demodulation. The first solution relies upon regeneration of an exact replica of the chaotic spreading code, applied at the transmitter side. The second solution, more general, is based on a dual estimation of the spreading code and the data symbols through the Unscented Kalman filtering approach proposed by Julier et al . [9] in the different context of nonlinear control.The paper is organized as follows. Section II is devoted to general results about the logistic map, used here as the spreading code generator. The CD3S transmitter is explained in section III. Then, the design of CD3S receivers is mentionned in section IV. System performances are illustrated in section V. Finally, section VI summarizes the conclusions and gives an outline of future research directions in this area.II. C HAOTIC S PREADING S EQUENCES AND THEL OGISTIC M APA chaotic dynamical system is one that is deterministic but appears not to be so, as a consequence to its extreme sensitivity to initial conditions. A chaotic system can be described by state space equations :,...2,1,0 , )(1==+k x f x k k where is called the state, and maps the state to the next state .nk x ℜ∈k (.)f x 1+k x Given the same initial conditions, two chaotic systems with the same state parameters will result in exactly the same sequence of output samples. On the other hand, any minor difference between initial states will lead to an eventual divergence of the output streams from the two systems. Asymptotically, the output streams will becompletely decorrelated.Fig. 1. Bifurcation diagram for the logistic map.A chaotic map does not have to be very complicated. However, in a context of CDMA application, the map has to possess a δ-like autocorrelation function, for a proper signal detection, and a low cross-correlation function for proper signal separation. Moreover, a zero-mean symmetric sequence is desirable.As in [7], the logistic map is chosen here as the spreading sequence generator :()k k k x rx x −=+11 This system exhibits a great variety of dynamics, depending upon the value of the bifurcation parameter . To obtain a chaotic dynamic the bifurcation parameter must be chosen so that the Lyapunov exponent is strictly positive. Figure 1 shows the evolution of λas a function of r . It is seen that for almost all the system is chaotic. For the case r=4 the map generates intricate trajectories and some favorable analytical properties are available, as mentionned in [8]. In what follows we will refer to this particular case. In order to have symmetric zero-mean trajectories, the state equation is modified as]4,1[∈r λ].3[∈r 4,62121k k x x −=+Figure 2 illustres typical trajectories for the system. A lowcross-correlation is clearly seen, although the initial states for the two sequences differ only by 10-5.Fig. 3. Logistic map autocorrelation fluctuations averaged over100 runs, for a sequence of length 63 ()σ±mFig. 2. Two spreading sequences generated by the logistic map(127 chips) ; The initial states differ only by 10-5.The overall performance of a DS-SS system is dependent upon the correlation properties of the spreading sequence. Asymptotically, the logistic map is able to produce an infinite set of orthogonal codes by choosing different initial states and/or changing the bifurcation parameter. That is, the autocorrelation tends towards a δ-function and the crosscorrelation is equal to zero. Nevertheless, in practice, it is not evident that we can take advantage of these properties : For finite length sequences, partial correlation appears and secondary peaks are noticed for the autocorrelation. As a consequence, the processing gain of a CD3S communication system will have to be designed with caution. As illustrated by figure 3, for a 63-length logistic sequence , the autocorrelation moves away from the perfect -function, but is still acceptable. Shorter sequences must be avoided. The correlation fluctuations is not the only reason for performance degradation ; The problem of bit energy fluctuations has also to be noticed. Figure 4 illustrates these fluctuations as a function of processing gain. It is clearly seen that very short sequences (length less than 63) are not suitable for a CDMA application.δFig. 4. Bit energy fluctuations vs. Processing gain for the logisticmapFinally, notice that no restriction exists for a chaotic sequence concerning its length. This is not the case for standard PN (maximal-length or Gold) codes which must have a length equal to . 12−nIII. C HAOTIC D IRECT -S EQUENCE S PREAD S PECTRUM(CD3S) S IGNALSAt the transmitter, the information is structured in frames, as shown by figure 5. After spreading the data signal through use of the chaotic map (logistic), chaotic markers, whose length is identical to the processing gain (number of chips of the spreading sequence per data symbol), are regularly inserted in order to synchronize the receiver. This means that the receiver can reconstruct themarkers in an autonomous way.Fig. 5. Frame structure used at the CD3S transmitter.A basic solution is to repeat the same chaotic marker for each new frame and to store the marker signal at thereceiver side. A more sophisticated approach is to use a secondary chaotic map (with the same or similar dynamic), whose initial condition is changed according to a reference clock. Then the receiver has to reconstruct the marker signals refering to a synchronized clock (the relative clockdrift must be negligible).Fig. 6. Chaotic DS-SS (CD3S) modulator.Figure 6 illustrates the principles of the CD3S modulator. At the moment, data have been modulated through BPSK. A differential encoding may be performed to eliminate the phase ambiguity at the reception. The spreading operation is done by multiplication of the data symbols with the chaotic signal, evolving at a rate Fc >>Fd , being the data rate. The processing gain W must be an integer. Its value depends on the bandwidth available for the propagation channel, notably. The chaotic markers, also sampled at a rate Fc, are inserted before an upsampling process by zeros inserting. Then a square-root raised cosine shaping filter is applied, with a rolloff factor of 0.5, before a carrier modulation at central frequency. To avoid aliasing, the signal has to be sampled at a minimum value of .d F Fd Fc /=c F )αα0F F 1(20++IV. D EMODULATOR S TRUCTURES FOR CD3S S IGNALSIn this section, we focus on the demodulator design for CD3S signals. Two schemes are investigated ; The first one, named Exact Spreading Sequence (ESS), relies on the knowledge of the original spreading sequence, that is the one that has been used by the transmitter to spread the spectrum of the information signal. The second scheme, called Dual Unscented Kalman Filtering, is based on a simultaneous estimation of the state of the noisy received chaotic signal and the data symbol. Due to strong nonlinearity of chaotic signals, such an estimation must be carried out with a robust state space adaptive filter. This problem has been solved here owing to the Unscented transformation recently developped by Julier et al. [9]. This method allows the calculation of the statistics of arandom variable which undergoes a non-linear transformation in an efficient manner.A. Receiver preprocessingFig. 7. CD3S receiver preprocessingFigure 7 shows the preprocessing blocks at the receiver. The received signal, sampled at frequency has first to be brought back to baseband and lowpass filtered (square root raised cosine filter) before any processing. Then, the frames are synchronized, by correlations, thanks to the set of chaotic markers that has been inserted by the transmitter. The carrier phase fluctuations, caused by clock drift and/or Doppler effect, must then be compensated. A basic solution is to exploit the markers to estimate the phase difference over current frame. A correction via linear interpolation is then possible. At this stage, the information is embodied in the real part of the signal only, for a binary data modulation (BPSK, DPSK). Before demodulation, it remains to adjust the signal power. An additional channel equalization is then performed. This problem, essential for a practical issue, is not adressed in the present paper. s F B. Exact Spreading Sequence (ESS) DemodulatorThis demodulator is outlined by figure 8. The ability of the receiver to reconstruct exactly, in a synchronous manner, the original spreading sequence, is of central importance in this approach. Assuming this objective is realizable, the symbol decision is just given as the sign of the output of a correlator, operating over symbol duration. A first solution, the simplest, could be to utilize the same initial state for the chaotic spreading sequence for each new transmission. Knowing this starting point and the chaotic dynamic, the receiver will be able to reproduce the whole sequence. Another way could be to reinitialize the sequence for each new frame, by choosing initial values ina finite set, known by the receiver. By using approximatly synchronized clocks (small relative drift), and the way the initial value is changed during the transmission, the receiver can retrieve the whole sequence.V. N UMERICAL R ESULTSA.Shallow Water Acoustic Channel Model &Transmission ScenarioNumerical simulations have been conducted to evaluate performances of our CD3S receivers. The transmission has been operated through use of an additional software module able to predict acoustic field using a ray method. Hence, important characteristics of the shallow water propagation channel have been taken into acccount, that is the range dependent nature of the medium, sorts of bottom profile, random air-sea boundaryand ambiant noise (Knudsen model).Fig.8. CD3S Exact Spreading Sequence demodulator.C.Dual Unscented Kalman Filtering (UKF) DemodulatorDual Unscented Kalman Filtering, shown at figure 9, is a more general approach to solve the problem of CD3S signals demodulation. Here, the exact knowledge of the chaotic spreading code is not available at the receiver side. Hence, it is necessary to estimate the sequence from the received noisy signals. As the underwater acoustic channel is a very hostile medium (multipath, Doppler spread, various noises), this approach becomes a very challenging task. The Unscented Kalman Filter (UKF), detailed in [9], is a particularly innovative solution to the problem a non-linear state space estimation. The algorithm, not detailed here, has a structure comparable to the usual Extended Kalman Filter (EKF) [10]. In presence of strong nonlinearity, EKF is known to have an unstable behaviour. Moreover, its implementation can be delicate. For these reasons, the UKF solution is recommended here, with a combined estimation scheme : One filter has to estimate the state of the noisy chaotic signal and the second filter searches the associated information symbol (unknown parameter). Each filter uses the last estimates of the other. The output of the second filter is continuous time. Then, a symbol decision is taken as the sign of the averaged output over symbol duration.Fig. 10. Averaged impulse response for the shallow wateracoustic channelThe transmission range was 8 km, with a transmitter placed to a depth of 20 m and a receiver to 40 m. The water depth was 90 m, and an averaged sound speed profile measured at ϕ latitude andlongitude has been used. The bottom,made of smudge, was flat and there was no wind. A frame of 200 bits, BPSK modulated, has been transmitted with a carrier frequency equal to 8820 Hz and a chip frequency of 4410 Hz. The processing gain was 80. The SNR value was 0 dB at receiver input."00'3010°="00'3016°=g c F 0FThe averaged impulse response of the channel is shown by figure 10 (on this figure, the time-evolution of the impulse response, taken into account for simulations, is not shown). Figure 11 gives the acoustic loss field observed during transmission.Fig. 9. CD3S Dual Unscented Kalman Filtering demodulator.Fig. 11. Acoustic transmission loss fieldB. ESS-based receiver performanceFig. 12 – Correlator output for the ESS CD3Sdemodulator.For this scenario, the ESS demodulator performs very well, as no decision error is noticed. Figure 12 shows the correlator ouput values. Indeed, in [7], for an additive white gaussian noise channel simulation, it has been mentionned that an approach similar to our ESS scheme has performances comparable to a standard DS-SS system, if the receiver synchronization is ensured. Hence, our results are no surprising.C. Dual UKF-based receiver performanceThis demodulator is more sensitive to channel imperfections, as it can be observed on figure 13. A Bit Error Rate (BER) of 5.5 % is noticed. Nevertheless, it should be emphasized that a basic implementation of the dual filtering scheme has been done (simple dynamic model for signals at demodulator input, notably) and that we don’t make use of an equalizer or channel encoding to reduce the BER. Finally, note the limited processing gainused.Fig. 13 – Dual Unscented Kalman Filtering CD3Sdemodulation (first 50 symbols).VI. C ONCLUSION S & F UTURE W ORK Motivated by covertness deficiencies of standard spread spectrum systems, we have examined the feasability of chaos based underwater communications. We have adopted a direct-sequence approach which is surely one of the most promising chaos based communication schemes. The aperiodicity of the spreading code, which plays a central role in such a system, has led us to develop specific demodulators. The first one, called Exact Spreading Sequence (ESS) demodulator, is comparable to the one previously mentionned in [7]. This solution, potentially excellent, applies only if the receiver is able to reproduce, in a synchronous way, the original spreading code. A robust reproduction strategy has then to be developed. The second solution is based on a dual state space adaptive filtering scheme (Unscented Kalman Filters), in order to estimate simultaneously the state of the received chaotic signal and the associated symbol. Then, the demodulator makes use of an approximate spreading sequence only. Despite this approximation, encouraging results have been observed.Applications such as Underwater Acoustic Networks could take benefits of these results.The multiuser capability of CD3S systems has not been discussed here ; This problem is currently under investigation. To confirm our first conclusions, an experiment at sea will be performed soon with the help ofGESMA1. To get a competitive system, it should be judicious to exploit the time-diversity that is present on the channel.R EFERENCES[1] E. M. Sozer, M. Stojanovic, J. G. Proakis,« Underwater Acoustic Networks », IEEE J. Oceanic Eng., Vol. 25, No 1, 2000.[2] J. G. Proakis, Digital communications, 3rd ed., Mac-Graw-Hill Int. Ed., 1995.[3] G. Burel, C. Bouder, « Blind estimation of the pseudo-random sequence of a direct-sequence spread spectrum signal », IEEE 21st Century Military Communications Conference (IEEE-MILCOM’2000), October 22-25, 2000, Los Angeles, USA.[4] M. K. Tsatsanis, G. B. Proakis, « Blind estimation ofdirect sequence spread spectrum signals in multipath », IEEE Trans. Signal Processing, Vol. 45, No. 5, pp.1241-1252, 1997.[5] L. M. Pecora, T. L. Caroll, « Synchronization inchaotic systems », Phys. Rev. Lett., 64, pp. 821-824, 1990.[6] M. Hasler « Synchronization of chaotic systems andtransmission of information », Int. J. Bifurcation and Chaos, Vol. 8, No 4, pp 647-659, 1998.[7] G. Heidari-Bateni, C. D. McGillem, « A chaotic direct-sequence spread spectrum communication system », IEEE Trans. Comm., Vol. 42, No. 2, pp. 1524-1527, 1994.[8] V. Milanovic, K. M. Syed, M. E. Zaghloul,« Combating noise and other channel distorsions in chaotic communications », Int. J. Bifurcation and Chaos, Vol. 7, No. 1, pp. 215-225, 1997.[9] S. Julier, J. Uhlmann, H. F. Durrant-Whyte, « A newmethod for the nonlinear transformation of means and covariances in filters and estimators », IEEE Trans.Automat. Contr., Vol. 45, No. 3, pp. 477-482, 2000. [10] Y. Bar-Shalom, X.-R. Li, « Estimation and Tracking –Principles, Techniques ans Software », Artech House, 1993.1 Groupe d’Etudes Sous-Marines de l’Atlantique, Brest, France.。