陕西省西安市2019统计年鉴数据:13-5 规模以上工业企业分行业综合能源消费量(2018年)
陕西省西安市2019统计年鉴数据:11-29 果品加工、销售及生产服务情况(2018年)

6.农产品加工厂 7.其它 九、按销售区域分(吨) 1.国内市场 2.国际市场 附记:累计建成绿色果园面积(亩) 建成有机果园面积面积(亩)
销售及生产服务情况(2018年) Processing, Sales and Production Service(2018)
5
73002650700540001265
3300
19
77
36
13
86
2
4
5
445
13
167
5
82
9
5
4
74
156
289
4
6
61808
61550
54106
72546
147600
29760
12000
16232
20500
118000
19040
11000
39906
15500
568
300
4500
3050
304
11-29 果品加工、销售及生产服务情况(2018年) The Situation of Fruit Processing, Sales and Production Service(2018)
指标
一、果品加工企业数(个) 其中:苹果加工企业数量 猕猴桃加工企业数 二、果品加工企业果汁加工能力(吨)
其中:苹果汁加工能力 三、当年果品加工企业鲜果消耗量(吨)
其中:加工消耗苹果数量 加工消耗猕猴桃数量 四、仓储能力(吨) 其中:气调库 机械库 五、果业合作(个) 六、果苗木繁育中心(个) 七、果业服务投入(万元) 1.技术培训投入 2.科研投入 3.生产技术指导投入 八、果品销售方式(吨) 1.产品批发市场 2.采供商 3.专卖、直销店 4.超级市场 5.电子商务
陕西省西安市2019统计年鉴数据:9-14 市区及县市政设施水平(2018年)

指 标
Item
一、人均日生活用水量(升)
二、供水普及率(%) 三、燃气普及率(%) 四、人均城市道路面积(平方米) 五、建成区排水管道密度
(公里/平方公里) 六、污水处理率(%) 七、园林绿化
(km/sq.km) Rate of Sewerage Disposal (%) Afforestation and Parks and Gardens
Per Capita Public Green Areas (sq.m) Rate of Green Areas in Developed Areas(%) Rate of No Harm Disposal of Garbage (%)
人均公园绿地面积(平方米) 建城区绿地率(%) 八、生活垃圾无害化处理率(%) 注:本表数据来源于市建委。 本表数据含西咸新区。
Per Capita Daily Consumption of Tap Water For Residential Use (liters)
Water-Consuming Popularization (%) Gas-Consuming Popularization (%) Per Captia Area of Roads (sq.m) Density of Drainage Pipelines西安 Xi'an
189.56
97.85 99.90 17.97
7.88
93.85
9.97 35.23 98.97
市区 Urban
191.02
蓝田 Lantian
陕西西安市社会经济发展统计年鉴指标数据:2-5 按国民经济行业分产业活动单位数(2018年)

(2018) 纺织业 纺织服装、服饰业 皮革、毛皮、羽毛及其 制品和制鞋业 木材加工和木、竹、藤、棕、 草制品业 家具制造业 造纸及纸制品业 印刷和记录媒介复制业 文教、工美、体育和娱乐 用品制造业 石油、煤炭及其他燃料 加工业 化学原料和化学制品制造业 医药制造业 化学纤维制造业 橡胶和塑料制品业 非金属矿物制品业 黑色金属冶炼和压延加工业 有色金属冶炼和压延加工业 金属制品业 通用设备制造业 专用设备制造业 汽车制造业 铁路、船舶、航空航天 和其他运输设备制造业 电气机械和器材制造业 计算机、通信和其他 电子设备制造业 仪器仪表制造业 其他制造业 废弃资源综合利用 金属制品、机械和设备修理业(四)电力、热力、燃气及水的生产供应业 电力、热力生产和供应业 燃气生产和供应业 水的生产和供应业(五)建筑业 房屋建筑业 土木工程建筑业 建筑安装业 建筑装饰、装修和其他建筑业(六)批发和零售业 批发业 零售业(七)交通运输、仓储和邮政业 铁路运输业 道路运输业 水上运输业 航空运输业 管道运输业 多式联运和运输代理业 装卸搬运和仓储业 邮政业(八)住宿和餐饮业 住宿业 餐饮业(九)信息传输、软件和信息 技术服务业 电信、广播电视和 卫星传输服务 互联网和相关服务 软件和信息技术服务(十)金融业 货币金融服务 资本市场服务 保险业 其他金融业(十一)房地产业 房地产业(十二)租赁和商务服务业 租赁业 商务服务业(十三)科学研究和技术服务业 研究与试验发展 专业技术服务业 科技推广和应用服务业(十四)水利、环境和公共设施 管理业 水利管理业 生态保护和环境治理业 公共设施管理业 土地管理业(十五)居民服务、修理和其他服务业 居民服务业 机动车、电子产品和日用产品修理业 其他服务业(十六)教育 教育(十七)卫生和社会工作 卫生 社会工作(十八)文化、体育和娱乐业 新闻和出版业 广播、电视、电影和 录音制作业 文化艺术业 体育 娱乐业(十九)公共管理、社会保障和社会组织 中国共产党机关 国家机构 人民政协、民主党派 社会保障 群众团体、社会团体和 其他成员组织 基层群众自治组织(二十)国际组织 国际组织。
陕西省西安市2019统计年鉴数据:14-4 施工总承包和专业承包建筑业企业主要指标(2018年)

三、按隶属关系分 中央 地方
四、按企业资质等级分 1.施工总承包
#特级 一级 二级 2.专业承包 #一级以上 二级
Grouped by Administrative Relationship Central Region
Grouped by Class of Enterprises Overall Contractor for Construction Special Class First Class Second Class Special Contractor First Class Second Class
6
125170
465
14812799
360
21527879
180
1914242
193
1002265
826
359910 433684
35794 28263
970
301685 386305
25518 26843
61786
372805 674063
80576 36201
56 1142
19081024 20176161
Construction Enterprises
(person)
建筑业企业期末 从业人员数(人)
The Number of Employees in
Construction Enterprises at the End of Period
(person)
39257185
857651
740351
利润总额 (万元)
14-4 施工总承包和专业承包建筑业企业主要指标(2018年) Major Indicators of General Construction Contractors and Professional Contractor
陕西省西安市2019统计年鉴数据:4-12 城镇非私营其他经济类型单位从业人员情况(2018年)

平均人数 Average Employment
在岗职工合计 Staff
and Workers
408919
1016257
102491
1115410
1017558
1103043 6778 382
399947 3227 175
1001595 6223 351
101448 555 31
1099900 6763 382
2707
2707 12633
6113 7532 1172
4719 18654
8368 14309
2673
13 2331
153 1108
34
5024 20914
8318 15028
2715
5010 18653
8166 14034
2681
( person)
其他从业人员 Other Employed
Persons 97852
#企业
Enterprises
事业
Public Institutions
机关
Government Units
二、按国民经济行业分组
Grouped by Economic See ,Forestry,Animal Husbandry and Fishery
(二)采矿业
Mining
(三)制造业
Manufacturing
(四)电力、燃气及水的生产供应业
Production and Distribution of Electricity,Gas and Water
(五)建筑业
Construction
(六)批发和零售业
Wholesale and Retail Trades
陕西省西安市2019统计年鉴数据:16-1 主要年份社会消费品零售额(1978-2018)
207.96
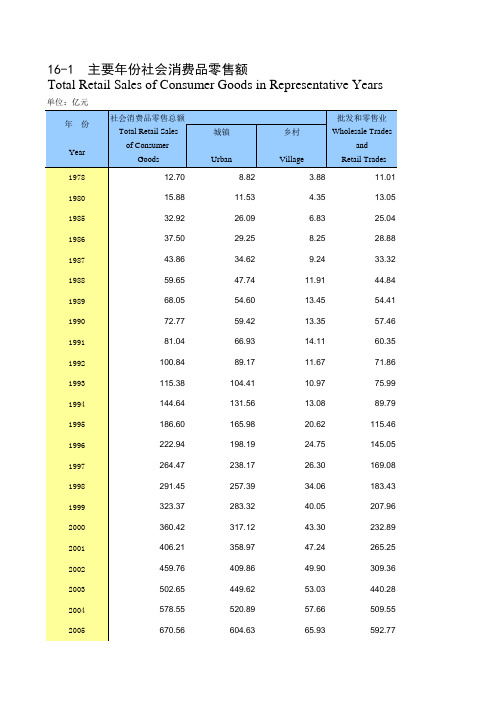
2000
360.42
317.12
43.30
232.89
2001
406.21
358.97
47.24
265.25
2002
459.76
409.86
49.90
309.36
2003
502.65
449.62
53.03
440.28
2004
578.55
520.89
57.66
509.55
2005
670.56
67.13
1497.71
2011
2039.24
1968.41
70.83
1825.79
2012 年 份
Year 2013
2400.67 社会消费品零售总额
Total Retail Sales of Consumer Goods 2742.89
2326.84
73.83
2156.49
按销售单位所在地分 By Location of Establishments
16-1 主要年份社会消费品零售额 Total Retail Sales of Consumer Goods in Representative Years
单位:亿元
年 份 Year
社会消费品零售总额 Total Retail Sales of Consumer Goods
城镇 Urban
乡村 Village
604.63
65.93
592.77
2006
784.95
708.31
76.64
694.03
2007
936.21
845.59
陕西省西安市2019统计年鉴数据:10-6 生活及其他污染情况(2018年)

指 标 一、基本情况 1.生活天然气消费量(万立方米) 2.生活用水总量(万吨) 二、污染排放情况 1.城镇生活污水排放量(万吨) 2.生活污水处理量(万吨) 3.生活CDD产生量(吨) 4.生活CDD排放量(吨) 5.生活氨氮产生量(吨) 6.生活氨氮排放量(吨) 7.二氧化硫排放量(吨) 8.氨氮化物排放量(吨) 9.烟尘排放量(吨) 注:本表数据来源于市环保局。2018Biblioteka 104990 100803
85137 81731 330531 24215 29981
2382 32232
5580 23463
他污染情况(2018年) n and Other Conditions (2018 )
Item Basic Condition
Volume of Living natural gas consumption (10 000 cu.m) Volume of Living water (10 000 tons) Discharge of Pollutant Volume of Urban Domestic Sewage Discharged( 10 000 tons) Volume of Domestic Sewgae Disposal(10 000 tons) Volume of Life CDD production (tons) Volume of Life CDD emissions (tons) Volume of Ammonia and Nitrogen in Urban Domestic Sewage Produced (tons) Volume of Ammonia and Nitrogen in Urban Domestic Sewage Discharged (tons) Volume of Domestic and Other Sulphur Dioxide Emission (tons) Volume of Ammonia and Nitrogen in Urban Domestic Sewage Discharged (tons) Volume of Soot Emission (tons)
陕西省西安市2019统计年鉴数据:10-2 主要年份工业“三废”排放及处理利用情况(2000-2018)
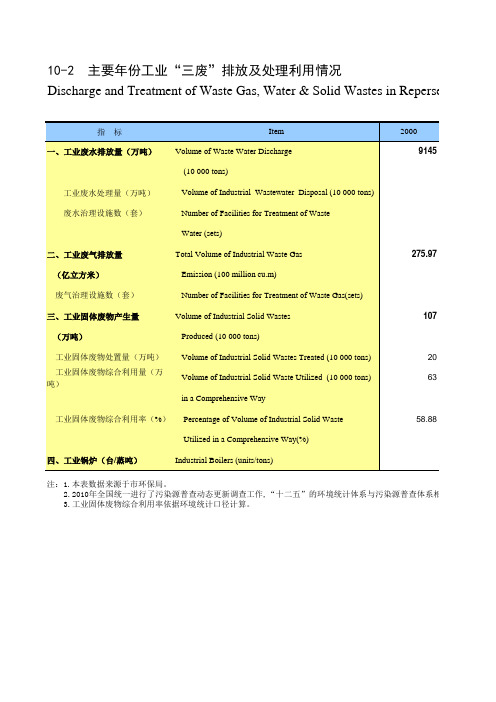
工业固体废物综合利用率(%) Percentage of Volume of Industrial Solid Waste
275.97
107 20 63
58.88
四、工业锅炉(台/蒸吨)
Utilized in a Comprehensive Way(%) Industrial Boilers (units/tons)
745
649
661
740
801
279
259.14
255.78
252.66
238.53
3.56
6
9.24
9.68
17.54
20.95
262
271
248.58
244.08
233.52
216.64
98.05
97.3
95.92
95.43
92.43
90.82
503/8785 576/13466 520/14177 501/18278 源普查体系相衔接,与“十一五”环境统计口径不同。
83.97
59.5
480/12791.8 457/14682.3 466/17078.21
二、工业废气排放量
Total Volume of Industrial Wasteillion cu.m)
废气治理设施数(套)
Number of Facilities for Treatment of Waste Gas(sets)
三、工业固体废物产生量
2016 4029.83
2017 4247.57
2018 4163.4
4264.99 266
4448.08 275
4091.1 299
- 1、下载文档前请自行甄别文档内容的完整性,平台不提供额外的编辑、内容补充、找答案等附加服务。
- 2、"仅部分预览"的文档,不可在线预览部分如存在完整性等问题,可反馈申请退款(可完整预览的文档不适用该条件!)。
- 3、如文档侵犯您的权益,请联系客服反馈,我们会尽快为您处理(人工客服工作时间:9:00-18:30)。
单位:吨标准煤
总 计
Total
煤炭开采和洗选业
Coal Mining and Dressing
石油和天然气开采业
Petroleum and Natural Gas Extraction
黑色金属矿采选业
Ferrous Metals Mining and Dressing
有色金属矿采选业
Nonferrous Metals Mining and Dressing
非金属矿采选业
Nonmetal Minerals Mining and Dressing
开采专业及辅助性活动
Mining Professional and Auxiliary Activity
其他采矿业
Other Mining Industry
农副食品加工业
Agricultural Products and Non-stable Food
Processing Industry
食品制造业
Food Production
酒、饮料和精制茶制造业
Wine, soft drinks and refined tea industry
烟草制品业
Tobacco Processing
纺织业
Textile Industry
纺织服装、服饰业
Textile, apparel industry
皮革、毛皮、羽毛
Leather, Fur, Feather (eiderdown) and Their
及其制品和制鞋业
Products Industry
木材加工和木、竹、藤、棕、
Timber Processing,Bamboo,Cane,Palm Fiber
草制品业
and Straw Products
家具制造业
Furniture Manufacturing
造纸和纸制品业
Papermaking and Paper products
13-5 规模以上工业企业分行业综合能源消费量(2018年)
Comprehensive Energy Consumption by Sector above Designated Size(2018)
行 业
Scetor
印刷和记录媒介复制业
Printing,Record Medium Reproduction
文教、工美、体育和
Culture, education, Craft art, sports and entertainment
娱乐用品制造业
goods manufacturing industry
石油、煤炭及其他燃料加工业
Petroleum,Coking and Other Fuel
化学原料和化学制品制造业
Raw Chemical Materials and Chemical Products
医药制造业
Medical and Pharmaceutical Products
化学纤维制造业
Chemical Fiber
橡胶和塑料制品业
Rubber and plastic products industry
非金属矿物制品业
Nonmetal Mineral Products
黑色金属冶炼和压延加工业
Smelting and Pressing of Ferrous Metals
有色金属冶炼和压延加工业
Smelting and Pressing of Nonferrou Metals
金属制品业
Metal Products
通用设备制造业
General Equipment Manufacturing Industry
专用设备制造业
Special Purpose Equipment
汽车制造业
Automotive Manufacturing
铁路、船舶、航空航天和
Railroad, marine, aerospace and other transportation
其他运输设备制造业
equipment manufacturing
电气机械和器材制造业
Electric Equipment and Machinery
计算机、通信和其他电子设备制造业
Communication Equipment, Computer and
Other Electronic Equipment Manufacturing Industry
仪器仪表制造业
Instrument manufacturing industry
其他制造业
Other manufacturing
废弃资源综合利用业
Comprehensive utilization of waste resources
金属制品、机械和设备修理业
Metal products, machinery and equipment repair industry
电力、热力生产和供应业
Electric Power, Heating Power Generating
and Supplying Industry
燃气生产和供应业
Gas Mining and Supplying Industry
水的生产和供应业
Water Processing and Supplying Industry
(ton of SCE)
比上年增长(%)
Increase over
Preceding Year
(%)
6746859-3.4
3071663.2
175748-6.0
956510.3
79340-0.8
4258-15.5
31690-1.1
8633.6
772-1.6
4994-47.1
409624.6
16105-6.1
)
d Size(2018)
2018
26147-0.3
2799101.6
16504-14.2
1106998-3.3
51991-0.4
488874.6
595284.3
352337-8.8
857440.6
48012-8.4
26258-0.1
206650.5
28283-1.2
200276-1.6
16491-6.7
142423-1.2
3051044.7
450614.6
139242.1
3675.2
234-10.1
3786083-4.6
3388438.8
148854.2