基于LabVIEW的双通道虚拟示波器设计
【完美升级版】基于LabVIEW的虚拟示波器的设计_毕业论文设计
基于LabVIEW的虚拟示波器的设计毕业论文摘要虚拟仪器是现代测量技术和计算机技术相结合的产物,标志着自动测试与电子测试仪器领域技术发展的一个崭新方向.随着信息技术和计算机技术的高速发展,数字信号处理作为一门新兴的学科,其重要性日益在各个领域的应用中体现出来。
本文介绍了利用LabVIEW 图形编程语言进行虚拟仪器开发的方法,设计了一种基于PC机声卡的虚拟示波器,说明了虚拟仪器在现代测试领域中的重要地位以及其广阔的发展前景.从某种意义上说,“软件就是仪器”。
关键词LabVIEW,虚拟仪器,示波器The design of virtual wave displayer based onLabVIEWAbstractVirtual instrument is the produce that merges the computer technology and measurement technique.It stands for a brand new development directory in the field of auto-measurement and electronic measurement。
With the rapid development of information technology and the computer technology, the digital signal processing takes an emerging discipline, its importance displays day by day in each domain application. This article introduces how to develop virtual instruments using graph programming language-LabVIEW ,designs a virtual signal displayer based on PC and explains the important part and wide development prospects of virtual instrument in modern measurement technique field.In a sense, “The sof tware is an instrument”.Keywords LabVIEW, virtual instrument目录第1章绪论 (1)1.1 虚拟仪器的概述 (1)1.1.1 什么是虚拟仪器 (1)1.1.2 虚拟仪器的构成 (2)1.1.3 虚拟仪器的优点 (3)1.1.4 虚拟仪器的发展现状 (4)1.1.5 虚拟仪器的发展趋势 (4)1.2 图形化编程语言LabVIEW (4)1.2.1 什么是LabVIEW (5)1.2.2 LabVIEW的主要特点 (5)1.2.3 LabVIEW调试与运行 (6)第2章示波器的原理 (7)2.1 模拟示波器 (7)2.1.1 示波器的基本结构 (7)2.1.2 示波器的扫描原理 (8)2.2 数字示波器 (9)2.2.1 数字示波器的基本原理 (9)2.2.2 数字示波器的特点 (11)2.3 虚拟示波器 (12)第3章系统的硬件设计 (14)3.1 声卡 (14)3.1.1 声卡的工作原理 (14)3.1.2 声卡的基本结构 (14)3.2 硬件设置 (16)3.2.1 实验中声卡的参数设置 (16)3.2.2 虚拟示波器中声卡的连接方式 (16)3.3 前置运算电路 (17)第4章系统的软件设计 (18)4.1 虚拟示波器工作流程图 (18)4.2 数据采集模块 (18)4.3 频谱分析模块 (22)4.4 数据测量和显示模块 (23)第5章系统调试与程序显示 (25)5.1 虚拟示波器性能 (25)5.1.1 程序设计思路 (25)5.1.2 虚拟示波器操作界面 (25)5.1.3 虚拟示波器总程序框图 (26)5.2 虚拟示波器波形显示 (27)结论 (30)致谢 (31)参考文献 (32)附录 (34)第1章绪论1.1虚拟仪器的概述虚拟仪器是计算机技术和传统的仪器仪表技术相结合的产物,它是在以计算机为核心的硬件平台上,由用户设计和定义其功能,具有虚拟面板. 虚拟仪器技术具有高效、易用、开放、灵活、更新快、功能强大、性价比高、用户定义等诸多优点. 目前在我国应用的虚拟仪器开发平台主要有美国NI公司的LabVIEW及其相应组件和Agilent公司的HP - VEE ,其中NI的LabVIEW系列产品在我国使用比较广泛.LabVIEW是当前用于数据采集、信号处理和虚拟仪器开发的一个标准工具,而且是一个基于图形化编程语言的虚拟仪器软件开发工具,设计者可利用它方便快捷地建立自己的虚拟仪器程序而无需复杂的程序代码编写. 它适用于多种操作系统,用LabVIEW设计的虚拟仪器程序可以脱离LabVIEW开发环境,最终用户看见的是和实际的硬件仪器相似的操作面板1.1.1什么是虚拟仪器所谓虚拟仪器,就是在通用计算机为核心的硬件平台上,由用户设计定义、具有虚拟面板、测试功能由测试软件实现的一种计算机仪器系统。
基于LabVIEW的虚拟双踪示波器的设计外文翻译

基于LabVIEW的虚拟双踪示波器的设计外文翻译外文文献A DAQ card based mixed signal virtual oscmoscopeAbstractComplex signals find many applications in SONAR, RADAR,Echo Location Systems and for studying the resonant frequencies. Digital StorageOscilloscopcs(DSO) is used these days for acquisition and display of routine signals. This instrument, found in every measurement laboratory, though potent in displaying simple periodic waveforms like sinusoids fails when frequency-varying time signals are applied, This problem surfaces because the underlying technique of oscilloscope used to trigger the waveform does not acquiesce with complex signals like chirp. Ready solution to this problem is the mixed signal oscilloscope. This is a costly solution and small laboratories cannot afford to have the costly instruments. In this paper, a cost effective DAQ card based mixed signal virtual 0scilloscope is proposed to study the complex signals. An intelligent technique, Weighted Hamming Distance (WHD) algorithm was used to accurately trigger the complex waveforms. Also for frequency domain analysis, Joint Time Frequency Analysis(JTFA) techniques were used. A LabVlEW'TM based virtual instrument was designed and developed with a capability to acquire, display and analyze the triggered signal. The integrated programming language LabVIEWTM was chosen as it offers many simple ready to use functions. In a way the proposal offers a cost effective, fast and flexible solution to treat the complex signals. The need to createsuch solutions is the consequence of costly hardware systems. The deficiency of conventional hardware. Scheme for the virtual oscilloscope for complex signals with some real time experimental results are presented in this work.Kevywords: Virtual instrumentation,Chirp signal,Data acquisition,Triggering, Complex signals, JTFA1.IntroductionFor the last two decades there has been a tremendous progress in computer technology. Measurement domain is no longer left unaffected. The way measurements are being done is totally revolutionized. Computer based measurement or say virtual instrumentation is gradually replacing the costly bench 1top instrumentation as it offers flexible,fast and cost effective solutions. Various classical instrumentation systems namely Oscilloscope, Multimeters and Spectrum analyzers ect. are almost phased out by their counter part virtual instrumentation. Our research extends the trend and demonstrates the developmen of the computer based mixed signal digital oscilloscope.Conventional signals such as the sinusoids have a constant frequency and the amplitede only varies with time throughout the signal definition. On the other hand, complex signals can be defined in this context as signals in which all the parameters vary. Fig.1 shows a typical complex signal i.e. Linear Chirp.Variation of amplitude and frequency with time can easily be understood by having a look at the signal. This requires a visually stable display of signal. The complex signal offers challenges f'or acquisition, display an analysis. Even the conventional modernage DSO is not capable of displaying and analyzing complex signals because these instruments employ simple triggering technique like level trigger. The conventional technnique of voltage trigger apparently fails when complex signals like chirp are analyzed on DSO. This is due to the very fact that these instruments consider chirp as a conventional sine wave and trigger for each cycle of the sine wave instead of triggering for the complete chirp cycle. This analysis of the chirp signal as several sine waveforms of different frequencies leads the DSO to display them as sinusoids in quick succession. As this rapid change occues at a very high rate and because of human eye not registering events occurring faster than 1/20th of a second the display appears as several overlapped sine waves. In the recent work[1], a new triggering technique was proposed for the complex signals based on WHD. Subsequent sections present the solution to the problem. For analysis of the complex signals in frequency domain JFFA technique is utilized and implemented[2-6].DSO uses the level trigger to display the waveform applied to it. This leads to trigger interval and the number of samples for this trigger interval is computed and these numbers of samples are display. The DSO considers the interval as the fundamental time period of the whole waveform and thus takes tbat much samples from its buffer and starts displaying it in quick succession. With simple waveform like a sine wave, level trigger can achieve stable display because trigger interval contains same number of cycles. This is shown in Fig. 2a.23Now for the complex signal as shown in Fig.2b, leveltriggering produces a trigger interval having variable number of cycles for the same number ofsamples/time resulting in a visually unstable display.The actual trigger interval should be one complete cycle for a chirp signal as indicated in Fig. 2c. Having done this the repeated chirp signal for this time duration will be displayed without any overlapping components as long as the entire time period is displayed.To observe the shortcomings experimentally in display of complex signals on the oscilloscope T ektronix dual channel signal generator AFG-3022 (250 MS/s, 25 MHz) was used to generate a chirp signal by choosing the sweep mode to sine waveform with its frequency varying linearly with respect to time. This signal was fed to TektronixTDS-2022 (2 GS/s, 200MHz) dual-channel DSO. The overlapping display as shown in Fig. 3 was observed.2. Intelligent method of triggeringAccurate triggering lies solely on correct identification of the time period of waveform under consideration. For this purpose, pattern recognition scheme was implemented to identify the pattern in the signal [1] and thus obtain the time period of one complete cycle of the chirp. First, a fixed number of samples N are taken as reference pattern. Then the signal is shifted by one sample to form the test pattern. This pattern is then tested for its closeness' to the reference pattern. Closeness' can be defined as the distance by which test pattern is away from reference pattern.WHD is used as the decision function for closeness. Hamming distance is defined for two binary vectors as the number of different' bits are given their vectors. InWHD the different bits are given their binary weightingaccording to the bit position45and their weights according to the bit position and their weights are summed up. WHD of two binary n bit number x and a is given byIf X and A are two binary vectors of n-bits element, then WHD for these two vectorsis computed by summing up the element by element WHD and is given byFor a vector of dimension N, the samples are shifted N times and its closeness is computed at each shift.When these computations are done, the difference 洫in the signals is found to be minimum (ideally zero when no noise) when the cycle repeated itself. Following are the major steps involved and implemented for intelligent trigger mechanism.1. Acquiring the long enough signal using DAQ card and to convert the decimal values of samples into binary form.2.A fixed number(N) of binary samples are stored in array. The stored samples are shifted by a fixedc number of samples, n (=1,inthis case).3. The original saved samples and the shifted samples are XORed bit-by-bit.The result is then multiplied by a factor of 2, where I represent the position of bit.4.The summation of all the resulting values gives the WHD for nth shifts.65.A plot of WHD vs. n is made and the minimum is calculated by peak detection method. The difference between two successive minima is the trigger interval in number of samples.6. The number of samples multiplied by the sampling rate results in trigger interval (in seconds).As a test case WHD algorithm is implemented for the following triangular waveforrn in Fig.4.The waveform is sampled at 8 points per eycle. Each sampled value is 3 bit length.The step by step implementation is given below.WHD waveforrn is plotted using WHD(1), WHD(2), …, WHD(8), and the location of the minima gives the triggering interval. Fig.5 shows the WHD waveform also clearly indicating the trigger interval at 8th sample.The WHD VI(Fig.6) was developed for this task. It takes the waveform, whose triggering interval is to be found, and the no of samples, on which computation is to be done, as input and outputs the sample at which minima occurs along with the value of minima and the WHD waveform. For typical chirp signal WHD waveformis obtained as shown in Fig.7. The number of samples between two consecutive minima is equal to the number of samples in one cycle of the waveform. The product of the number of samples with the sampling interval is the triggering interval of the input signal. Thus, the virtual instrument could also display complex waveformswith considerable aese. Fig.7 shows triggering interval of 5 cycles.3. Frequency domain analysisFor simple signals the frequency analysis is performed by traditional tools like FFT. For such signals the Fourier Transform works well as their frequency components remain constant throughout the signal existence and hence there is no need forthe time-frequency relationship. In case of complex signals the frequency varies with time. FFT fails to analyze these signals as it gives information about thefrequency and its amplitude. Time information is lost.78In order to overcome this difficulty, there are JTFA tools iike Short TimeFourier Transform(STFT) and Wavelet Transform. These are implemented for the signals under consideration.The STFT is a modified form of Fourier Transform. In this technique the signal is rnultiplied with a window function and their product's Fourier Transform (2).The main principle behind this technique is that the window function(w) breaks down the signal into segments of small finite durtion. The frequency component of the signal during this segment is assumed to be constant. By computing the Fourier Transform for this segment the frequency vs. amplitude information is obtained. Then the window is moved to another segment by a step having the same duration as the previous one giving the frequency component for that segment. Thus the frequency for different time intervals gives time-frequency relationship.However, there is a disadvantage with this tecnique. The size of the window function used is fixed, thus STFT will have same resolution for low and high frequencies. Resolution is the certainty by which one can determine time or9frequency information. It is generally seen that a larger window leads to better frequency resolution and a small windowleads to better time resolution. Thus, it depends upon the user whether he wants frequency or time resolution. Even if there is a need for change of resolution, the user has to do the same manually.To overcome the resolution problern, a more advanced technique called Wavelet Transform is used these days. In this the window size can be altered, using a scalingparameter a. The equation for Wavelet Transform is given as wherea is the scaling parameter,b is the translation parameter,x(t) is the signal to beanalyzed andis the wavelet functionThe wavelet function <(t) is known as the mother wavelet .Its scaled and time shifted versions are known as the daughter wavelets. These daughter wavelets having varying size offer different frequency and time resolutions at different frequencies. The scale parameter a represents the freequency component in an inverse relation. Thus the valuc of scale is inversely proportional to frequency component.Initially the wavelet function has scale a=1 and is placed at the starting of the signal. The wavelet transform and thus the frequency component of that segment. Then the wavelet function is moved by b steps and the wavelet transform is computed for that segment. This procecdure is continued till the end of the signal. Thus Wavelet transform for a=1 and all the time steps till the end of signal getscomputed. Similarly the wavelet function is again placed at the start of the signal but with changed value of scale a. Theprocedure is continued till the Wavelet transform for each scale and time step combination has been computed.It can be observed that the computation of Wavelet Transform leads to a lot of redundancy.To reduce the redundancy, the scale values and the time steps can be linked using dyadic sampling. a= 2" and b=k 2' where n and k are integers. This leads to reduction in redundancy. This is called Discrete Wavelet Transform(DWT).4. ImplementationA DAQ card based virtual instrument was designed and developed inLabVIEW TM programming environment. This virtual instrument has the capability to generate intelligent software trigger as described above for complex waveforms like chirp. The main decisionns during design of the virtual instrument are: choosing the data acquisition card and, what is equally important, choosing the set of features the instrument should offer. The choice of the data acquistion card has a great influence on the efficiency of the whole instrument[7,8].Particular DAQ cards are differentiated by price and, the specification it offers.A low cost NIPCI-6035E, 16bit, 200KS/s card was chosen. The hardware was programmed at maximum sampling rate. A separate problem is designing software, which, in that case, is the main part of instrument design phase. The major features of the developed virtual instrument are:The capability to acquire and process simple and complex waveforms.Dual channel mode: The instrument is capable of displaying two inputs simultaneously and can perform simple mathoperations between the two.Auto set: Runs the WHD code to re-compute the trigger interval for the new signal and thus achieve a stable display. In case, the two inputs do not have the same frequency, the LCM of the trigger intervals of A and B is found to so that integral number of cycles of both the channels can be shown simultaneously.Time domain measurements: The signal being displayed in time domain are measured on various parameters-Amplitude-Peak to peak-Mean(DC)-RMS101112Fig. 9. The results of wavelet transrorm implemented in the virtual instrument. (Channel A analyzing sine signal and Channel B analyzing a chirp signal). Frequency Domain Aalysis: The plot of Magnitude vs. frequency, Phase vs. frequency and the facility to choose the windowing function.STFT based Joint Time Frequency Analysis (JTFA): The spectrogram with the additional choices of the plotting the graph with scale in decibels, windowing functions and the window length for STFT analysis.Wavelet based Joint Time Frequency Analysis(JTFA):The scalogram which plots scales vs. time steps, choice of time-frequency sampling parameters like time steps and scales and the choice of wavelet functions.For the frequency domain analysis, DSP toolkit available withLabVIEW softwarewas utilized. Standard functions are available in the toolkit. The virtual instrument thus developed is intelligent as it takes different actions with different signals contrary to a digital storage oscilloscope. Trigger implemented enables us to obtian the correct value of the time period and a stable display. Analysis of complex signals can also be performed using this instrument. Fig.8 shows the front Panel of the virtual instrument showing Time-domain measurements. Fig.9 shows the time frequency relationship on both the channel B analyses the chirp signal. As seen clearly the chirp signal shows the varying frequency with time.5. Limitations of developed virtual instrumentSamples for few cycles are required to determin the triggering interval. One need to optimize tbe appropriate sampling rate and the number of samples to be processed. The processing time taken by the WHD technique is directly proportional to the number of samples and hence to the sampling rate as the higher sampling rate leadsto the more number of samples per cycle. The time required to compute trigger also depends upon the speed of the computing system. For large amount of data (if high sampling rates us fixed), computationally heavy WHD algorithm and other features for more analysis, the butter might overflow leading to loss of data. Every time the input waveform is changed user has to do retriggering.6. Conclusion and discussionSuccessful development of the virtual instrument with the capability of acquiring, displaying and analyzing complex signals is done. The instrument over comes the shortcomings of theDSOs, found commonly in laboratories, in achieving stable display for complex signals. The developd instrument is cost effective and flexible in nature and had the large number of features to choose from. The computer towards the measurement systems. The VI developed is expected to go a long way in the instrumentation area.1314 基于混合信号的数据采集卡的虚拟示波器摘要:复杂的信号在声纳、雷达、回声定位系统和谐振频率的研究中有多种应用。
「基于LABVIEW的虚拟示波器设计—虚拟示波器」

「基于LABVIEW的虚拟示波器设计—虚拟示波器」虚拟示波器是一种通过计算机软件来模拟传统示波器的工作原理和功能的设备。
它可以用于信号的检测和分析,具有方便、灵活、实时性强等优点。
本文将介绍基于LABVIEW的虚拟示波器设计。
LABVIEW是由美国国家仪器公司(National Instruments)开发的一种基于图形化编程的开发环境。
它可以实现快速的数据采集和处理,适用于各种工程应用。
借助LABVIEW的强大功能,我们可以设计出一个功能完善的虚拟示波器。
首先,我们需要从外部设备中获取信号。
LABVIEW支持多种类型的数据采集设备,如数据采集卡、传感器等。
我们可以通过连接这些设备,将信号输入到LABVIEW中。
LABVIEW提供了丰富的数据采集和处理函数,能够方便地获取并处理输入信号。
接着,我们需要设计一个用户界面,用于显示信号和调节示波器的各个参数。
LABVIEW中提供了多种界面控件,如图表、调节器等。
我们可以根据需要,在用户界面中添加这些控件,并设置相应的属性。
通过LABVIEW的可视化编程方式,我们可以直观地完成用户界面的设计。
在信号显示方面,虚拟示波器需要能够实时地显示输入信号的波形。
LABVIEW提供了图表控件,可以用于显示波形图。
我们可以将获取到的信号数据传递给图表控件,然后设置相应的显示参数,如坐标轴范围、背景颜色等。
这样,用户就能够清晰地看到输入信号的变化。
除了实时显示信号波形外,虚拟示波器还应具备其他功能,如调节触发电平、选择触发方式等。
LABVIEW中提供了丰富的函数库,可以方便地实现这些功能。
我们可以通过在用户界面中添加调节器、开关等控件,并将其与相应的函数进行关联,从而实现示波器的各个参数的调节。
总之,基于LABVIEW的虚拟示波器设计具有很大的灵活性和可扩展性。
我们可以根据需求进行定制,实现更多功能,如频谱分析、数据存储等。
同时,LABVIEW提供了强大的数据处理和可视化功能,能够让我们更加方便地进行数据分析和结果展示。
基于LabVIEW的虚拟示波器的设计和实现
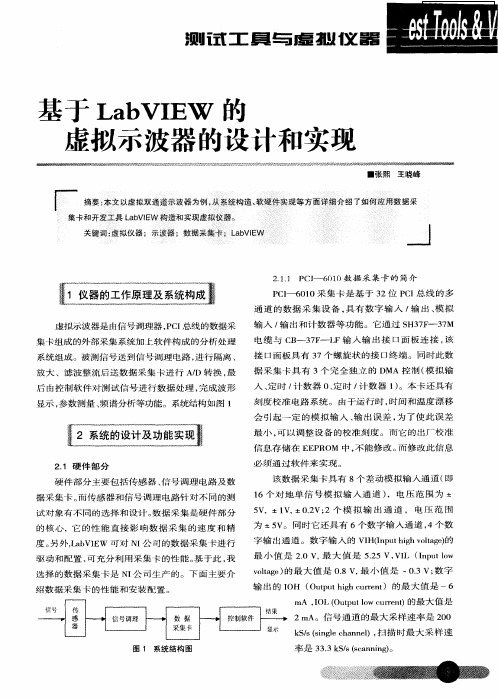
输 入 / 出和计 数 器等 功能 。它通 过 S 3 F 3 M 输 H 7- 7
电缆 与 c 一 3F L 输 入输 出接 口面板 连 接 , B 7— F 该 接 口面 板 具 有 3 7个 螺 旋 状 的 接 口终 端 。 同 时 此 数 据 采 集 卡 具 有 3个 完 全 独 立 的 D MA 控 制 ( 拟 输 模 入 、 时 / 数 器 0 定 时 / 数 器 1 。本 卡 还 具 有 定 计 、 计 ) 刻度校 准 电路 系统 。由于运行 时 , 间和温度 漂移 时 会 引起 一 定 的模 拟输 入 、 出误 差 , 了使 此 误差 输 为 最 小 , 以 调 整 设 备 的校 准 刻 度 。 而 它 的 出 厂 校 准 可
率 是 3 . k / ( a nn ) 33 Sss n ig。 c
维普资讯
JU式 工 具 与 虚 拟 仪 器 li l
2 12 cI 6 1 .. P 一 0 0数 据 采 集 卡 的 安 装
合 。 本 设 计 中 采 用 L b E .。 aVIW71 概括地讲 , 统软件 总体上 包括数 据采集 、 系 波
最 小 值 是 20V 最 大 值 是 52 V L (n u l . , .5V, I Ip to w vl g ) o ae 的最 大值 是 08V 最 小 值 是 一03V; 字 t . , . 数 输 出的 I H ( up t ihcret O O tu g urn )的最 大值 是 一6 h
纂 1仪器的工作原理及系统构成
w … … … … … … … ~ t … … r … H
PI 6 l c— 0 0采 集 卡 是 基 于 3 2位 P I 线 的 多 C 总 通 道 的 数 据 采 集 设 备 , 有 数 字 输 入 / 出 、 拟 具 输 模
根据labview的虚拟示波器设计

设计报告题目:基于labview的虚拟示波器设计学生姓名:学号:报告日期:2013, 6, 26成绩:评定老师:XX大学光电工程学院、设计目的:综合实用Labview知识,在本设计中使用了层叠式顺序结构、分支结构、循环结构等编程逻辑结构以及常见的数据结构,如簇、捆绑成簇等数据处理结构;同时还用到了波形生成控件VI、逻辑控件VI、数值控件VI等多个控件。
此外还创建了多个子VI,可以更好地掌握Labview编程的方法和技术。
二、设计要求:能够实现比较简单的双通道示波器功能,主要功能包括:输出波形显示(单通道输出波形显示或两通道输出波形同时显示);选择触发器极性(通道B触发、外触发EXT、正负极性触发等)并能设置触发电位;能进行水平分度和垂直分度的调节。
三、设计步骤:1、程序主要功能模块:该设计主要功能模块有:触发功能块、通道选择功能块、水平分度调节功能块、垂直分度调节功能块和波形显示功能块功能模块结构图:2、示波器前面板设计:(1)示波器图形控件:在前面板中选择波形图控件:期Express立本旦人揑件标尺设置:Expr亡齐用户.“数疽卮丁控禅指刊丁-pa酬显示揑件殊显睫枠图形釘昭用户控律逛融件…遁形图表Express XV图格式与精度设置:救直痂入控件按钮写开关(2)其他主要控件: 通道选择:運道A&B- ■卜前面板中选择垂直指针滑动杆控件:ExpressExpress,^ 户“.rm k l壬直指针滑动杆忙垂直填充滑… 垂直审针滑…BHmSU' E汀•匡业I标尺设置:文本标签设置:电平调节旋扭:电平在前面板中选择旋扭控件:Expresso i 10Express用户一於間懦'•I abu]丈本显示拄件芾边框題臺用戸挖愕卿控件“属性设置:数据输入设置:标尺设置: 常歳僚的屋性:电宰01匚想戢帖鞭和 SGfi?iS 53翟认赧■證*,标尺样Ft|~VI ■丄缸庭碇L|弓转I_. SSJSSk®□■碇忌示标兰啤宝性伴fcjisrrffi■kHB'9fttlt|佃1植思肖与吐显示格式:分度调节:n 走取肖 建吐水平分度调节文本标签设置:垂直分度调节文本标签设置:停止按扭属性: 操作设置:聞黄ffJStt :停止眞那5毎直£甘腹 甲壬EJB 康 住 TiEtSr 曰乞忆占艺三i 在和C3> ■3、 程序框图设计(1) 触发源功能块:触发源功能块的作用主要是利用触发源开关的选择和通道选择开关完成对示波器显示波形的 触发源的选择,如下图:源开关作为条件结构的选择项,当源开关处于“通道触发”时为真,此时斜率调节和电平调 节可用。
基于虚拟仪器的双通道示波器方案设计书

本科毕业设计(论文)题目:基于虚拟仪器的双通道示波器设计学号: 074821549 姓名:陈浩东班级: 07光电A2 专业:信息显示与光电技术学院:电子与电气工程学院入学时间: 2007年指导教师:张卫纲日期: 2011年 4月28日毕业设计(论文)独创性声明本人所呈交的毕业论文是在指导教师指导下进行的工作及取得的成果。
除文中已经注明的内容外,本论文不包含其他个人已经发表或撰写过的研究成果。
对本文的研究做出重要贡献的个人和集体,均已在文中作了明确说明并表示谢意。
作者签名:陈浩东日期:2011.4.28基于虚拟仪器的双通道示波器设计摘要摘要:虚拟仪器(简称VI)是电子测量技术与计算机技术深层次结合、具有良好发展前景的新一类电子仪器。
其核心思想是通过软件将计算机硬件与仪器硬件有机的结合,利用计算机的强大的数据处理能力,由用户根据软件定义的界面来操作计算机,完成对被测信号的采集、分析、处理、判断及显示等一系列功能,从而实现仪器的功能。
虚拟仪器的出现标志着自动测试技术与电子测量仪器技术进入一个崭新的发展时期,随着科学技术的发展,虚拟仪器将成为未来仪器的必然趋势。
随着测控技术、通信技术和计算机技术的飞跃发展 ,20世纪80年代提出的虚拟仪器技术也迅速发展起来.并且不断改进原有的测量技术,扩大虚拟仪器的测控功能和应用领域。
虚拟仪器的核心思想是“软件就是仪器”。
即利用强大的计算机资源使本来需要硬件实现的技术软件化,以最大限度地降低系统成本,增强系统功能和灵活性。
介绍一种虚拟双通道示波器的设计与实现过程。
该仪器是基于图形化编程语言LabVIEW8.2开发的,具有数据采集、波形显示、数据存储、回放测量、输出打印、网上传送等功能。
试验结果表明,该仪器工作性能稳定,测量精度高,功能可以不断扩展,而且人机友好界面清晰.适合不同层次的人员使用。
示波器是在科学研究和工程设计中广泛应用的一种通用仪器。
与传统的示波器相比,本研究设计的虚拟示波器主要具有以下优点:1)功能和性能指标可以扩展;2)操作面板简单清晰,初学者易掌握;3)具有强大的网络通信能力。
基于LABVIEW的虚拟示波器的设计
基于LABVIEW的虚拟示波器的设计概述示波器是一种用于测量和监测电信号的设备,它可以以图形方式显示信号的波形,也可以提供一些基本的测量功能,如测量信号的幅值、频率和相位等。
虚拟示波器是一种基于软件的示波器,通过计算机和特定的软件来实现测量和显示信号波形的功能。
本文将介绍基于LABVIEW开发的虚拟示波器的设计方案。
设计要求1.实时显示信号波形:虚拟示波器需要能够实时获取信号并以图形方式显示信号的波形。
2.支持多通道测量:虚拟示波器需要支持多通道测量,使用户可以同时监测多个信号波形。
3.提供基本的测量功能:虚拟示波器需要提供一些基本的测量功能,如测量信号的幅值、频率和相位等。
4.具备信号触发功能:虚拟示波器需要具备信号触发功能,使用户可以通过设置触发条件来捕捉特定的信号波形。
设计方案1.界面设计:虚拟示波器的界面应具备直观性和易用性,用户能够方便地进行操作。
界面可以包括波形显示区域、通道选择区域、测量功能区域和触发设置区域等。
2.数据采集和处理:虚拟示波器需要通过数据采集卡或其他的信号输入设备来获取信号,并通过LABVIEW提供的数据处理功能进行处理和分析。
3.实时波形显示:获取到的信号数据可以通过LABVIEW的图形绘制功能进行实时显示。
可以使用波形图控件或曲线图控件来显示不同通道的信号波形,并使用不同的颜色进行区分。
4.多通道测量:用户可以通过界面上的通道选择区域选择要监测的通道数,虚拟示波器会自动获取相应的信号并进行测量和显示。
5.测量功能:通过使用LABVIEW提供的测量VI,可以实现对信号的幅值、频率和相位等进行测量。
这些测量结果可以显示在界面的测量功能区域,方便用户进行查看和比较。
6.信号触发:用户可以通过界面上的触发设置区域设置触发条件,如触发电平、触发边沿和触发延迟等。
当信号满足触发条件时,虚拟示波器会捕捉到相关的信号波形并进行显示。
7.数据保存和导出:虚拟示波器可以支持将获取到的信号数据保存到文件中,以便用户进行后续的分析和处理。
虚拟仪器双通道模拟示波器
虚拟仪器课程设计报告题目:双通道虚拟示波器姓名:xxx学号:xxxxxxxx班级:测控xxx班指导教师:xxx.简介:虚拟仪器(VI-Virtual Instrument)是指通过应用程序将通用计算机与功能化硬件结合起来,用户可通过友好的图形界面操纵计算机,就像在操纵自己定义、自己设计的单个仪器一样,从而完成对被丈量的采集、处理、分析、判定、显示、数据存储等。
虚拟技术是飞速发展的产物,它正逐步取代传统的电子仪器,是现代电工电子仪器的发展方向。
虚拟仪器主要由数据采集、数据分析处理。
数据输出部分模块组成。
本次实验设计使用了LABVIEW 的各种课程知识(如分支、循环等常用编程逻辑结构;族、簇数组等常用数据结构;波形生成控件。
逻辑控件、数值控件等多个控件和自创建的多个子功能)利用LABVIEW 成功模拟了简单数字双通示波器的各种功能。
设计的虚拟示波器涉及的主要功能包括:双通道信号输入、触发控制、通道控制、时基控制、波形显示、参数自测量等。
本示波器的数据采集的功能与普通示波器一样,波形显示模式:通道 A 或B、A+B 及A-B 等。
经测试,本示波器可实现数据采集,并可对采集信号进行运算。
一.设计题目: 双通道虚拟示波器二.设计目的:(1)并掌握虚拟仪器的设计思想和方法(2)掌握Lab VIEW编程、调试等技能(3)学习“波形图”控件各种复杂功能的使用(4)学习数据采集卡的使用方法三. 实验目标:通过实验,初步了解虚拟仪器的概念,基本掌握labview 的操作方法,掌握各种控件和编程函数的用法。
以labview 为操作环境,创建示波器vi,能够对不同频率的输入信号进行清晰的输出波形显示(单通道波形输出显示或双通道波形输出显示)能够选择触发器极性,能进行水平和垂直分度的调节,并能够随时控制波形显示的停止与开始。
四.硬件设备(1)计算机(2)LabVIEW2013软件、NI-DAQ max(3)PCI-6221数据采集卡及接线盒图1五.设计注意事项:1.用DAQ-mx创建虚拟通道的时候,由于本设计是双路信号,应设计成双通道输出;同样在DAQ-mx Read设置中,同样需要选择双通道。
基于LABVIEW的虚拟示波器设计
基于LABVIEW的虚拟示波器设计虚拟仪器是一种使用软件模拟实际仪器功能的工具。
在近年来,随着计算机技术的快速发展,虚拟仪器在各种测量和控制领域的应用越来越广泛。
针对示波器这一重要的测试仪器,本文将介绍如何使用LABVIEW软件设计一个基于LABVIEW的虚拟示波器。
LABVIEW是一款由National Instruments公司开发的图形化编程环境,用于进行数据采集、仪器控制和数据分析等工作。
通过使用LABVIEW,可以轻松地实现各种虚拟仪器的设计和开发。
虚拟示波器是一种具有示波器功能的软件程序,通过采集和显示信号波形,用于检测和分析电路中的信号。
在进行虚拟示波器设计时,需要考虑以下几个关键因素:1. 数据采集:虚拟示波器需要能够采集外部信号并进行处理。
可以使用LABVIEW提供的数据采集模块,例如DAQmx模块,来实现数据的采集和处理功能。
2. 数据显示:虚拟示波器需要能够将采集到的数据以波形的形式显示出来。
LABVIEW提供了丰富的图形化控件,可以轻松实现波形显示功能。
通过使用Waveform Chart或Graph控件,可以将采集到的数据实时显示。
3. 触发功能:示波器通常具有触发功能,用于稳定地观察特定事件。
在虚拟示波器设计中,可以利用LABVIEW提供的Trigger模块来实现触发功能。
通过设定触发条件,可以实现稳定的波形观察。
4.配置选项:虚拟示波器需要提供一些常用的配置选项,例如时间和电压的刻度设置,波形颜色和线型的选择等。
可以使用LABVIEW提供的控件,例如数字输入框和下拉菜单,来实现这些配置选项。
基于以上几个关键因素,下面我们将详细介绍基于LABVIEW的虚拟示波器设计的具体步骤:步骤1:设置数据采集通道。
通过使用DAQmx模块,选择需要采集的数据通道,例如模拟输入通道或数字输入通道。
步骤2:创建界面。
使用LABVIEW的图形化工具,创建一个用户界面,包括波形显示区、触发设置区和配置选项区。
基于Labview的虚拟示波器设计-图文
基于Labview的虚拟示波器设计-图文数据采集卡接收的信号是范围很广的电压信号,如果太强,就需要衰减器把被测信号减弱后再输入给数据采集卡,这样一方面可以保证数据采集卡可以顺利采数,另一方面有利于系统的安全运行。
而对于微弱信号要进行放大,以提高分辨率和降低噪音,也使调理后信号的最大电压值和ADC最大输入值相等,这样可以提高精度。
在设定调理电路的放大或衰减倍数时,一般应满足这样一个条件:经调理后的信号其最大值应尽可能地达到数据采集卡可以接受的电压范围,最大限度地提高数据的准确度。
(2)隔离隔离是指使用变压器、光或电容祸合等方法阻碍被测系统和测试系统之间传递信号,避免发生直接连接,使用祸合主要有两个方面原因:一是从安全的角度把传感器信号同计算机隔离,因为被监测系统可能产生瞬时高压,另一个原因是隔离可以使从数据采集卡出来的数据不受地电位和输入模式的影响,减少误差。
(3)滤波滤波的目的是消除噪音信号,提高输入信号的信噪比。
噪音滤波器通常用于直流信号;交流信号通常需要抗失真的低通滤波器,因为这样的滤波器有一陡峭的截止频率,因而几乎能够完全消除高频干扰信号。
(4)激励由于电工测量试验中经常要要用到正弦波、方波等信号,且有时需要为一些传感器提供激励信号,故由虚拟信号发生器产生各种信号并由信号调理电路进行功率放大后输出。
(5)线性化很多传感器对被测量都有非线性响应,因而需要对输出信号进行线性化。
3数据采集硬件数据采集硬件与众多因素有关,要根据具体情况进行分析,下面是通用的特征:(1)采样频率采样频率高,就能在一定时间内获得更多的原始信息,见图4一1(a)所示。
为了再现原始信号,必须有足够高的采样频率。
显然,如果信号变化比采样板的数字化要快,或采样太慢,就会产生波形失真,见图4一1(b)。
根据采样定理,采样频率至少是输入最高频率的两倍,才可能不产生失真。
(2)采样方法要从多个通道得到数据,通常使用多路开关把每个信号端连接到A/D 转化器(ADC)。
- 1、下载文档前请自行甄别文档内容的完整性,平台不提供额外的编辑、内容补充、找答案等附加服务。
- 2、"仅部分预览"的文档,不可在线预览部分如存在完整性等问题,可反馈申请退款(可完整预览的文档不适用该条件!)。
- 3、如文档侵犯您的权益,请联系客服反馈,我们会尽快为您处理(人工客服工作时间:9:00-18:30)。
龙源期刊网 http://www.qikan.com.cn 基于LabVIEW的双通道虚拟示波器设计 作者:莫娇 等 来源:《价值工程》2013年第01期
摘要: 本文基于LabVIEW软件,采用模块化的设计思路,开发了双通道虚拟示波器。软件设计主要包含通道选择模块、时间和幅值分度调节模块、触发耦合模块、参数测量模块及信号发生模块。通道选择模块可以选择两个通道单独显示、两个通道同时显示以及两个通道叠加显示,时间和幅值分度调节模块可以分别调节示波器的时间分度和幅值分度。通过信号发生模块产生仿真信号,参数测量模块完成波形的各种参数测量。仿真结果表明该系统基本实现了传统示波器的功能,且测量精度和可靠性等性能指标优于传统仪器。具有较强的可操作性和可维护性。
Abstract: According to the designing idea of modularization, a virtual dual-channel digital oscilloscope based on LabVIEW is developed. The software system includes modules of channel selecting, time and amplitude indexing regulation, triggering and coupling, parameter measuring and signal generating. In channel selecting module, signals can be displayed individually, simultaneously or superimposedly. Simulation signal is produced via module of signal generating and all kinds of parameters can be measured via parameter measuring module. Simulation results show the virtual oscilloscope has realized the functions of traditional oscilloscope and performs better in precision and reliability. It has a high manipulability and maintainability.
关键词: 虚拟仪器;示波器;信号发生器;LabVIEW Key words: virtual instrument;oscilloscope;signal generator;LabVIEW 中图分类号:TP39 文献标识码:A 文章编号:1006-4311(2013)01-0203-02 0 引言 虚拟仪器(Virtual Instruments,VI)技术是当今计算机辅助测试(CAT)领域的一项重要的新技术。虚拟仪器就是在通用计算机上使用相应软件创建测试仪器,实现“软件即仪器”[1]。在虚拟仪器系统中,软件是仪器的关键,硬件是为了解决信号的输入输出。用户可通过修改软件实现仪器功能的改变。虚拟仪器技术可以将许多信号处理方法应用于测量中,彻底打破了传统仪器的框架[2]。用户可根据自身需求设计个性化仪器系统,以满足多样性需求。
虚拟示波器是虚拟仪器技术的一种典型应用,它首先将现场信号经放大调理后,再通过数据采集卡将其数据传输到计算机,并借助LabVIEW软件模拟示波器的操作面板,实现信号采集、分析处理、显示输出及网络远程监控等功能[3-4]。显然,虚拟示波器是一种非常个性化的测量仪器,它完全可根据某些特定的需要实现其功能。 龙源期刊网 http://www.qikan.com.cn 本文基于LabVIEW开发平台,开发了多功能虚拟示波器,实现并扩展了传统示波器的功能。由于引入微处理器,虚拟示波器具有较高的测量准确度和较强的数字化处理能力。此外,通过修改程序代码可以自定义其他功能,开发出不同功能的虚拟示波器。
1 虚拟示波器前面板设计 前面板主要包括波形显示、测量、选择和变换区域。对于通道选择区域,用户可以根据自己的需要,通过选项卡实现对CH1通道与CH2通道的选择,从而实现输入信号的参数设置。实验中,有不同频率与幅值的正弦波,三角波等波形供以选择,这有利于观察不同输入信号下的实验结果。针对波形变换区域,我们设置了“Double”和“Add”选项,以丰富示波器的功能。测试中,我们可以实现双通道波形同时显示以及不同波形的叠加。在输入方式模块,设置了 “AC”、“DC”和“GND”三种输入耦合方式选择,以完善示波器波形的显示功能[5]。除此之外,前面板上还提供了针对交流信号几种常用电参数的测量模块,可直接读出所测波形的峰峰值、有效值等多个参数。各种功能的实现都有与之对应的按钮,通过选项卡,枚举下拉列表,滑动杆,仪表等控件完成前面板的设计。
前面板是用户与虚拟示波器交换信息的接口,用户只需在前面板上进行相应的操作,虚拟示波器就能将测试结果反馈给用户,从而避免了繁琐的人工调试中可能产生的误差[6]。此外,设计过程中前面板界面友好且易于操作也十分重要,在设计中我们根据需要实现的功能,合理设计前面板,使界面简洁便于用户操作。其整体布局如图1所示。
2 虚拟示波器软件设计 2.1 软件设计程序框图 软件设计程序框图主要包括以下几个模块:通道选择模块、波形显示及测量模块、触发耦合模块、信号发生模块。其中通道选择模块可以实现双通道波形实时显示,也可以实现双通道同时显示或叠加波形的显示。波形显示及测量模块用来显示各个通道的波形并完成波形参数检测。信号发生模块主要功能是产生仿真波形,即产生方波、正弦波、矩形波以及三角波等信号,并通过虚拟示波器显示。控制面板上每个模块分配了对应的控制区域。前面板在完成一个区域设计后,切换到程序框图窗口,自行生成与前面板控件相对应的图标。然后根据虚拟示波器前面板各控件的作用和联系选择相应的功能模块,对其进行编辑、排版和连接,以实现相应功能。
2.2 示波器功能的实现 示波器功能模块主要包含通道选择模块、波形显示及测量模块和触发耦合模块。
通道选择模块。根据传统双通道示波器原理,本文所设计的虚拟示波器采用条件结构实现“CH1”通道、“CH2”通道、“Double”双通道波形的显示以及“Add”波形的叠加。通过枚举选择、条件结构等几个虚拟仪器共同作用可以实现通道选择功能。 龙源期刊网 http://www.qikan.com.cn 波形显示及测量模块。示波器主要功能是用于波形的显示与测量,在程序框图中使用条件结构实现不同通道的波形选择。对于双通道波形的显示,可以将两个输出波形进行捆绑并转化为数组在波形图上实时显示。在设计波形叠加的时候,应注意两个通道的采样频率应该一致,可采用“最大值最小值”比较函数,使波形发生器的采样频率为最大采样频率,将两个波形用“加法”、“簇捆绑”以及“簇转换为数组”函数实现波形的叠加[7]。为完善示波器功能,设计时加入了波形测量模块,将产生的信号通过不同形式的检波、计算得出不同电参数的测量结果。其中包括最大值、最小值、峰峰值以及有效值的测量。
输入耦合模块。输入耦合方式的选择是通过滑动杆以及条件结构实现示波器上的“AC”、“GND”和“DC”的选择。其中“AC”表示交流小信号,有滤直流通交流的功能。在设计时用高通滤波器滤去直流成分并显示波形。“GND”为接地方式,设计时分别将通道一和通道二输出的波形乘以数值常量“0”,通过簇捆绑与转换实现接地功能。
2.3 信号发生模块 信号发生模块主要包括波形产生和频率幅值调节两模块,用于产生仿真波形。能产生正弦波、方波、三角波及锯齿波等波形,且波形的频率和幅值可调。
波形产生模块。本次设计添加了波形产生模块,以便较好的实现示波器功能的仿真。为了方便,可利用LabVIEW软件直接产生仿真信号。选择“函数选板”中的“波形产生”函数作为正弦波、方波、三角波及锯齿波的发生器。在程序设计框图中,使用Case结构对四种波形进行选择,使用枚举下拉列表作为Case结构的条件。
频率幅值调节模块。与传统信号发生器界面上的频率选择旋钮一样,在进行频率调节时可预先设定合适的频率档位(如1K、10K等)。这样的设计使得调节更为方便,测量结果更加准确。除此之外,信号发生器不仅能实现简单的幅值调节,还可以通过20dB以及40dB的幅值衰减按钮,实现大幅度衰减。
3 仿真结果 实验中,我们将前面板上CH1通道设置为幅值为10,频率为1的正弦波。将CH2通道设置为占空比为50%,幅值为8,频率为10的方波。将输入触发方式选择在AC档。并将波形变换区域选在“ADD”处,以实现“CH1”通道与“CH2”通道的叠加功能,并对产生波形进行参数测量。实验结果如图2所示。
4 总结 本文设计了基于LabVIEW的双通道虚拟示波器,仿真调试结果表明虚拟示波器可正常显示波形,实现对波形的精确测量及选择变换。
利用LabVIEW图形化编程语言设计出的双通道虚拟示波器,与传统仪器相比,在性能价格比、开发效率、可操作性和可维护性等方面都具有明显优势。既缩短了开发和测试时间,又龙源期刊网 http://www.qikan.com.cn 降低了开发成本。此外,也可以通过软件修改自定义其他功能,开发出不同功能的虚拟示波器。
参考文献: [1]龙志强,赵海龙,罗辉.虚拟仪器测试技术研究[J].仪表技术,2000,3:17-19. [2]程刚,王肖剑.基于LabVIEW的过电压在线检测仪[J].计算机测量与控制,2012,20(3):845-847.
[3]杨丰萍,姜志玲.基于虚拟仪器技术的示波器的设计[J].华东交通大学学报,2009,26(1):47-51.
[4]陈昌鑫,靳鸿,冯彦君.数据采集卡和虚拟示波器系统[J]. 仪表技术与传感器,2012,3:67-69.
[5]冯静亚,于强,吕朝晖等.虚拟示波器的软件设计与应用[J]. 计算机工程与设计,2007,28(1):211-273.
[6]史延龄.虚拟示波器的设计研究[J].仪表技术,2001,3:11-13. [7]粱海泉,张逸成,杨挺等.基于虚拟仪器平台的多通道示波器设计[J].自动化仪表,2007,28(2):61-62.