Towards using opticalNIR photometry to measure the temperature of O stars
太阳光度计测量气溶胶光学厚度
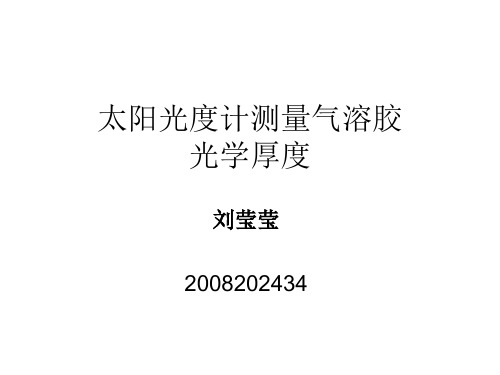
气 溶 胶光 学 厚 度
时间
5
1020nm
•
气 溶 胶光 学 厚 度
4
3
2
1
0
23:13:57 03:48:09 08:40:04 01:15:27 07:25:51
时间
三.利用最小二乘法计算大气浑浊度系数 (β)和Angstrom波长指数(α)
2.1反演光学厚度原理
根据Beer-Lambert-Bouguer 定律,在地面直接测得 的太阳辐射E(W/ m2) 在给定波长上的表达式为: Eλ = E0λ R - 2exp ( - mτλ) Tgλ (1)
其中E0 为大气外界太阳辐照度(太阳常数) , R 为测量
时刻日地距离(天文单位,约等于1) , m 为大气光学
思考:
波长指数α反映气溶胶粒子谱分布情况,它与气
溶胶的平均半径有关,平均半径越小,气溶胶的
散射特性越趋近于分子散射,α越趋近于_?
算:
τrλ =p/p0×0. 0088λ- 4. 05 (4) 式中p0 为标准大气压(1013. 25 hPa) , p 为实际 大气压,λ单位为μm。
在可见光、近红外波段,大气中主要存在臭氧和
水汽的吸收。选择没有水汽吸收的通道440 nm、
870 nm、1020 nm ,且这3 个通道只有气溶胶消 光和Rayleigh 散射,则式(3) 中τO3λ、τNO2λ都为 “0”。将式(2) 和(3) 结合,同时公式两边取对数, 则为:
3.2 最小二乘法线性拟合
• 设直线方程的表达式为: (2-6-1)
• 对满足线性关系的一组等精度测量数据(xi,yi),假定 自变量xi的误差可以忽略(实际实验中总有一个变量的误 差相对较小,可以忽略,作为X分量),则在同一xi下, 测量点yi和直线上的对应点a+bxi的偏差di如图(2-6-2) 所示:
基于条纹反射测量技术的太阳能热发电聚光镜面形检测方法研究
2016 NO.03SCIENCE & TECHNOLOGY INFORMATION科技报告导读173 科技资讯 SCIENCE & TECHNOLOGY INFORMATION simulated working conditions. For the technical problem of that it is difficult to make efficient use of the waste heat at medium temperature, this report constructs two 1.x effect absorption refrigeration cycles. The simulation results show that the COP of the 1.x effect absorption refrigeration cycles is 20% higher than that of conventional single effect cycle at some simulated working conditions. To validate the performance of the proposed new cycles and theory model used in this report, an experimental system of a 1.x effect absorption refrigeration cycle is designed and built, which is one type of 1.x effect absorption refrigeration cycle. The experimental research shows that, when evaporation temperature is 5℃, absorption temperature and condensation temperature are 40℃, if the generation temperature reaches to 135.3℃, the COP of the new cycle is about 0.9 and 20% higher than that of conventional single effect cycle, when generation temperature is 127℃,absorption temperature and condensation temperature are 40℃, if the evaporation temperature reaches to 10℃, the COP of the ejector-absorption combined refrigeration system is about 1 and 30% higher than that of conventional single effect cycle.Then the performance of the constructed new cycles being better than that of conventional cycle is proved by experiment.Key Words :Absorption Refrigeration;Cycle Configuration;Cooling Availability;Theoretical Analysis;Experimental Study 阅读全文链接(需实名注册):/xiangxiBG.aspx?id=48493&flag=1&flag=1基于条纹反射测量技术的太阳能热发电聚光镜面形检测方法研究卢振武 魏秀东(中国科学院长春光学精密机械与物理研究所)摘 要:提出了基于条纹反射测量技术的太阳聚光器面形检测方法,使用投影仪在光屏上投射黑白相间的正弦条纹,经被测镜反射后成像于相机,采用四步相移算法计算像面上和光屏上点的对应关系,然后运用迭代算法拟合被测镜方程及镜面上各个点法线方向。
风云卫星数据和产品应用手册讲解

风云卫星数据和产品应用手册第1章概述1.1 FY-3A卫星概况风云三号A气象卫星(简称FY-3A)是我国的第二代太阳同步极轨气象卫星。
风云三号气象卫星将实现全球、全天候、多光谱、三维、定量对地观测。
风云三号星发射总质量为2450kg,发射尺寸:4.38m×2m×2m,卫星长期功耗1130W。
卫星本体由服务舱、推进舱与有效载荷舱组成。
服务舱采用中心承力筒和隔板结构,主要安装电源、测控、数管及姿轨控分系统的部件和设备、推进舱采用中心承筒和隔板结构,主要安装推进系统设备以及蓄电池组和放电调节器。
有效载荷舱隔板和构架结构,主要安装探测仪器的探测头部,舱内主要安装探测仪器的电子设备等。
风云三号A卫星有十一台遥感探测仪器。
遥感数据通过两个实时传输信道(HRPT和MPT)和一个延时传输信道(DPT)进行传输。
风云三号A卫星设计寿命为3年。
1.2 主要技术指标1.2.1 卫星轨道⑴轨道类型:近极地太阳同步轨道⑵轨道标称高度:831公里⑶轨道倾角:98.81°⑷入轨精度:半长轴偏差: |Δa|≤5公里轨道倾角偏差:|Δi|≤0.1°轨道偏心率≤0.003⑸标称轨道回归周期为5.79天⑹轨道保持偏心率:≤0.00013⑺交点地方时漂移:2年小于15分钟⑻卫星发射窗口:降交点地方时10:051.2.2 卫星姿态⑴姿态稳定方式:三轴稳定⑵三轴指向精度:≤0.3°⑶三轴测量精度:≤0.05°⑷三轴姿态稳定度:≤4×10⁻³ °/s1.2.3 太阳帆板对日定向跟踪1.2.4 星上记时⑴记时方式:J2000日计数和日毫秒计数⑵记时单位:1毫秒⑶时间精度(星地总精度):小于20毫秒1.2.5 遥感探测仪器性能指标1.2.5.1 可见光红外扫描辐射计(VIRR)(1)通道数、各通道波段范围、灵敏度见表1-1。
(2)空间分辨率:星下点分辨率1.1Km(3)扫描范围:±55.4°(4)扫描器转速:6线/秒(5)每条扫描线采样点数:2048(6)MTF≥0.3(7)通道配准:飞行方向/扫描方向星下点配准精度<0.5个像元(8)扫描抖动:<0.8个IFOV(9)通道信号衰减:<15%/2年(10)量化等级:10比特(11)定标精度:可见光和近红外通道:CH1、2、7、8、9 7%(反射率)CH6、10 10%(反射率)红外通道:1k(270k)。
用于大气温度廓线测量的瑞利-拉曼激光雷达
l 测 量 原 理
平 流层 中上部 ( 5 ok 以上 ) 溶胶 含量 很低 , 弹 性散 射 信号 相 对 于 大气 分 子 的瑞 利 散 射信 号 而 言 2 ~3 m 气 其
可 以忽 略 , 时 , 以近 似认 为大 气 回波信 号仅 包括 瑞 利散 射 信 号 。假 设 某 一高 度 处 大气 密 度 已知 , 激 光 雷 此 可 对 达方 程稍 加变 形 , 根 据激光 雷 达 回波信 号可 以得 到 大气密 度廓 线 , 并 为
均 显示 较 好 的 一 致 性 , 明 了 激 光 雷 达 温 度 测 量 结 果 的准 确 性 , 温 度 测 量 数 据 可 以用 于气 象学 研 究 。 证 其 关 键 词 : 瑞 利 一 曼 激 光 雷 达 ; 大 气 温度 廓 线 ; 小 波 降 噪 ; 温 度 反 演 拉
1001432207144904用于大气温度廓线测量的瑞利南京信息工程大学气象灾害省部共建教育部重点实验室南京210044中国科学院安徽光学精密机械研究所大气光学中心合肥230031国家知识产权局专利审查协作中心北京100190大气温度廓线及其时间演变特征资料在地球科学领域具有重要的应用为获取高时空分辨的大气温度的垂直分布建立了瑞利拉曼激光雷达进行温度测量的主要原理和研制的瑞利拉曼激光雷达的主要参数
2 .中 国 科 学 院 安 徽 光 学 精 密机 械 研 究 所 大 气 光 学 中 心 ,合 肥 2 0 3 ; 3 0 l
3 .国 家 知 识 产 权 局 专 利 审 查 协 作 中心 ,北 京 1 0 9 0 1 0)
摘 要 : 大气 温 度 廓 线 及 其 时 间 演 变 特 征 资 料 在 地 球 科 学 领 域 具 有 重 要 的 应 用 , 获取 高 时 空 分 辨 的 大 为
OceanInsight LED光源辐射性能测试指南说明书

EDUCATION EXPERIMENTThanks to the evolution of small, handheld spectrom-eters, LED-based applications are more easily managed than with previous instruments. Indeed, spectrometers can be deployed to measure LED emission wavelengths as well as brightness and power output. For example, horticulturists using LEDs in greenhouse operations are interested in analyzing criteria such as how the intensity of blue and red light affects the growth rate of various floral crops. LEDs are often defined by characteristics such as CWL (center wavelength) and FWHM (full width at half maximum), as well as their power (obtained by inte-grating the intensity under the spectral curve in irradi-ance mode). CWL and FWHM measurements can be made in relative irradiance or absolute irradiance mode. Power measurements are only possible in absolute irradiance and require a system that has been radiomet-rically calibrated.Radiometric Characterization of LEDsNot all LEDs have a single peak. White light LEDs have 2 peaks – one from a blue LED that excites a phosphor coating inside the LED package, and a less intense, broader peak at longer wavelengths from the phosphor emission. White light LEDs are more often character-ized using correlated color temperature (CCT), which fits the LED’s spectral output to a blackbody curve (es-sentially comparing it to the sun or a tungsten halogen bulb) and reports the corresponding color temperature.In this experiment, you will use a calibration light source and integrating sphere to radiometrically cali-brate an Ocean Insight spectrometer system configured for measuring LED emission. You will then use your calibrated system to measure absolute spectral intensi-ty values and peak characteristics including the center wavelength (CWL) and full width at half maximum (FWHM) for different LEDs.Please note: Although the methods described in this material remain relevant, OceanView software has been upgraded and, in some cases, newer versions of prod-ucts mentioned may exist. The OceanView changes primarily relate to its graphical interface and function icons.MATERIALS• FLAME-S-VIS-NIR spectrometer• HL-3-INT-CAL calibration light source calibrated for use with an integrating sphere• QP400-2-VIS-NIR fiber • FOIS-1 integrating sphere designed to collect light from emission sources like LEDs• LED-PS LED power supply and controller• Computer with OceanView software installed• Bare LED bulbs that are 9.52-mm diameter or smaller with 2.77-mm lead spacing including one white LED if availableSAFETYWear safety goggles and other appropriate safety gear during the experiment. Take all proper safety precau-tions when handling solutions and wear proper eye protection when working with UV light sources.PROCEDURE1. Connect the power cord to the HL-3-INT-CAL calibration lamp. Turn the lamp on and allow it to warm up at least 15 minutes.2. Connect the spectrometer to your computer using the USB cable and allow the spectrometer to warm up for at least 15 minutes.3. Use the fiber to connect the spectrometer to the SMA-terminated output port of the integrating sphere.4. Connect the power cord to the LED-PS, insert a test LED into the electrical connector and turn the LED-PS on.NOTE: The leads coming from the LED have different polarity. If the LED does not light up when the LED-PS is turned on, remove the LED from the connector, rotate it 180 degrees and reinsert it into the connector.5. Place the LED-PS on the integrating sphere so theLED is inserted into the sample port of the integrating sphere.6. Start OceanView. Click the Start button, then select All Programs | Ocean Optics | OceanView | OceanView or use the Desktop shortcut created when you installed the software.7. Select the Spectroscopy Application Wizards option on the Welcome Screen.8. Select the Photometry, Photons, Power and Energy option in the Spectroscopy Wizards window to start the Photometry Wizard.9. Select the New Absolute Irradiance Processing option.10. Set your acquisition parameters in the Set Acquisition Parameters window.a. Click the Automatic button to automatically adjust the Integration Time to the optimum value.b. Set Scans to Average to 10 and Boxcar Width to 5 to reduce measurement noise and improve the measurement. You can set Scans to Average to a higher value but this will slow down your acquisitions (total measurement time equals the number of averages multiplied by the integration time).c. Place a checkmark in the NonlinearityCorrection box if this feature is available for your spectrometer. Click Next.11. Select the New Calibration option to radiometrically calibrate the spectrometer using theHL-3-INT-CAL lamp with the integrating sphere.12. Click the Store Reference button to store a reference spectrum. Click Next.13. Close the shutter on the light source or block the light from entering the spectrometer. Do not turn your light source off. Click the Store Background button to store a background spectrum. Open the shutter or unblock the light source and click Next.14. Click Browse to navigate to the location of the calibration file that came with the calibration lamp and click Open to load it. Click Next.15. Select the Use Integrating Sphere option for the Collection Area and save the calibration file for future use by clicking the Save to File… button. Click Next.NOTE: The radiometric calibration file saved for your system is valid as long as the fiber remains connected to the integrating sphere and spectrometer. If the fiber is disconnected from the spectrometer or integrating sphere, a new radiometric calibration must be done.16. Select Integrated Intensities option and click Next.17. Specify the wavelength range over which you want to integrate your power values. For these measurements, you can specify the wavelength range where your LED emission occurs. Click Finish.18. You are now ready to radiometrically characterize your LEDs.19. The Absolute Irradiance spectrum for your LED will be displayed in the AbsoluteIrradianceView window. You can adjust the graph appearance using the graph tools above the graph. For example, click the Scale Graph Height to Fill Window button to zoom in on the spectrum.20. A range of integrated intensity values for the LED will be displayed in the Table window.21. Configure peak finding to characterize your LED peak characteristics using the View Spectrum Peaks button in the Absolute Irradiance window.a. Select the data source for the peak metrics calculations from the options in the table. ClickNext.b. Use the Configure Baseline options to subtract any underlying spectral structures that may obscure the peaks you are trying to identify. Select None for these LED measurements. See the OceanView manual at for more details on these settings. Click Next.c. Use the Determine Peaks options to set different methods of peak analysis and filtering to reduce unwanted noise effects. Use the default Controls settings and select None under Smoothing forthese LED measurements. See the OceanView manual for more details on these settings. Click Next.d. Select the parameters you would like to measure for the LED. Make sure to include the Center Wavelength (CWL) by selecting Center and the optical resolution as full width at half maximum (FWHM) by selecting FWHM. Select Show Table of Values to display your peak parameters in a table. Click Finish.22. Your peak characteristics will be shown in the Peak Table window.23. Record the LED peak characteristics including CWL, FWHM and total power in μW in the Data and Analysis section.24. Click the Convert Active Spectrum to Overlay button to overlay the spectrum so you can compare it to the spectra for other LEDs in the same graph view. If you want to remove an overlaid spectrum, click the Delete Overlay Spectrum button. Highlight the spectrum you want deleted and click OK.25. Save your LED spectrum by clicking the Configure Graph Saving button to configure the File Writer.a. Select the directory where you want to save the file.b. Enter a filename for your spectrum.c. Click Apply and then Exit to close the dialog box.26. Click the Save Graph to Files button to save your spectrum.27. Change the LED bulb and repeat steps 23-26 for the other LEDs.NOTE: When working with LEDs of different intensities, you can change the integration time and scans to average values after the spectrometer has been calibrated to optimize the acquisition and avoid saturation, but you must store a new dark spectrum with the new acquisition parameters before making any measurements. Do not change the boxcar smoothing value after it is set during calibration.28. Before exiting OceanView, print a copy of the graph showing the LED spectra by clicking the Print button .DATA AND ANAL YSISIf you had a white LED available for the measurements, what CWL and FWHM value does OceanView reportfor the white light LED? Does this make sense?ADDITIONAL TASKS1. Change the drive current on the LED-PS.a. How does the CWL change?b. Does the peak shape change?2. Customize the Schematic to display the integrated power and other photometry values in separate Scalar views in OceanView.a. Click the Schematic Window tab to open the Schematic View.b. Right-click on an empty part of the Schematic and select Advanced Math | Filtering | Selectorto add a Selector node to the Schematic.c. CTRL+click and drag to connect the EPP node generated by the Absolute Irradiance wizard to the Select node.d. Double-click the Select node and use the drop down menu to select the LED parameter you would like to display. For integrated power, you can select uWatt. Click Apply and then click Exit to close the dialog box.e. Right-click on an empty part of the Schematic and select View | Add Scalar View.f. CTRL+click and drag to connect the Select node to the Scalar node.Save a screenshot of your OceanView software displaying the LED absolute irradiance spectrum, LED peak parameters and integrated power value.3. Run the Color wizard in OceanView and determinethe color parameters for the LEDs.。
xx012

一、巨型太阳望远镜( Giant Solar Optical Telescope 简称GISOT)GISOT是一个巨型高分辨太阳望远镜方案(椭圆主镜11mx4m),中心子镜4m,两边各有3块2m子镜,8个小子镜填充缝隙(减少了中央峰值以外的衍射光)。
GISOT工作波长近紫外~近红外(380nm~2200nm),采用地平式机架,开放式结构,计划利用自适应光学(Tip/Tilt+变形镜)加事后斑点干涉像复原技术,在可见光处分辨率可达0.01角秒(10km),是太阳物理界的E-ELT、TMT。
瑞典1米太阳望远镜(SST) 分辨率 0.1角秒(可见光处) 德国1.5米太阳望远镜(Gregor)分辨率 0.07角秒(可见光处) 美国4米太阳望远镜(ATST) 分辨率 0.03角秒(可见光处)GISOT采用30m直径可折叠帐篷式圆顶,位于60m高塔架上。
主镜子镜是轻型镜面,镜面背部开有三角形空腔,镜面侧支撑在空腔内(不在镜面边缘),可使镜面彼此靠得更近。
空腔内还有空气冷却系统。
主镜抛物面(11mx4m),焦距18500mm。
次镜抛物面,直径340mm,焦距500mm。
GISOT光学系统图两种工作模式:1):共焦所有子镜元件共焦,需要高精度的指向控制,指向探测系统可采用太阳自适应光学波前探测系统。
2):共位相这需要对主镜元件进行高精度轴向控制(“piston”误差)。
普通的自适应光学波前探测技术(基于Shackhartman),不能测量“piston”误差,要用干涉测量方法。
有两种方法实现共位相测量a):用几个白光麦克尔逊干涉仪在子镜两两接触区域(有10个这样的区域)测量6个“piston”误差。
b):在曲率中心干涉测量(需要零位补偿)上述两种方法都不能探测大气引起的piston误差(在1um处将达10个波长),探测大气引起的piston误差可采用修正型Dame干涉仪。
参考文献1:GISOT: A giant solar telescopehttp://dot.astro.uu.nl/rrweb/dot-publications/gisot2004.pdf2004年SPIE Vol.5489二、印度2米太阳望远镜计划(India National Large Solar Telescope 简称NLST)印度天体物理研究所提出在喜玛拉雅山地区建造一个2米级的太阳望远镜。
天文术语N-O范本一份
天文术语N-O范本一份天文术语N-O 1天文术语N-Onaked T Tauri star 显露金牛T 型星narrow-line radio galaxy ( NLRG ) 窄线射电星系Nasmyth spectrograph 内氏焦点摄谱仪natural reference frame 自然参考架natural refenence system 自然参考系natural seeing 自然视宁度near-contact binary 接近相接双星near-earth asteroid 近地小行星near-earth asteroid belt 近地小行星带near-earth et 近地彗星NEO, near-earth object 近地天体neon nova 氖新星Nepturian ring 海王星环neutrino astrophysics 中微子天文NNTT, National New Technology Telescope国立新技术望远镜NOAO, National Optical Astronomical 国立光学天文台Observatoriesnocturnal 夜间定时仪nodal precession 交点进动nodal regression 交点退行non-destroy readout ( NDRO ) 无破坏读出nonlinear infall mode 非线性下落模型nonlinear stability 非线性稳定性nonnucleated dwarf elliptical 无核矮椭圆星系nonnucleated dwarf galaxy 无核矮星系nonpotentiality 非势场性nonredundant masking 非过剩遮幅成象nonthermal radio halo 非热射电晕normal tail 正常彗尾North Galactic Cap 北银冠NOT, Nordic Optical Telescope 北欧光学望远镜nova rate 新星频数、新星出现率NTT, New Technology Telescope 新技术望远镜nucleated dwarf elliptical 有核矮椭圆星系nucleated dwarf galaxy 有核矮星系number density profile 数密度轮廓numbered asteroid 编号小行星oblique pulsator 斜脉动星observational cosmology 观测宇宙学observational dispersion 观测弥散度observational material 观测资料observing season 观测季occultation band 掩带O-Ne-Mg white dwarf 氧氖镁白矮星one-parameter method 单参数法on-line data handling 联机数据处理on-line filtering 联机滤波open cluster of galaxies 疏散星系团Ophelia 天卫七optical aperture-synthesis imaging 光波综合孔径成象optical arm 光学臂optical disk 光学盘optical light 可见光optical luminosity function 光学光度函数optically visible object 光学可见天体optical picture 光学图optical spectroscopy 光波分光orbital circularization 轨道圆化orbital eccentricity 轨道偏心率orbital evolution 轨道演化orbital frequency 轨道频率orbital inclination 轨道倾角orbit plane 轨道面order region 有序区organon parallacticon 星位尺Orion association 猎户星协orrery 太阳系仪orthogonal transformation 正交变换oscillation phase 振动相位outer asteroid belt 外小行星带outer-belt asteroid 外带小行星outer halo cluster 外晕族星团outside-eclipse variation 食外变光overshoot 超射OVV quasar, optically violently OVV 类星体variable quasar、。
Ia
资助项 目:国家 自然科学基金 ( 1 1 3 7 3 0 1 5 ) ;9 7 3项 目( 2 0 1 4 CB8 4 5 7 0 2 )
通讯 作 者 : 姜 碧沩 ,b j i a n g  ̄b n u . e d u . c n
一
,
同时也 被用 来 测 量其 他 宇 宙学 参 数 ,如 哈勃 常数 凰 、宇 宙密 度参 数 Q M、 A ’ 。S a u l
P e r l mu t t e r ,Br i a n S c h mi d i t 和 A d a m Ri e s s 正 是基 于 对 I a型超 新 星 的研 究 ,发现 宇 宙加 速 膨胀 而获 得 2 0 1 1年诺 贝尔 物理 奖 。 ’
系统 误 差来 源 , 准 确地 测 量 消光 才 能获 得精 确 的宇 宙 学参 量 。事 实上 , 不同I a型 超新 星 的
消光 幅 度相 差 很 大 ,例 如在 可 见光 波 段 ,S N 1 9 9 4 D 的 消光 A v=0 . 1 8 ma g ,S N 2 0 0 3 c g的 A v 2 . 3 ma g … , S N 2 0 0 2 c v的 Av 7 . 9 ma g 等。 所 以,要寻找 I a型 超新 星消 光 改正 的一 般规 律 ,以求 获得 准确 的宇宙学 距 离 。
如果 绝 对 星等 为 常 数 ,且 A = 0 ,可 以很 容 易地 从 视 星等 获 得 距 离 。但 是 ,在 计 算距 离 时 , 必须 进 行消 光 改正 ,即上 式 中的 ( 在 波 段 处 尘埃 所 引起 的消光 量 , 单 位 为 ma g ) ,每 0 . 1
基于HITEMP_数据库的分子吸收光谱高精度快速建模方法
基于HITEMP数据库的分子吸收光谱高精度快速建模方法钱宝健,蔡静*,常海涛,高一凡(航空工业北京长城计量测试技术研究所,北京 100095)摘要:为解决高温环境下分子吸收光谱精确计算的时间复杂性,满足宽光谱测量领域对理论吸收光谱计算的需求,本研究利用Python语言以逐线计算为基础,结合线型函数的简化、线翼截止准则和谱线数据库的优化,建立了基于高温分子吸收参数数据库(High⁃Temperature molecular spectroscopic absorption parameters data⁃base,HITEMP)的分子吸收光谱精确快速计算模型。
以Hartmann⁃Tran线型函数作为吸收光谱标准线型编写部分相关二次速度依赖硬碰撞函数(partially⁃Correlated quadratic⁃Speed⁃Dependent Hard⁃Collision Profile,pCqSDHC),结合复概率函数(Complex Probability Function,CPF)简化模型实现了线型函数的精确快速计算,相较于理论计算模型计算速度提高了20倍。
按照光谱计算残差在10-5量级确定了固定波数截断结合谱线半宽等倍数截断的线翼截止准则。
以阈值线强度10-25 cm-1/(mol∙cm-2)为标准筛选了每100 K温度梯度时的光谱数据,整合得到优化数据库。
在6 500 ~ 8 000 cm-1范围内对水分子的吸收光谱进行计算,并与“”分子气体集成光谱建模网站仿真结果对比,逐线模型的计算误差在10-7量级,优化模型的计算误差在10-5量级,计算速度平均提升25倍。
该模型满足吸收光谱测量中对于理论吸收光谱的高效准确计算,为复杂环境中基于宽调谐、超连续激光吸收光谱的测量研究提供了理论模型基础。
关键词:吸收光谱;HITEMP数据库;线型函数;线翼截止中图分类号:TB9;O433 文献标志码:A 文章编号:1674-5795(2023)05-0039-10Modeling molecular absorption spectra based on the HITEMP databaseQIAN Baojian, CAI Jing*, CHANG Haitao, GAO Yifan(Changcheng Institute of Metrology & Measurement, Beijing 100095, China)Abstract: To address the computational complexity of accurately calculating molecular absorption spectra in high⁃temperature environments and meet the demand for theoretical absorption spectrum calculations in broad⁃spectrum mea⁃surement fields, this study developed a precise and fast calculation model for molecular absorption spectra based on the High⁃Temperature molecular spectroscopic absorption parameters database (HITEMP). The model was implemented us⁃ing Python language, employing a line⁃by⁃line calculation approach combined with simplification of line shape functions, line wing truncation criteria, and optimization of spectral line databases. The Hartmann⁃Tran line shape function was used as the standard absorption spectrum line shape, and partially⁃Correlated quadratic⁃Speed⁃Dependent Hard⁃Collision Pro⁃file (pCqSDHC) was developed for relevant second⁃order velocity⁃dependent hard⁃collision functions. By incorporating the doi:10.11823/j.issn.1674-5795.2023.05.06收稿日期:2023-09-26;修回日期:2023-10-08基金项目:国家“十三五”计量技术基础科研项目(JSJL2020205A003)引用格式:钱宝健,蔡静,常海涛,等.基于HITEMP数据库的分子吸收光谱高精度快速建模方法[J].计测技术,2023,43(5):39-48.Citation:QIAN B J,CAI J,CHANG H T,et al.Modeling molecular absorption spectra based on the HITEMP database[J].Metrology & Measurement Technology,2023,43(5):39-48.Complex Probability Function (CPF) and simplifying the model, the line shape functions were calculated accurately and rapidly, resulting in a 20⁃fold increase in computational speed compared to theoretical models. The line wing truncation criteria were determined based on the spectral calculation residual at the level of 10-5 and involved the truncation of fixed wavenumbers combined with equal multiple truncations of spectral line half widths. Spectral data for each temperature gradient of 100 K were selected using a threshold line intensity of 10-25 cm-1/(mol∙cm-2) and integrated to create an opti⁃mized database. The absorption spectra of water molecules were calculated within the range of 6 500 ~ 8 000 cm-1 and compared with the simulation results from "", a molecular gas integrated spectral modeling website. The calculation error of the line⁃by⁃line model was at the level of 10-7, while the optimized model achieved a calculation error at the level of 10-5, with an average speed improvement of 25 times. This model enables efficient and accurate calculation of theoretical absorption spectra for absorption spectral measurements and provides a theoretical foundation for measuring studies based on wide⁃tunable and supercontinuum laser absorption spectra in complex environments.Key words: absorption spectrum; HITEMP database; line shape functions; line wing cutoff0 引言分子吸收光谱是一种描述物质分子对特定波长光的吸收能力的图谱,通过测量物质对不同波长光的吸收程度,可以推断物质的组成、浓度、结构和化学性质等重要信息,从而在燃烧诊断[1-2]、温度测量[3-4]、污染物监测[5]等领域中进行定性和定量分析。
用于燃烧场诊断的分子滤波瑞利散射技术
用于燃烧场诊断的分子滤波瑞利散射技术王晨;刘晶儒;胡志云;张振荣;叶景峰;张立荣【摘要】为了测量燃烧场的热力学性质,研究了分子滤波瑞利散射技术.分子滤波瑞利散射技术采用窄线宽激光器、分子滤波器和像增强CCD相机,通过分子吸收凹陷检测激光片照射流场产生散射光的频谱,抑制背景杂散光和米散射,解析流场热力学信息.建立了分子滤波瑞利散射诊断系统和分子滤波器,根据测得的滤波图像和碘蒸气吸收光谱,获得了甲烷一空气预混火焰的温度场和密度场.测量结果显示,距离标定燃烧炉表面15 mm处火焰的密度为0.19 kg/m3,温度为(1827±84) K,与CARS法测是结果基本吻合,测温不确定度为8%.分子滤波瑞利散射技术还成功应用于水雾和高速喷流结构的诊断,获得了激光作用区的湍流结构.实验表明,分子滤波瑞利散射技术能够测量燃烧场温度和密度,并能用于流场可视化.%A molecular Filtered Rayleigh Scattering (FRS) diagnostic system was demonstrated to measure thermodynamic properties in combustion environments. The diagnostics system was composed of a narrow line width laser, a molecular/atomic absorption filter and a collection device such as ICCD. The absorption filter was used to modify the spectra of the Rayleigh scattering signal from the flow field illuminated by a laser sheet from a Nd:YAG pulsed laser. The laser was tuned to an absorption line of iodine vapor contained in the filter. This caused Mie scattering and background scattering from solid particles and strong absorption on the surface while much of Doppler broadened Rayleigh scattering was transmitted through the filter. The thermodynamic parameters were deduced from the measured transmission of the molecular Rayleigh scattering. The FRS diagnostic system and the iodinefilter cell were described. On the basis of diagnosing FRS image and measuring iodine vapor absorption spectrum, the 2D temperature and density fields of methane/air premixed flame were obtained. The measured density at 15 mm above the burner surface is 0. 19 kg/m3 , and temperature is (1 827±84) K, which is good agreement with the results measured by using CARS method in the same condition. The uncertainty of temperature measurement by FRS is less than 8%. Furthermore, FRS technique was used to diagnose the atomization steam and supersonic exhaust flows. The results turbulence structures on the area of laser action were obtained. These demonstrate the abilities of the FRS technique to measure temperature and density fields and to enhance flow visualization in a combustion environment.【期刊名称】《光学精密工程》【年(卷),期】2011(019)002【总页数】7页(P445-451)【作者】王晨;刘晶儒;胡志云;张振荣;叶景峰;张立荣【作者单位】西北核技术研究所激光与物质相互作用国家重点实验室,陕西,西安,710024;西北核技术研究所激光与物质相互作用国家重点实验室,陕西,西安,710024;西北核技术研究所激光与物质相互作用国家重点实验室,陕西,西安,710024;西北核技术研究所激光与物质相互作用国家重点实验室,陕西,西安,710024;西北核技术研究所激光与物质相互作用国家重点实验室,陕西,西安,710024;西北核技术研究所激光与物质相互作用国家重点实验室,陕西,西安,710024【正文语种】中文【中图分类】O657Laser combustion diagnostic techniques are app lied to investigate the high tem perature combustion flow s and turbulent flow s for its advantages of non-intrusive,on-line,good temporal and spatial resolution and visualization.These techniques have been developed rapid ly inU.S.,France,Germany,Sweden,Australia and other developed countries since 80's of last century[1-4],which p layed an important role on design and developm ent of engines for automobiles,airplanes,missiles,etc.Laser Ray leigh scattering[5-6](LRS)technique is an embranchment of laser com bustion diagnostic techniques,w hich was first dem onstrated for 2D temperature im aging in flam es by Fourguette[7].LRS has the advantage of simp licity but the disadvantage o f weak signal strength,w hich can be quickly overw helmed by Mie scattering from solid surfaces,room particulates and soots.Filtered Ray leigh scattering(FRS)is a modification of the LRS technique,first put forth by Miles etal.[8],which takesadvantage of the full-field,unseeded capabilities of LRS while providing increased rejection of Mie scattering interferences from the illum inating laser line.This significant rejection of background noise is achieved by p lacing a molecular iodine vapor cell in front of the detector and using an injection-seeded Nd:YAG laser to tune the laser line to an absorp tion m aximum of the hyperfine iodine spectrum.The seeded laser line shape and associated Mie scattering are thereby strongly rejected while a significant portion o f the Doppler-broadened Ray leigh signal leaks past the filter and reaches the detector.The FRS technique can be used to enhance flow visualization,or to make quantitative measurements of therm odynamic p roperties,w hich is w idely app lied to sooting flames,p lasma,supersonic and hypersonic flow s,and so on[9-11].In this w ork,we p resent the construction and performance of a FRS instrument for quantitative 2D tem perature im aging.The paper beginsw ith a brief summary of FRSworking principles,followed by a description of FRS instrum ent.Resu lts of tem perature and density of a prem ixed flam e are presented,which are compared to CARS temperature measurem ents to validate the accuracy of our FRSmeasurements.Themeasurement uncertainty is provided in the discussion.A lso,the FRS technique is used to enhance flow visualization of water atomization steam and supersonic exhaust flow s.A schematic diagram of the FRSmethod is shown in Fig.1.FRS is an extension of the traditional LRS imaging technique,in which a molecular filter is p laced in frontof thedetector,usually an intensified CCD camera as shown in Fig.1(a).A frequency-doubled Nd:YAG laser is typically used tomeasure the Ray leigh scattering.A mo lecu lar iodine vapor,w hich has hyperfine absorption in the vicinity of the 532 nm laser output,is em ployed as the filter molecule.When the Nd:YAG oscillator is injection seeded,the output linew idth is an order of magnitude less than the I2absorption line width.Injection seeding also allow s to tune the laser output over a narrow about 1 cm-1 range,so that the laser line can be m ade coincident w ith a strong abso rp tion m aximum.A s seen inFig.1(b),strong Mie scattering and background noise,which have the same spectral profile as the laser line shape,are significantly attenuated by the filter while a significant portion of the Doppler-broadened Ray leigh signal leaks past the filter and reaches the detector.The FRS signalmustbe related to the physical variab le of interest such as laser intensity and thermodynamic properties of flow,which can be w ritten asIn Eq.1,S is the intensity of FRS signal which most generally depends upon tem perature,pressure,and the local chemical com position,C is a calibration constant associated with the FRS optical system,Io is the local laser light-sheet intensity,n=p/kT is the local number density,xk is the mole fraction of the k th species present locally in the flow field,(dσ/dΩ)k is the differential Ray leigh cross section for the k th species,Mk is themolecular weight of the kth species,v is the light frequency,τ(v)is the measured transm ission spectrum o f the molecular filter,ΔνD is frequency shift of scattering,and Rk(ν,ΔνD,p,T,Mk)is the normaliz ed Rayleigh line-shape function for the k th species calculated from the S6 model of Tenti etal.[12]. Frequency shift of scattering due to the Doppler shift can be given by Where e o and e s are the incident and observed unit lightwave vectors,respectively,and v is the flow velocity vector.By them easure image divided by a reference image recorded in room-temperature air,the optical calibration constant and local laser-beam intensity dependence can be rem oved.For constant-pressure flow fields,this process yields the fo llow ing exp ression for the normalized FRS signal,Where T0 is the reference temperature(usually 300 K)andσk is defined as a temperature dependent FRS cross section,FRS signal curves are show n in Fig.2.Each curve has been calculated from Eq.3 for meth-ane/air premixed flame of different equivalence ratios.In Fig.2,density can be calculated by the equation ρ=p/RT,w here is an average molecular molemass.Fig.3 show s a schem atic diagram of the FRS optical arrangement.An injection seeded frequency-doub led Nd:YAG laser is used in FRS system.The output of the laser can be tuned by app lying a bias voltage to the heater circuit of the CW seed laser.This tuning capability allow s the seeded Nd∶YAG output bematched to the ho llow center of I2 abs orption spectrum so that the narrow band Mie scattering light produced by the flame can be absorbed and the broadened Rayleigh scattering can be passed partly to provide a detected signals.The output of the YAG laser is sp lit into tw oways.The 3%of the laser energy is used to detect the laser power and frequency on-line.The laser beam w ith 97%of energy passes through a half-wavelength p late that is used to change the polarization of the laser beam,and a spherical lens and a cy lindrical lens which are used to form a laser sheet and then travels through the flame.The Ray leigh scattering from the combustion is then imaged through an iodine filtercelland a narrow band-pass filter onto a 12-bit intensified CCD camera. Configuration of the molecular iodine filter cell is shown in Fig.4.The iodine filter is a glass cy linder w ith op tically flat w indow s on each end.Iodine vapor is formed in the cell by placing a sm all amount of iodine crystals in the side arm of the celland evacuating the cell.The cell temperature is raised above theam bient temperature so that no iodine crystallizes on the window s.The cell temperature is elevated with insulated electrical heat tape.The coldest point in the cell is set in a side arm.The temperature of the side arm controls the vapor pressure(num ber density)of the iodine in the filter cell.The tunable narrowband Nd∶YAG laser with a narrow linew id th at a wavelength o f 532 nm can be tuned across the absorption bands of iodine.Fig.5 presents a m easured absorption line o f iodine at 18 788.4 cm-1.As a first step toward applying the FRS instrum ent for combustion thermom etry,the temperature field in the prem ixedmethane/air flame provided by a Hencken burner is measured.On the basis of diagnosing FRS im ages and measuring iodine vapor absorption spectrum,tem perature and density of m ethane/air prem ixed combustion is obtained.Fig.6 show s the typical measurement results of temperature and density in methane/air prem ixed combustion field forφ=1.It is seen that the measured density at 15 mm above theburner surface is 0.19 kg/m3,and the temperature is(1 827±84)K which is good agreement w ith the result measured by using CARSmethod in the same condition[13].The relativeuncertainty of temperaturemeasurem ent by FRS is less than 8%[14]. Thewater atomization steams are diagnosed using FRS.Fig.7 show s the turbulence structures on the area of laser action.In general,there are two sources of unwanted scattering:surface scattering due to walls and window s and scattering due to particles p resent in the flow.If the iodine filter isnotpresent,the images of the pu lverization flow s wou ld be saturated by particle and background ing the iodine filter,the scattering from walls and w indow s cou ld be significantly absorbed.Since m olecu lar Rayleigh scattering experiences therm al broadening,a portion of the scattering can pass outside of the absorption p ro file,even when the center of the profile coincideswith line-center of the iodine transition. Another examp le show s the potential of FRS to im prove the flow visualizations.The supersonic exhaust flow s were diagnosed using FRS.Considering the Dopp ler shift effect,observation,incident laser and stream wise directions are accomp lished orthogonally each other so that the Mie scattering is not shifted completely out of the absorption line,as shown in Fig.8.W ith this arrangement,the FRS system is not sensitive to Dopp ler shift in the stream wise direction.Thus,the scattering intensity variations results primarily from density and temperature variations.The supersonic exhaust flow is from right to left and the laser sheet propagation direction is from top to bottom of the image,as shown in Fig.9.U sing the iodine filter,the signal-tonoise ratio is sufficient to observe the turbulence structures in the flow field.On the basis of diagnosing FRS im ages and measuring iodine vaporabsorption spectrum,the methane/air premixed flames were diagnosed and the 2D temperature and density fields were obtained.The measured density at15mm above the burner surface is 0.19 kg/m3,and tem perature is(1 827±84)K which is good agreem ent with the resultsmeasured by using CARSmethod in the same condition.The uncertainty of tem perature measurem ent by FRS is less than 8%.Water atomization steam s and supersonic exhaust flow swere diagnosed for flow visualization.These dem onstrate the abilities o f the FRS technique tomeasure the tem perature and density field and to enhance flow visualization in a com bustion environment.王晟(1977-),男,山东乳山人,工程师,1999年于天津大学获得学士学位,2008年于西北核技术研究所获得硕士学位,主要从事激光技术及应用方面的研究。