Towards a Theoretical Framework for Ensemble Classification
2 Lux的nature 【610】
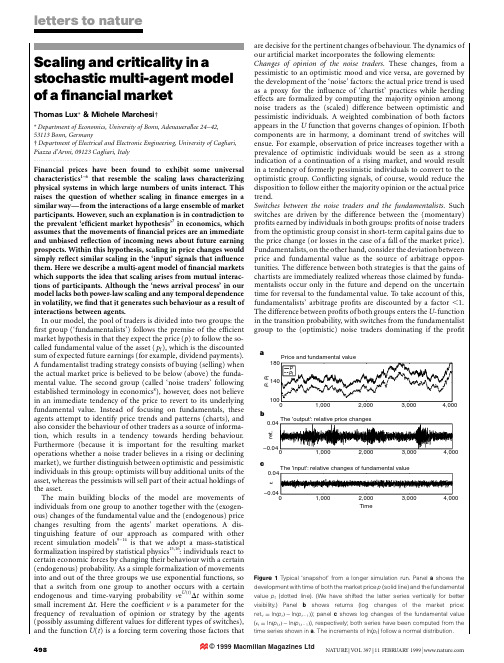
Scaling and criticality in a stochastic multi-agent model of a ®nancial marketThomas Lux *&Michele Marchesi ²*Department of Economics,University of Bonn,Adenauerallee 24±42,53113Bonn,Germany²Department of Electrical and Electronic Engineering,University of Cagliari,Piazza d'Armi,09123Cagliari,Italy.........................................................................................................................Financial prices have been found to exhibit some universal characteristics 1±6that resemble the scaling laws characterizing physical systems in which large numbers of units interact.This raises the question of whether scaling in ®nance emerges in a similar wayÐfrom the interactions of a large ensemble of market participants.However,such an explanation is in contradiction to the prevalent `ef®cient market hypothesis'7in economics,which assumes that the movements of ®nancial prices are an immediate and unbiased re¯ection of incoming news about future earning prospects.Within this hypothesis,scaling in price changes would simply re¯ect similar scaling in the `input'signals that in¯uence them.Here we describe a multi-agent model of ®nancial markets which supports the idea that scaling arises from mutual interac-tions of participants.Although the `news arrival process'in our model lacks both power-law scaling and any temporal dependence in volatility,we ®nd that it generates such behaviour as a result of interactions between agents.In our model,the pool of traders is divided into two groups:the ®rst group (`fundamentalists')follows the premise of the ef®cient market hypothesis in that they expect the price (p )to follow the so-called fundamental value of the asset (p f ),which is the discounted sum of expected future earnings (for example,dividend payments).A fundamentalist trading strategy consists of buying (selling)when the actual market price is believed to be below (above)the funda-mental value.The second group (called `noise traders'following established terminology in economics 8),however,does not believe in an immediate tendency of the price to revert to its underlying fundamental value.Instead of focusing on fundamentals,these agents attempt to identify price trends and patterns (charts),and also consider the behaviour of other traders as a source of informa-tion,which results in a tendency towards herding behaviour.Furthermore (because it is important for the resulting market operations whether a noise trader believes in a rising or declining market),we further distinguish between optimistic and pessimistic individuals in this group:optimists will buy additional units of the asset,whereas the pessimists will sell part of their actual holdings of the asset.The main building blocks of the model are movements of individuals from one group to another together with the (exogen-ous)changes of the fundamental value and the (endogenous)price changes resulting from the agents'market operations.A dis-tinguishing feature of our approach as compared with other recent simulation models 9±14is that we adopt a mass-statistical formalization inspired by statistical physics 15,16:individuals react to certain economic forces by changing their behaviour with a certain (endogenous)probability.As a simple formalization of movements into and out of the three groups we use exponential functions,so that a switch from one group to another occurs with a certain endogenous and time-varying probability v e U (t )D t within some small increment D t .Here the coef®cient v is a parameter for the frequency of revaluation of opinion or strategy by the agents (possibly assuming different values for different types of switches),and the function U (t )is a forcing term covering those factors thatare decisive for the pertinent changes of behaviour.The dynamics of our arti®cial market incorporates the following elements:Changes of opinion of the noise traders.These changes,from a pessimistic to an optimistic mood and vice versa,are governed by the development of the `noise'factors:the actual price trend is used as a proxy for the in¯uence of `chartist'practices while herding effects are formalized by computing the majority opinion among noise traders as the (scaled)difference between optimistic and pessimistic individuals.A weighted combination of both factors appears in the U function that governs changes of opinion.If both components are in harmony,a dominant trend of switches will ensue.For example,observation of price increases together with a prevalence of optimistic individuals would be seen as a strong indication of a continuation of a rising market,and would result in a tendency of formerly pessimistic individuals to convert to the optimistic group.Con¯icting signals,of course,would reduce the disposition to follow either the majority opinion or the actual price trend.Switches between the noise traders and the fundamentalists.Such switches are driven by the difference between the (momentary)pro®ts earned by individuals in both groups:pro®ts of noise traders from the optimistic group consist in short-term capital gains due to the price change (or losses in the case of a fall of the market price).Fundamentalists,on the other hand,consider the deviation between price and fundamental value as the source of arbitrage oppor-tunities.The difference between both strategies is that the gains of chartists are immediately realized whereas those claimed by funda-mentalists occur only in the future and depend on the uncertain time for reversal to the fundamental value.To take account of this,fundamentalists'arbitrage pro®ts are discounted by a factor ,1.The difference between pro®ts of both groups enters the U -function in the transition probability,with switches from the fundamentalist group to the (optimistic)noise traders dominating if the pro®tletters to naturePrice and fundamental valueThe 'output': relative price changesThe 'input': relative changes of fundamental value4,0003,0002,0001,000Time4,0003,0002,0001,00004,0003,0002,0001,0000180140100p , p f0.04–0.04r e t .0.04–0.04εp fp abcFigure 1Typical `snapshot'from a longer simulation run.Panel a shows the development with time of both the market price p (solid line)and the fundamental value p f (dotted line).(We have shifted the latter series vertically for better visibility.)Panel b shows returns (log changes of the market price:ret :t ln p t 2ln p t 21 );panel c shows log changes of the fundamental value (e t ln p f ;t 2ln p f ;t 21 ),respectively;both series have been computed from the time series shown in a .The increments of ln(p f )follow a normal distribution.differential is in favour of the latter group and vice versa.For comparison of pro®ts between pessimistic noise traders and funda-mentalists,the point of view has to be changed appropriately:because the former rush out of the market in order to avoid losses,their gain is given by the difference between the average pro®t rate from alternative investments (assumed to be constant)minus the price change (which,when negative,amounts to a capital loss)of the asset they sell.Again,a pro®t differential in favour of one of the two groups tends to induce changes of behaviour among members of the other group.Price changes.These are endogenous responses of the market to imbalances between demand and supplyÐexcess demand (supply)leading to an increase (decrease)of the prevailing price.Demand and supply,however,originate from the decisions of our agents:assuming a constant average trading volume of noise traders,their demand and supply is readily determined by the actual numbers of optimistic and pessimistic individuals.Fundamentalists'sensitivity to the relative deviation of the price from the fundamental value,on the other hand,amounts to an excess demand of this group depending on the difference p 2p f .Overall excess demand is the sum of both components.Changes of fundamental value.These constitute the external driving force which affects the market through the operations of funda-mentalist traders.In order to ensure that none of the typical characteristics of ®nancial prices can be traced back to exogenous factors,we assume that the relative changes of p f are Gaussian random variables,i.e.ln p f ;t 2ln p f ;t 21 e t with e t following a normal distribution with mean zero and time-invariant variance j 2e .A more detailed description of our model and some theoretical results are available as Supplementary Information.Theoretical analysis reveals that stationary states of our dynamics are character-ized by a price which on average equals the fundamental value.Hence,at least in the long term,we have an `ef®cient'market whichincorporates all new information into market prices:no `patholo-gical'situations,with persistent deviations from the economy's fundamentals,occur.A typical simulation (Fig.1a)shows how closely the price tracks the development of the fundamental value.But comparing the time paths of returns extracted from the price path:ret : t ln p t 2ln p t 2t with relative changes of p f (Fig.1b and c)it is evident that the distributional characteristics of e t are not re¯ected in similarly normally distributed returnsÐdespite the close association of the integrated time paths in Fig.1a,the statistical properties of the increments differ fundamentally.In particular,the time series of returns exhibits a higher frequency of extreme events and clustering of volatility.Figure 2shows the differences of the unconditional distributions between the input (logarithm of changes of p f )and the output (relative price changes).As compared with the exponential fall-off of the density of the input,one observes a clear widening of the distribution of large price ¯uctuations which roughly follows a power law.Determining the exponent a of the Pareto distribution for the tails (that is,F ret :.x <cx 2a )from a regression in logarithmic coordinates yields an estimate of 2.64for data with a unit time step;this is in good agreement with results obtained for empirical data at daily frequencies 17,18.However,for returns at lower frequencies (that is,under time aggregation),we also observe a cross-over to the normal distribution with increasing time lag t .The same happens for empirical ®nancial data.Turning to the issue of temporal dependence:we estimated the self-similarity parameter H for both raw returns and absolute returns using the approach of Peng et al.19(Fig.3).For raw returns,differences in scaling behaviour between the input and output time series are small,yielding H 0:49and H 0:48,respectively.This is in accordance with absence of long memory (H 0:5)in empirical ®nancial returns.As a consequence,the degree of pre-dictability of price changes is small.However,the picture changesletters to natureRet.10010–1P r o b . (>|r e t .|)10–510–410–310–210–1100τ=1τ=5τ=15τ=25N(0,1)Figure 2Log-log plot of the complement of the cumulative distribution of returns (ret.)at different levels of time aggregation:ret : t ln p t 2ln p t 2t .All time series are scaled by their sample standard deviation and the positive and negative tails have been merged by using absolute returns.For comparison,the solid line gives the complement of the cumulative distribution of the standard normal distribution on which the scaled changes of the fundamental value,e t ln p f ;t 2ln p f ;t 2t ,would collapse at all levels of aggregation.For the highest frequencies,one observes clear deviations from the exponential decay with approximate power-law scaling.Performing a log-log regression on the largest 30%of the observations,the estimated slope is 22:6460:077at unit time steps (t 1).This is close to results obtained for various ®nancial prices at daily frequencies.Increasing the time step t ,a cross-over to the normal distribution is observed.This is also known to occur with ®nancial data when proceeding from daily frequency to lower (weekly,monthly)frequencies.102103104105Time step10101010310–210–110–210–1100<F (t )><F (t )>Scaling of fluctuation function for absolute returns Scaling of fluctuation function for raw returnsprices linear fitfundamental value linear fitprices linear fitfundamental value linear fitabFigure 3Estimation of self-similarity parameter H .a ,Absolute returns;b ,raw ing the approach of Peng et al.19the exponent H was estimated from the behaviour of the average ¯uctuation h F (t )i of a random variable about its local trend in intervals of size t .The expected behaviour is a power law,h F t i ~t H ,from which H can be extracted performing a regression in log coordinates.Panel b compares the scaling of raw returns and changes of ln(p f ).For the latter,the self-similarity parameter H is estimated to be H 0:4960:03(slope of dashed line),which is close to the theoretically expected value of 0.5for a white-noise process.The scaling of returns yields H 0:4860:003,which differs only slightly from the results for the input.(The curve for p f has been shifted vertically for better visibility.)Panel a depicts the development of the ¯uctuation function of absolute returns.Here we see clear differences between the behaviour of the exogenous force (H 0:5160:004,the slope of the dotted line)and the series of absolute returns,the latter being characterized by strong persistence with estimated H 0:8560:010(solid line).dramatically when considering absolute returns as a measure of volatility.Here we see that the transformed price data behave differently from their counterpart derived from the input series,and exhibit H 0:85which is a sign of strong persistence in volatility.The exponent is again very close to the scaling found for empirical data 6,20.As these scaling properties are absent in the external driving force,they are generated by the interaction of economic agents with heterogeneous beliefs and strategies in our simulated market.Can we explain the emergence of power laws in these simulations?A closer investigation reveals that the alternation between tranquil and turbulent periods comes about through the changes of agents between groups.In particular,in periods of high volatility we also ®nd a large fraction of agents in the noise trader group.Theoretical analysis shows that a critical value for the number of noise traders exists where the system loses its stability.Volatility is above average when the fraction of noise traders comes close to this critical point,or even increases beyond it,for some time.However,the ensuing destabilization is only temporary,and turbulent phases are over-come quickly by endogenous mechanisms:large deviations from the fundamental value are seen as pro®t opportunities by fundamen-talists whose operations then tend to stabilize the market again.This temporal instability is similar to mechanisms found recently in various models in physics where this phenomenon has been denoted on-off intermittency 21±23.As the possibility of temporal destabilization (with ensuing bursts of volatility)exists for an open set of parameter values,the qualitative outcome of our model seems to be extremely robust.This has been con®rmed by simulations with many different parameter sets (data not shown),which all led to endogenous emergence of power-law tails and temporal depen-dence of volatility,albeit with varying coef®cients a and H .MReceived 29October;accepted 27November 1998.1.Mandelbrot,B.The variation of certain speculative prices.J.Bus.35,394±419(1963).2.Fama,E.Mandelbrot and the stable Paretian hypothesis.J.Bus.35,420±429(1963).3.Mantegna,R.N.&Stanley,E.Scaling behaviour in the dynamics of an economic index.Nature 376,46±49(1995).4.Ghashgaie,S.,Breymann,W.,Peinke,J.,Talkner,P .&Dodge,Y.Turbulent cascades in foreignexchange markets.Nature 381,767±770(1996).5.Galluccio,S.,Caldarelli,G.,Marsili,M.&Zhang,Y.-C.Scaling in currency exchange.Physica A 245,423±436(1997).6.Liu,Y.,Cizeau,P .,Meyer,M.,Peng,C.-K.&Stanley,H.E.Correlations in economic time series.Physica A 245,437±440(1997).7.Fama,E.Ef®cient capital markets:a review of theory and empirical work.J.Fin.25,383±417(1970).8.Shleifer,A.&Summers,L.H.The noise trader approach to ®nance.J.Econ.Perspect.4,19±33(1990).9.Palmer,R.G.,Arthur,W.B.,Holland,J.H.,LeBaron,B.&Tayler,P .Arti®cial economic life:a simplemodel for a stockmarket.Physica D 75,264±274(1994).10.Levy,M.,Levy,H.&Solomon,S.Microscopic simulation of the stock market:the effect ofmicroscopic diversity.J.Phys.I (France)5,1087±1107(1995).11.Bak,P .,Paczuski,M.&Shubik,M.Price variations in a stock market with many agents.Physica A 246,430±453(1997).12.Caldarelli,G.,Marsili,M.&Zhang,Y.-C.A prototype model of stock exchange.Europhys.Lett.40,479±484(1997).13.Brock,W.&LeBaron,B.A dynamical structural model for stock return volatility and trading volume.Rev.Econ.Stat.78,94±110(1996).14.Brock,W.&Hommes,C.Rational routes to randomness.Econometrica 65,1059±1095(1997).15.Lux,T.Time variation of second moments from a noise trader/infection model.J.Econ.Dyn.Control22,1±38(1997).16.Lux,T.The socio-economic dynamics of speculative markets:interacting agents,chaos,and the fattails of return anizat.33,143±165(1998).17.Guillaume,D.M.et al .From the bird's eye to the microscope:a survey of new stylized facts of theintra-daily foreign exchange markets.Fin.Stoch.1,95±129(1997).18.Gopikrishnan,P .,Meyer,M.,Amaral,L.A.N.&Stanley,H.E.Inverse cubic law for the distribution ofstock price variations.Eur.Phys.J.B 3,139±140(1998).19.Peng,C.-K.et al .Mosaic organization of DNA nucleotides.Phys.Rev.E 49,1685±1689(1994).20.Lux,T.Long-term stochastic dependence in ®nancial prices:evidence from the German stock market.Appl.Econ.Lett.3,701±706(1996).21.Platt,N.,Spiegel,E.A.&Tresser,C.On-off intermittency:a mechanism for bursting.Phys.Rev.Lett.70,279±282(1993).22.Haegy,J.F.,Platt,N.&Hammel,S.M.Characterization of on-off intermittency.Phys.Rev.E 49,1140±1150(1994).23.Youssefmir,M.&Huberman,B.Clustered volatility in multiagent dynamics.J.Econ.Behav.Organizat.32,101±118(1997).Supplementary information is available on Nature 's World-Wide Web site ()or as paper copy from the London editorial of®ce of Nature .Acknowledgements.Financial support by Deutsche Forschungsgemeinschaft,Sonderforschungsbereich 303at the University of Bonn is acknowledged.Correspondence and requests for materals should be addressed to T.L.(e-mail:lux@iiw.uni-bonn.de).letters to natureA single-photon turnstile deviceJ.Kim *,O.Benson *,H.Kan ²&Y .Yamamoto *³*ERATO Quantum Fluctuation Project,Edward L.Ginzton Laboratory,Stanford University,Stanford,California 94305,USA²ERATO Quantum Fluctuation Project,Hamamatsu Photonics Inc.,Hamamatsu,Shizuoka,434-0041,Japan³NTT Basic Research Laboratories,3-1Morinosato-Wakamiya Atsugi,Kanagawa,243-01,Japan.........................................................................................................................Quantum-mechanical interference between indistinguishable quantum particles profoundly affects their arrival time and counting statistics.Photons from a thermal source tend to arrive together (bunching)and their counting distribution is broader than the classical Poisson limit 1.Electrons from a thermal source,on the other hand,tend to arrive separately (anti-bunch-ing)and their counting distribution is narrower than the classical Poisson limit 2±4.Manipulation of quantum-statistical properties of photons with various non-classical sources is at the heart of quantum optics:features normally characteristic of fermionsÐsuch as anti-bunching,sub-poissonian and squeezing (sub-shot-noise)behavioursÐhave now been demonstrated 5.A single-photon turnstile device was proposed 6±8to realize an effect similar to conductance quantization.Only one electron can occupy a single state owing to the Pauli exclusion principle and,for an electron waveguide that supports only one propagating transverse mode,this leads to the quantization of electrical conductance:the conductance of each propagating mode is then given by G Q e 2=h (where e is the charge of the electron and h is Planck's constant;ref.9).Here we report experimental progress towards generation of a similar ¯ow of single photons with a well regulated time interval.When a light-emitting p±n junction is driven with a high-impedance constant-current source,injection of electron±hole pairs can be regulated to below the classical shot-noise limit and light with sub-shot-noise intensity ¯uctuations can be generated 10.This is possible because the inelastic scattering of electrons in a highly dissipative resistor can suppress the current noise by means of the Pauli exclusion principle 11,12,and the Coulomb repulsive interaction between electrons in a p±n junction can suppress the electron injection noise by way of the collective Coulomb blockade effect 13±15.In these squeezing experiments with a macroscopic p±n junction,however,only large numbers of photons (of the order of ,108)can be regulated owing to a small single charging energy.It has been demonstrated in mesoscopic physics that an ultra-small tunnel junction regulates the electron transport one by one owing to a single charging energy that is large compared to the thermal background energy 16±18.If such a single-electron control technique could be extended to simultaneous control of electron and hole in a p±n junction,a single photon would be regularly emitted,one by one 6.Our single-photon turnstile device utilizes simultaneous Coulomb blockade for electrons and holes in a mesoscopic double barrier p±n junction (Fig.1a).The structure consists of an intrinsic central quantum well (QW)in the middle of a p±n junction and the n-type and p-type side QWs isolated by tunnel barriers from the central QW.The lateral size of the device is reduced to increase the single charging energy e 2/2C i ,where C i (i is n or p)is the capacitance between the central QW and the i -side QW.At a certain bias voltage V 0,the conditions for electron resonant tunnelling are ful®lled,and the m th electron can tunnel into an electron sub-band in the central QW.When the m th electron tunnels,the Coulomb repulsive interaction between electrons shifts。
基于BERT-MSCNN_的同行评议情感分类研究

第 22卷第 8期2023年 8月Vol.22 No.8Aug.2023软件导刊Software Guide基于BERT-MSCNN的同行评议情感分类研究武壮1,2,晁荣志1,2,陈湘国1,2,魏忠诚1,2,赵继军1,2(1.河北工程大学信息与电气工程学院;2.河北省安防信息感知与处理重点实验室,河北邯郸 056038)摘要:为分析同行评议文本的情感极性,有效避免人工评分存在的主观性问题,提出一种多尺度卷积神经网络与通道注意力机制相结合的BERT-MSCNN情感分类模型。
首先,利用爬虫从OpenReview平台上爬取ICLR会议的公开论文评审数据并翻译为中文,构建同行评议数据集;其次,采用BERT预训练完成输入语句的词向量化,通过多尺度卷积神经网络提取局部语义特征;最后,引入挤压—激励网络SENet对特征通道进行权值标定,从而加强对特征的提取,提高模型分类效果。
实验结果表明,该文提出的模型能够有效对论文同行评议数据进行情感分类,其准确度可达78.12%,与现有多种基于CNN和LSTM的文本分类方法相比,均具有更高的识别率。
关键词:同行评议;情感分类;深度学习;卷积网络;通道注意力DOI:10.11907/rjdk.221955开放科学(资源服务)标识码(OSID):中图分类号:TP391.1 文献标识码:A文章编号:1672-7800(2023)008-0054-05Research on Peer Review Sentiment Classification Based on BERT-MSCNN WU Zhuang1,2, CHAO Rongzhi1,2, CHEN Xiangguo1,2, WEI Zhongcheng1,2, ZHAO Jijun1,2(1.School of Information and Electrical Engineering, Hebei University of Engineering;2.Hebei Key Laboratory of Security Information Perception and Processing, Handan 056038,China)Abstract:In order to analyze the emotional polarity of peer-reviewed texts and balance the subjectivity of manual scoring, a BERT-MSCNN sentiment classification model combining multi-scale convolutional neural network and channel attention mechanism is proposed. Firstly, the crawler is used to crawl the public paper review data of ICLR conference from the OpenReview platform and translate it into Chinese to con⁃struct a peer review data set. Secondly, BERT pre-training is used to complete the word vectorization of the input statement, and local seman⁃tic features are extracted by multi-scale convolutional neural network. Finally, the extrusion-excitation network SENet is introduced to cali⁃brate the feature channels, so as to enhance the feature extraction and improve the classification effect of the model. The experimental results show that the proposed model can effectively classify the sentiment of peer review data, and its accuracy can reach 78.12%. Compared with the existing text classification methods based on CNN and LSTM, it has higher recognition rate.Key Words:peer review; sentiment classification; deep learning; convolutional network; channel attention0 引言同行评议是评估论文质量的有效途径,通常由外单位专家对论文的正确性、严谨性和创新性等重要指标进行详细评估,最终给出评审意见及相应评审分数,以甄别并过滤低质量的论文。
二语习得(L2)

Theories of habit formation were theories of learning in general. They could be and were applied to language learning.(L1 acquisition →imitating utterances, SLA could process in a similar way). Imitation and reinforcement were the means by which the learner identified the stimulus-response associations that constituted the habits of the L2. Habit-formation theory dominated discussion of both first and second language acquisition up to the 1960’s for it provides a theoretical account of how the learner’s L1 intruded into the process of SLA.
Introduction
Some popular believes Second language acquisition (SLA) is strongly influenced by the learner’s first language(L1). The role of L1 in SLA is a negative one. That is, the L1 gets in the way or interferes with the learning of the L2, such that features of the L1 are transferred into the L2.
焊接温度场和应力场的数值模拟

本文由老高咯贡献pdf文档可能在WAP端浏览体验不佳。
建议您优先选择TXT,或下载源文件到本机查看。
沈阳工业大学硕士学位论文焊接温度场和应力场的数值模拟姓名:王长利申请学位级别:硕士专业:材料加工工程指导教师:董晓强 20050310沈阳工业大学硕士学位论文摘要焊接是一个涉及电弧物理、传热、冶金和力学的复杂过程。
焊接现象包括焊接时的电磁、传热过程、金属的熔化和凝固、冷却时的相变、焊接应力和变形等。
一旦能够实现对各种焊接现象的计算机模拟,我们就可以通过计算机系统来确定焊接各种结构和材料的最佳设计、最佳工艺方法和焊接参数。
本文在总结前人的工作基础上系统地论述了焊接过程的有限元分析理论,并结合数值计算的方法,对焊接过程产生的温度场、应力场进行了实时动态模拟研究,提出了基于ANSYS软件为平台的焊接温度场和应力场的模拟分析方法,并针对平板堆焊问题进行了实例计算,而且计算结果与传统结果和理论值相吻合。
本文研究的主要内容包括:在计算过程中材料性能随温度变化而变化,属于材料非线性问题;选用高斯函数分布的热源模型,利用函数功能实现热源的移动。
建立了焊接瞬态温度分布数学模型,解决了焊接热源移动的数学模拟问题;通过改变单元属性的方法,解决材料的熔化、凝固问题;对焊缝金属的熔化和凝固进行了有效模拟,解决了进行热应力计算收敛困难或不收敛的问题;对焊接过程产生的应力进行了实时动态模拟,利用本文模拟分析方法,可以对焊接过程的热应力及残余应力进行预测。
本文建立了可行的三维焊接温度场、应力场的动态模拟分析方法,为优化焊接结构工艺和焊接规范参数,提供了理论依据和指导。
关键词:焊接,数值模拟,有限元,温度场,应力场沈阳工业大学硕士学位论文SimulationofweldingtemperaturefieldandstressfieldAbstractWeldingisacomplicatedphysicochemica/processwlfiehinvolvesinelectromagnetism,Mattransferring,metalmeltingandfreezing,phase?changeweldingSOstressanddeformationandon,Inordertogethighquafityweldingstmcttlre,thesefactorshavetobecontrolled.Ifcanweldingprocessbesimulatedwithcomputer,thebestdesign,pmceduremethodandoptimumweldingparametercanbeobtained.BasedOilsummingupother’Sexperience,employingnumericalcalculationmethod,thispaperresearchersystemicallydiscussesthefiniteelementanal删systemoftheweldingprocessbyrealizingthe3Ddynamicsimulationofweldingtemperaturefieldandstressfield,thenusestheresearchresulttosimulatetheweldingprocessofboardsurfacingbyFEMsoftANSYS.Atthetheoryresult.sametime.thecalculationresultaccordswithtraditionalanalysisresultandThemaincontentsofthepaperareasfollowing:thecalculationinweldingprocessisamaterialnonlinearprocedurethatthematerialpropertieschangethefunctionofGaussaswiththetemperature;chooseheatsourcemodel.usethefunctioncommandtoapplyloadofmovingheatS012Ie-2.AmathematicmodeloftransientthermalprocessinweldingisestablishedtosimulatethemovingoftheheatsoBrce.Theeffectsofmeshsize,weldingspeed,weldingcurrentandeffectiveradiuselectricarcontemperaturefielda比discussed.Theproblemofthefusionandsolidificationofmaterialhasbeensolvedbythemethodofchangingtheelementmaterial.Theproblemoftheconvergencedifficultyortheun—convergenceduringthecalculatingofthethermalslTessissolved;throughreal-timedynamicsimulationofthestressproducedinweldingprocess,thethermalstressandresidualSll℃SSinweldingcanbepredictedbyusingthesimulativeanalysismethodinthispaper.Inthispaper,afeasibleslIessdyn黜fiesimulationmethodon3Dweldingtemperaturefield,onfieldhadbeenestablished,whichprovidestheoryfoundationandinstructionoptimizingtheweldingtechnologyandparameters.KEYWORD:Welding,NumericalSimulation,Finiteelement,Temperaturefield,Stressfield.2.独创性说明本人郑重声明:所呈交的论文是我个人在导师指导下进行的研究工作及取得的研究成果。
中国儿童早期英语否定转移习得

图解决以下两个问题:(
1)本个案中的中 国 儿 童 英 语 否 定 转 移 习 得 情 况 是 什 么? (
2)本 个 案 中 的
中国儿童英语否定转移习得机制特别是习得错误的产生与演变机制是什么? 本文 期 望 有 助 于 解
决的问题。儿童在刚开始接触英语时面临的困难和问题,正是照看者与老师最 关 心、最 迫 切 需 要
解决的问题。因此,收集我国儿童的英 语 习 得 真 实 语 料,有 助 于 探 究 我 国 儿 童 英 语 习 得 规 律,从
而提高中国儿童早期英语习得效率、避免习得错误,对后续英语学习具有积极的促进作用。
进行时长 13 个月的纵向追踪,建立语料库 分 6 个 阶 段 进 行 研 究。 结 果 显 示,中 国 儿 童 的 英 语 否 定 转 移 习
得以高频典型范例为基础逐渐扩张,儿童 二 语 习 得 遵 循 基 于 高 频 典 型 范 例 的 习 得 机 制。 中 国 儿 童 在 早 期
英语否定转移中出现习得错误,源于一种“固 化、杂 糅、连 带 固 化 机 制 ”,在 语 言 习 得 过 程 中,频 率 会 带 来 固
241
[ ]
问题。在对英语否定转移的规则描写中,最具代 表 性 的 是 Qu
i
rk 等 11 对 英 语 中 允 许 否 定 转 移 的
动词归类:观点(
an
t
i
c
i
t
e,
besuppo
s
edt
o,
be
l
i
eve,
c
a
l
分等级大微孔、介孔大孔
ARTICLEOPENReceived11Dec2012|Accepted16May2013|Published14Jun2013A solid with a hierarchical tetramodalmicro-meso-macro pore size distributionYu Ren1,Zhen Ma2,3,Russell E.Morris1,Zheng Liu1,Feng Jiao4,Sheng Dai3&Peter G.Bruce1Porous solids have an important role in addressing some of the major energy-related pro-blems facing society.Here we describe a porous solid,a-MnO2,with a hierarchical tetramodalpore size distribution spanning the micro-,meso-and macro pore range,centred at0.48,4.0,18and70nm.The hierarchical tetramodal structure is generated by the presence ofpotassium ions in the precursor solution within the channels of the porous silica template;thesize of the potassium ion templates the microporosity of a-MnO2,whereas theirreactivity with silica leads to larger mesopores and macroporosity,without destroying themesostructure of the template.The hierarchical tetramodal pore size distribution influencesthe properties of a-MnO2as a cathode in lithium batteries and as a catalyst,changingthe behaviour,compared with its counterparts with only micropores or bimodalmicro/mesopores.The approach has been extended to the preparation of LiMn2O4with ahierarchical pore structure.1EaStCHEM,School of Chemistry,University of St Andrews,St Andrews KY169ST,UK.2Shanghai Key Laboratory of Atmospheric Particle Pollution and Prevention(LAP3),Department of Environmental Science and Engineering,Fudan University,Shanghai200433,China.3Chemical Sciences Division,Oak Ridge National Laboratory,Oak Ridge,T ennessee37831,USA.4Department of Chemical and Biomolecular Engineering,University of Delaware,Newark,Delaware19716,USA.Correspondence and requests for materials should be addressed to P.G.B.(email:p.g.bruce@).P orous solids have an important role in addressing some of the major problems facing society in the twenty-first century,such as energy storage,CO2sequestration,H2 storage,therapeutics(for example,drug delivery)and catalysis1–8. The size of the pores and their distribution directly affect their ability to function in a particular application2.For example, zeolites are used as acid catalysts in industry,but their micropores impose severe diffusion limitations on the ingress and egress of the reactants and the catalysed products9.To address such issues, great effort is being expended in preparing porous materials with a bimodal(micro and meso)pore structure by synthesizing zeolites or silicas containing micropores and mesopores10–17,or microporous metal–organic frameworks with ordered mesopores18.Among porous solids,porous transition metal oxides are particularly important,because they exhibit many unique properties due to their d-electrons and the variable redox state of their internal surfaces8,19–22.Here we describe thefirst solid(a-MnO2)possessing hierarchical pores spanning the micro,meso and macro range, centred at0.48,4.0,18and70nm.The synthesis method uses mesoporous silica as a hard template.Normally such a template generates a mesoporous solid with a unimodal23–31or,at most,a bimodal pore size distribution32–38.By incorporating Kþions in the precursor solution,within the silica template,the Kþions act bifunctionally:their size templates the formation of the micropores in a-MnO2,whereas their reactivity with silica destroys the microporous channels in KIT-6comprehensively, leading to the formation of a-MnO2containing large mesopores and,importantly,macropores,something that has not been possible by other methods.Significantly,this is achieved without destroying the silica template by alkaline ions.The effect of the tetramodal pore structure on the properties of the material is exemplified by considering their use as electrodes for lithium-ion batteries and as a catalyst for CO oxidation and N2O decomposition.The novel material offers new possibilities for combining the selectivity of small pores with the transport advantages of the large pores across a wide range of sizes.We also present results demonstrating the extension of the method to the synthesis of LiMn2O4with a hierarchical pore structure.ResultsComposition of tetramodal a-MnO2.The composition of the synthesized material was determined by atomic absorption ana-lysis and redox titration to be K0.08MnO2(the K/Mn ratio of the precursor solution was1/3).The material is commonly referred to as a-MnO2,because of the small content of Kþ19.N2sorption analysis of tetramodal a-MnO2.The tetramodal a-MnO2shows a type IV isotherm(Fig.1a).The pore size dis-tribution(Fig.1b)in the range of0.3–200nm was analysed using the density functional theory(DFT)method applied to the adsorption branch of the isotherm39–42,as this is more reliable than analysing the desorption branch43;note that this is not the DFT method used in ab initio electronic structure calculations. Plots were constructed with vertical axes representing ‘incremental pore volume’and‘incremental surface area’.Large (macro)pores can account for a significant pore volume while representing a relatively smaller surface area and vice versa for small(micro)pores.Therefore,when investigating a porous material with a wide range of pore sizes,for example,micropore and macropore,the combination of surface area and pore volume is essential to determine the pore size distribution satisfactorily (Fig.1b).Considering both pore volume and surface area, significant proportions of micro-,meso-and macropores are evident,with distinct maxima centred at0.70,4.0,18and70nm.To probe the size of the micropores more precisely than is possible with DFT,the Horvath–Kawazoe pore size distribution analysis was employed44.A single peak was obtained at0.48nm(Fig.1c),in good accord with the0.46-nm size of the2Â2channels of a-MnO2 (refs.19,21).The relatively small Brunauer–Emmett–Teller(BET) surface area of tetramodal a-MnO2(79–105m2gÀ1; Supplementary Table S1)compared with typical surface areas of mesoporous metal oxides(90–150m2gÀ1)45is due to the significant proportion of macropores(which have small surface areas)and relatively large(18nm)mesopores—a typical mesoporous metal oxide has only3–4nm pores.TEM analysis of tetramodal a-MnO2.Transmission electron microscopic(TEM)data for tetramodal a-MnO2,Fig.2, demonstrates a three-dimensional pore structure with a sym-metry consistent with space group Ia3d.From the TEM data,an a0lattice parameter of23.0nm for the mesostructure could be extracted,which is in good agreement with the value obtained from the low-angle powder X-ray diffraction(PXRD)data, a0¼23.4nm(Supplementary Fig.S1a).High-resolution TEM images in Fig.2c–e demonstrate that the walls are crystalline with a typical wall thickness of10nm.The lattice spacings of0.69,0.31 and0.35nm agree well with the values of6.92,3.09and3.46Åfor the[110],[310]and[220]planes of a-MnO2(International Centre for Diffraction Data(ICDD)number00-044-0141), respectively.The wide-angle PXRD data matches well with the PXRD data of bulk cryptomelane a-MnO2(Supplementary Fig. S1b),confirming the crystalline walls.The various pores in tetramodal a-MnO2can be observed by TEM directly:the0.48-nm micropores are seen in Fig.2e(2Â2 tunnels with dimensions of0.48Â0.48nm in the white box);the 4.0-nm pores are shown in Fig.2b–d;the18-nm pores are shown in Fig.2a;the70-nm pores are evident in Fig.2b(highlighted with white circles).Li intercalation.Li can be intercalated into bulk a-MnO2 (ref.46).Therefore,it is interesting to compare Li intercalation into bulk a-MnO2(micropores only)and bimodal a-MnO2 (micropores along with a single mesopore of diameter3.6nm,see Methods)with tetramodal a-MnO2(micro-,meso-and macropores).Each of the three a-MnO2materials was subjected to Li intercalation by incorporation as the positive electrode in a lithium battery,along with a lithium anode and a non-aqueous electrolyte(see Methods).The results of cycling(repeated intercalation/deintercalation of Li)the cells are shown in Fig.3. Although all exhibit good capacity to cycle Li at low rates of charge/discharge(30mA gÀ1),tetramodal a-MnO2shows sig-nificantly higher capacity(Li storage)at a high rate of 6,000mA gÀ1(corresponding to charge and discharge in3min). The tetramodal a-MnO2can store three times the capacity(Li) compared with bimodal a-MnO2,and18times that of a-MnO2 with only micropores,at the high rate of intercalation/deinter-calation(Fig.3).The superior rate capability of tetramodal a-MnO2over microporous and bimodal forms may be assigned to better Liþtransport in the electrolyte within the hierarchical pore structure of tetramodal a-MnO2.The importance of elec-trolyte transport in porous electrodes has been discussed recently35,47,48and the results presented here reinforce the beneficial effect of a hierarchical pore structure.Catalytic studies.CO oxidation and N2O decomposition were used as reactions to probe the three different forms of a-MnO2as catalysts(Supplementary Fig.S2).As shown in Supplementary Fig.S2a,tetramodal a-MnO2demonstrates better catalytic activity compared with only micropores or bimodal a-MnO2;thetemperature of half CO conversion (T 50)was 124°C for tetra-modal a -MnO 2,whereas microporous and bimodal a -MnO 2exhibited a T 50value of 275°C and 209°C,respectively.In the case of N 2O decomposition,a -MnO 2with only micropores demonstrated no catalytic activity in the range of 200–400°C,in accord with a previous report 49.Tetramodal and bimodal a -MnO 2showed catalytic activity and reached 32%and 20%of N 2O conversion,respectively,at a reaction temperature of 400°C.The differences in catalytic activity are related to the differences in the material.A detailed study focusing on the catalytic activity alonewould be necessary to demonstrate which specific features of the textural differences (pore size distribution,average manganese oxidation state,K þand so on)between the different MnO 2materials are responsible for the differences in behaviour.However,the preliminary results shown here do illustrate that such differences exist.Porous LiMn 2O 4.To demonstrate the wider applicability of the synthesis method,LiMn 2O 4with a hierarchical pore structurewas1801601401201008060402000.00.20.40.60.81.0V (c m 3 g –1)Pore diameter (nm)0.0120.0100.0080.0060.0040.0020.000I n c r e m e n t a l p o r e v o l u m e (c m 3 g –1)Pore width (nm)I n c r e m e n t a l s u r f a c e a r e a (m 2 g –1)I n c r e m e n t a l s u r f a c e a r e a (m 2 g –1)P /P 0Figure 1|N 2sorption analysis of tetramodal a -MnO 2.(a )N 2adsorption–desorption isotherms,(b )DFT pore size distribution and (c )Horvath–Kawazoe pore size distribution from N 2adsorption isotherm for tetramodal a -MnO 2.Figure 2|TEM images of tetramodal a -MnO 2.TEM images along (a )[100]direction,showing 18nm mesopores (scale bar,50nm);(b )4.0and 70nm pores (70nm pores are highlighted by white circles;scale bar,100nm);(c –e )high-resolution (HRTEM)images of tetramodal a -MnO 2showing 4.0and 0.48nm pores (scale bar,10nm).Inset is representation of a -MnO 2structure along the c axis,demonstrating the 2Â2micropores as shown in the HRTEM (white box)in e .Purple,octahedral MnO 6;red,oxygen;violet,potassium.synthesized in a way similar to that of tetramodal a -MnO 2.The main difference is the use of LiNO 3instead of KNO 3(see Methods).In this case,Li þreacts with the silica template col-lapsing/blocking the microporous channels in the KIT-6and resulting in the large mesopores and macropores (17and 50nm)in the LiMn 2O 4obtained.The use of Li þinstead of the larger K þdeters the formation of micropores because Li þis too small.TEM analysis illustrates the hierarchical pore structure of LiMn 2O 4(Supplementary Fig.S3):4.0nm pores are evident in Supplementary Fig.S3b;17nm pores in Supplementary Fig.S3a;and 50nm pores in Supplementary Fig.S3b (highlighted with white circles).The d-spacing of 0.47nm in the high-resolution TEM image (Supplementary Fig.S3c)is in good accordance with the values of 0.4655nm for the [111]planes of LiMn 2O 4(ICDD number 00-038-0789)and with the wide-angle PXRD data (Supplementary Fig.S4).The original DFT pore size distribution analysis from N 2sorption (adsorption branch)gives three pore sizes in the range of 1–100nm centred at 4.0,17and 50nm (Supplementary Fig.S5).A more in-depth presentation of the results for LiMn 2O 4will be given in a future paper;preliminary results presented here illustrate that the basic method can be applied beyond a -MnO 2.DiscussionTurning to the synthesis of the tetramodal a -MnO 2,the details are given in the Methods section.Hard templating using silica templates,such as KIT-6,normally gives rise to materials with unimodal or,at most,bimodal mesopore structures,and in the latter case the smaller mesopores dominate over the larger mesopores 8,32,35.Alkali ions are excellent templates for micropores in transition metal oxides 19,21,but they have been avoided in nanocasting from silica templates because of concerns that they would react with and,hence,destroy thesilica20018016014012010080604020D i s c h a r g e c a p a c i t y (m A h g –1)0Cycle numberx in Li x MnO 2Figure 3|Electrochemical behaviour of different a -MnO 2.Capacity retention for tetramodal a -MnO 2cycled at 30(empty blue circles)and 6,000mA g À1(filled blue circles);bulk a -MnO 2cycled at 30(empty red squares)and 6,000mA g À1(filled red squares);bimodal a -MnO 2cycled at 30(empty black triangle)and 6,000mA g À1(filled blacktriangles).18 nm pores70 nm poresTwo sets of mesoporeschannels connecting both sets of mesoporesEtching of silica Etching of silica Etching of silica template2discontinuously within one set of the KIT-6mesoporesFigure 4|Formation mechanism of meso and macropores in tetramodal a -MnO 2.When both KIT-6mesochannels are occupied by a -MnO 2and then the silica between them etched away,the remaining pore is 4nm (centre portion of figure).When a -MnO 2grows in only one set of mesochannels and then the KIT-6is dissolved away,the remaining metal oxide has 18nm pores (upper portion of figure).The comprehensive destruction of the microchannels in KIT-6by K þleads to a -MnO 2growing in only a proportion of one set of the KIT-6mesochannels,resulting in the formation of B 70nm pores (lower portion of figure).template50.Here,not only have alkali ions been used successfully in precursor solutions without destroying the template mesostructure but they give rise to macropores in the a-MnO2, thus permitting the synthesis of a tetramodal,micro-small,meso-large,meso-macro pore structure.Synthesis begins by impregnating the KIT-6silica template with a precursor solution containing Mn2þand Kþions.On heating,the Kþions template the formation of the micropores in a-MnO2,as the latter forms within the KIT-6template.KIT-6 consists of two interpenetrating mesoporous channels linked by microporous channels51–53.The branches of the two different sets of mesoporous channels in KIT-6are nearest neighbours separated by a silica wall of B4nm53;therefore,when both KIT-6mesochannels are occupied by a-MnO2and the silica between them etched away,the remaining pore is4nm(see centre portion of Fig.4).It has been shown previously,by a number of authors,that by varying the hydrothermal conditions used to prepare the KIT-6,the proportion of the microchannels can be decreased to some extent,thus making it difficult to simultaneouslyfill the neighbouring KIT-6mesoporous channels by the precursor solution of the target mesoporous metal oxide33–35.As a result,the target metal oxide grows in only one set of mesochannels of the KIT-6host but not both.When the KIT-6is dissolved away,the remaining metal oxide has B18nm pores,because the distance between adjacent branches of the same KIT-6mesochannels is greater than between the two different mesochannels in KIT-6.Here we propose that the Kþions have a similar effect on the KIT-6to that of the hydrothermal synthesis,but by a completely different mechanism.Reaction between the Kþions in the precursor solution with the silica during calcination results in the formation of Kþ-silicates,which cause collapse or blocking of the microporous channels in KIT-6,such that the a-MnO2grows in one set of the KIT-6mesochannels,giving rise to18nm pores in a-MnO2when the silica is etched away,see top portion of Fig.4. However,the reaction between Kþand the silica is more severe than the effect of varying the hydrothermal treatment.In the former case,the KIT-6microchannels are so comprehensively destroyed that the proportion of the large(18nm)to smaller (4nm)mesopores is greater than can be achieved by varying hydrothermal conditions.The comprehensive destruction of the microchannels in KIT-6by Kþ,perhaps augmented by some minor degradation of parts of the mesochannels,leads to a-MnO2 growing in only a proportion of one set of the KIT-6 mesochannels,resulting in the formation of B70nm pores in a-MnO2,see lower portion of Fig.4.In summary,the Kþreactivity with the silica goes beyond what can be achieved by varying the conditions of hydrothermal synthesis and is responsible for generating the tetramodal pore size distribution reported here. The mechanism of pore formation in a-MnO2by reaction between Kþand the silica template is supported by several findings.First,by the lower K/Mn molar ratio of thefinal tetramodal a-MnO2product(0.08)compared with the starting materials(0.33)implies that some of the Kþions in the impregnating solution have reacted with the silica.Second, support for collapse/blocking of the microporous channels in KIT-6due to reaction with Kþwas obtained by comparing the texture of KIT-6impregnated with an aqueous solution contain-ing only KNO3and calcined at300and500°C.The micropore volume in KIT-6is the greatest,with no KNO3in the solution;it then decreases continuously as the calcination temperature and calcination time is increased,such that after2and5h at500°C the micropore volume has decreased to zero(Supplementary Fig. S6).Third,we prepared tetramodal a-MnO2using a similar synthetic procedure to that described in the Methods section, except that this time we used a covered tall crucible for the calcination step.Sun et al.54have shown that using a covered,tall crucible when calcining results in porous metal oxides with much larger particle sizes.If the70-nm pores had arisen simply from the gaps between the particles,then the pore size would have changed;in contrast,it remained centred at70nm, Supplementary Fig.S7,consistent with the70-nm pores being intrinsic to the materials and arising from reaction with the Kþas described above.Fourth,if the synthesis of MnO2is carried out using the KIT-6template but in the absence Kþions,then the DFT pore size distribution shown in Supplementary Fig.S8is obtained.The0.48-and70-nm pores are now absent,but the4-and18-nm pores remain.This demonstrates the key role of Kþin the formation of the smallest and largest pores and,hence,in generating the tetramodal pore size distribution.The absence of Kþmeans that there is nothing to template the0.48nm pores and so a-MnO2is not formed;the b-polymorph is obtained instead.The absence of Kþalso means that the microchannels in the KIT-6template remain intact,resulting in no70nm pores and the dominance of the4-nm pores compared with the 18-nm pores.The hierarchical pore structure can be varied systematically by controlling the synthesis conditions,in particular the Kþ/Mn ratio of the precursor solution.A range of Kþ/Mn ratios,1/5,1/3and1/2,gave rise to a series of pore size distributions,in which the pore sizes remained the same but the relative proportions of the different pores varied (Supplementary Table S1).The higher the Kþ/Mn ratio,the greater the proportion of macropores and large mesopores.This is in accord with expectations,as the higher the Kþconcentra-tion in the precursor solution the greater the collapse/blocking of the microporous channels in the KIT-6(as noted above),and hence the greater the proportion of macropores and large mesopores.Indeed,these results offer further support for the mechanism of pore size distribution arising from reaction between Kþand the silica template.In conclusion,tetramodal a-MnO2,thefirst porous solid with a tetramodal pore size distribution,has been synthesized.Its hierarchical pore structure spans the micro,meso and macropore range between0.3and200nm,with pore dimensions centred at 0.48,4.0,18and70nm.Key to the synthesis is the use of Kþions that not only template the formation of micropores but also react with the silica template,therefore,breaking/blocking the micro-porous channels in the silica template far more comprehensively than is possible by varying the hydrothermal synthesis conditions, to the extent that macropores are formed,and without destroying the silica mesostructure by alkali ions,as might have been expected.The resulting hierarchical tetramodal structure demon-strates different behaviours compared with microporous and bimodal a-MnO2as a cathode material for Li-ion batteries,and when used as a catalyst for CO oxidation and N2O decomposi-tion.The method has been extended successfully to the preparation of hierarchical LiMn2O4.MethodsSynthesis.Tetramodal a-MnO2(surface area96m2gÀ1,K0.08MnO2)was pre-pared by two-solvent impregnation55using Kþand mesoporous silica KIT-6as the hard template.KIT-6was prepared according to a previous report (hydrothermal treatment at100°C)51.In a typical synthesis of tetramodal a-MnO2, 7.53g of Mn(NO3)2Á4H2O(98%,Aldrich)and1.01g of KNO3(99%,Aldrich)were dissolved in B10ml of water to form a solution with a molar ratio of Mn/K¼3.0. Next,5g of KIT-6was dispersed in200ml of n-hexane.After stirring at room temperature for3h,5ml of the Mn/K solution was added slowly with stirring.The mixture was stirred overnight,filtered and dried at room temperature until a completely dried powder was obtained.The sample was heated slowly to500°C (1°C minÀ1),calcined at that temperature for5h with a cover in a normal crucible unless is specified54and the resulting material treated three times with a hot aqueous KOH solution(2.0M),to remove the silica template,followed by washing with water and ethanol several times,and then drying at60°C.Bimodal a-MnO2(surface area58m2gÀ1,K0.06MnO2)with micropore and a single mesopore size of3.6nm was prepared by using mesoporous silica SBA-15as a hard template.The SBA-15was prepared according to a previous report56.Bulk a-MnO2(surface area8m2gÀ1,K0MnO2)was prepared by the reaction between325mesh Mn2O3(99.0%,Aldrich)and6.0M H2SO4solution at80°C for 24h,resulting in the disproportionation of Mn2O3into a soluble Mn2þspecies and the desired a-MnO2product46.Treatment of KIT-6with KNO3was carried out as follows:1.01g of KNO3was dissolved in B15ml of water to form a KNO3solution.Five grams of mesoporous KIT-6was dispersed in200ml of n-hexane.After stirring at room temperature for 3h,5ml of KNO3solution was added slowly with stirring.The mixture was stirred overnight,filtered and dried at room temperature until a completely dried powder was obtained.The sample was heated slowly to300or500°C(1°C minÀ1), calcined at that temperature for5h and the resulting material was washed with water and ethanol several times,and then dried at60°C overnight.The synthesis method for hierarchical porous LiMn2O4was similar to that of tetramodal a-MnO2.The main difference was to use1.01g of LiNO3instead of KNO3.After impregnation into KIT-6,calcination and silica etching,porous LiMn2O4was obtained.Characterization.TEM studies were carried out using a JEOL JEM-2011, employing a LaB6filament as the electron source,and an accelerating voltage of 200keV.TEM images were recorded by a Gatan charge-coupled device camera in a digital format.Wide-angle PXRD data were collected on a Stoe STADI/P powder diffractometer operating in transmission mode with Fe K a1source radiation(l¼1.936Å).Low-angle PXRD data were collected using a Rigaku/MSC,D/max-rB with Cu K a1radiation(l¼1.541Å)operating in reflection mode with a scintillation detector.N2adsorption–desorption analysis was carried out using a Micromeritics ASAP2020.The typical sample weight used was100–200mg. The outgas condition was set to300°C under vacuum for2h,and all adsorption–desorption measurements were carried out at liquid nitrogen tem-perature(À196°C).The original DFT method for the slit pore geometry was used to extract the pore size distribution from the adsorption branch usingthe Micromeritics software39–42.A Horvath–Kawazoe method was used to extract the microporosity44.Mn and K contents were determined by chemical analysis using a Philips PU9400X atomic adsorption spectrometer.The average oxidation state of framework manganese in a-MnO2samples was determined by a redoxtitration method57.Electrochemistry.First,the cathode was constructed by mixing the active material (a-MnO2),Kynar2801(a copolymer based on polyvinylidenefluoride),and Super S carbon(MMM)in the weight ratio80:10:10.The mixture was cast onto Al foil (99.5%,thickness0.050mm,Advent Research Materials,Ltd)from acetone using a Doctor-Blade technique.After solvent evaporation at room temperature and heating at80°C under vacuum for8h,the cathode was assembled into cells along with a Li metal anode and electrolyte(Merck LP30,1M LiPF6in1:1v/v ethylene carbonate/dimethyl carbonate).The cells were constructed and handled in anAr-filled MBraun glovebox(O2o0.1p.p.m.,H2O o0.1p.p.m.).Electrochemical measurements were carried out at30°C using a MACCOR Series4200cycler.Catalysis.Catalytic CO oxidation was tested in a plug-flow microreactor(Alta-mira AMI200).Fifty milligrams of catalyst was loaded into a U-shaped quartz tube (4mm i.d.).After the catalyst was pretreated inflowing8%O2(balanced with He) at400°C for1h,the catalyst was then cooled down,the gas stream switched to1% CO(balanced with air)and the reaction temperature ramped using a furnace(at a rate of1°C minÀ1above ambient temperature)to record the light-off curve.The flow rate of the reactant stream was37cm3minÀ1.A portion of the product stream was extracted periodically with an automatic sampling valve and was analysed using a dual column gas chromatograph with a thermal conductivity detector.To perform N2O decomposition reaction testing,0.5g catalyst was packed into a U-shaped glass tube(7mm i.d.)sealed by quartz wool,and pretreated inflowing 20%O2(balance He)at400°C for1h(flow rate:50cm3minÀ1).After cooling to near-room temperature,a gas stream of0.5%N2O(balance He)flowed through the catalyst at a rate of60cm3minÀ1,and the existing stream was analysed by a gas chromatograph(Agilent7890A)that separates N2O,O2and N2.The reaction temperature was varied using a furnace,and kept at100,150,200,250,300,350 and400°C for30min at each reaction temperature.The N2O conversion determined from GC analysis was denoted as X¼([N2O]in—[N2O]out)/[N2O]inÂ100%.References1.Corma,A.From microporous to mesoporous molecular sieve materials andtheir use in catalysis.Chem.Rev.97,2373–2419(1997).2.Davis,M.E.Ordered porous materials for emerging applications.Nature417,813–821(2002).3.Taguchi,A.&Schu¨th,F.Ordered mesoporous materials in catalysis.Micro.Meso.Mater.77,1–45(2005).4.Fe´rey,G.Hybrid porous solids:past,present,future.Chem.Soc.Rev.37,191–214(2008).5.Bruce,P.G.,Scrosati,B.&Tarascon,J.M.Nanomaterials for rechargeablelithium batteries.Angew.Chem.Int.Ed.47,2930–2946(2008).6.Zhai,Y.et al.Carbon materials for chemical capacitive energy storage.Adv.Mater.23,4828–4850(2011).7.Tu¨ysu¨z,H.&Schu¨th,F.in Advances in Catalysis.Chapter Two Vol.55pp127–239(Academic Press,2012).8.Ren,Y.,Ma,Z.&Bruce,P.G.Ordered mesoporous metal oxides:synthesis andapplications.Chem.Soc.Rev.41,4909–4927(2012).9.Corma,A.State of the art and future challenges of zeolites as catalysts.J.Catal.216,298–312(2003).10.Liu,Y.,Zhang,W.&Pinnavaia,T.J.Steam-stable aluminosilicatemesostructures assembled from zeolite type Y seeds.J.Am.Chem.Soc.122, 8791–8792(2000).11.Meng,X.J.,Nawaz,F.&Xiao,F.S.Templating route for synthesizingmesoporous zeolites with improved catalytic properties.Nano Today4,292–301(2009).12.Lopez-Orozco,S.,Inayat,A.,Schwab,A.,Selvam,T.&Schwieger,W.Zeoliticmaterials with hierarchical porous structures.Adv.Mater.23,2602–2615(2011).13.Na,K.et al.Directing zeolite structures into hierarchically nanoporousarchitectures.Science333,328–332(2011).14.Chen,L.-H.et al.Hierarchically structured zeolites:synthesis,mass transportproperties and applications.J.Mater.Chem.22,17381–17403(2012).15.Tsapatsis,M.Toward high-throughput zeolite membranes.Science334,767–768(2011).16.Zhang,X.et al.Synthesis of self-pillared zeolite nanosheets by repetitivebranching.Science336,1684–1687(2012).17.Jiang,J.et al.Synthesis and structure determination of the hierarchicalmeso-microporous zeolite ITQ-43.Science333,1131–1134(2011).18.Zhao,Y.et al.Metal–organic framework nanospheres with well-orderedmesopores synthesized in an ionic liquid/CO2/surfactant system.Angew.Chem.Int.Ed.50,636–639(2011).19.Feng,Q.,Kanoh,H.&Ooi,K.Manganese oxide porous crystals.J.Mater.Chem.9,319–333(1999).20.Tiemann,M.Repeated templating.Chem.Mater.20,961–971(2008).21.Suib,S.L.Structure,porosity,and redox in porous manganese oxide octahedrallayer and molecular sieve materials.J.Mater.Chem.18,1623–1631(2008).22.Zheng,H.et al.Nanostructured tungsten oxide–properties,synthesis,andapplications.Adv.Funct.Mater.21,2175–2196(2011).ha,S.C.&Ryoo,R.Synthesis of thermally stable mesoporous cerium oxidewith nanocrystalline frameworks using mesoporous silica templates.Chem.Commun.39,2138–2139(2003).24.Tian,B.Z.et al.General synthesis of ordered crystallized metal oxidenanoarrays replicated by microwave-digested mesoporous silica.Adv.Mater.15,1370–1374(2003).25.Zhu,K.K.,Yue,B.,Zhou,W.Z.&He,H.Y.Preparation of three-dimensionalchromium oxide porous single crystals templated by mun.39,98–99(2003).26.Tian,B.Z.et al.Facile synthesis and characterization of novel mesoporous andmesorelief oxides with gyroidal structures.J.Am.Chem.Soc.126,865–875 (2004).27.Jiao,F.,Shaju,K.M.&Bruce,P.G.Synthesis of nanowire and mesoporouslow-temperature LiCoO2by a post-templating reaction.Angew.Chem.Int.Ed.44,6550–6553(2005).28.Rossinyol,E.et al.Nanostructured metal oxides synthesized by hard templatemethod for gas sensing applications.Sens.Actuator B Chem.109,57–63(2005).29.Shen,W.H.,Dong,X.P.,Zhu,Y.F.,Chen,H.R.&Shi,J.L.MesoporousCeO2and CuO-loaded mesoporous CeO2:Synthesis,characterization,and CO catalytic oxidation property.Micro.Meso.Mater.85,157–162(2005).30.Wang,Y.Q.et al.Weakly ferromagnetic ordered mesoporous Co3O4synthesized by nanocasting from vinyl-functionalized cubic Ia3d mesoporous silica.Adv.Mater.17,53–56(2005).31.Ren,Y.et al.Ordered crystalline mesoporous oxides as catalysts for COoxidation.Catal.Lett.131,146–154(2009).32.Jiao,K.et al.Growth of porous single-crystal Cr2O3in a3-D mesopore system.mun.41,5618–5620(2005).33.Rumplecker,A.,Kleitz,F.,Salabas,E.L.&Schu¨th,F.Hard templating pathwaysfor the synthesis of nanostructured porous Co3O4.Chem.Mater.19,485–496 (2007).34.Jiao,F.et al.Synthesis of ordered mesoporous NiO with crystalline walls anda bimodal pore size distribution.J.Am.Chem.Soc.130,5262–5266(2008).35.Ren,Y.,Armstrong,A.R.,Jiao,F.&Bruce,P.G.Influence of size on therate of mesoporous electrodes for lithium batteries.J.Am.Chem.Soc.132, 996–1004(2010).。
urban_competitiveness
Markku Sotarauta & Reija LinnamaaUrban Competitiveness and Management of Urban Policy Networks: Some Reflections from Tampere and Oulu[Published In Technology, Society and Environment 2/2001. Helsinki University of Technol-ogy, Laboratory of Environmental Protection Publication. Espoo.]IntroductionIn the beginning of the 21st century cities are confronting fiercer competition than before. At the same time it has been stressed that network or associational modes of action are needed to transcend such various one-sided dualisms as state vs. market, public v.s private etc. In the 90’s both competition and co-operation are focused on. Cities should therefore be at the same time able to compete with other urban regions and to co-operate and create functioning net-works. The border between competition and co-operation seems to be blurring. Different functions and processes are more often seen to be organised globally and locally in a network-like way instead of hierarchies and pure market relations. Belonging to networks and the changes taking place in the networks are more clearly than before critical sources of power.The aim of this paper is to elaborate network management as an element of urban competi-tiveness. First, competitiveness and competitive advantage is scrutinised; second, urban gov-ernance and policy-networks are focused; third, the basics of network management are elabo-rated and fourth, the theoretical discussion is illustrated by two cases: managing perception gap between municipalities in the urban region of Tampere and participation of enterprises in urban economic development strategy-making in the Oulu subregion.Competitive advantage of urban regionsFinnish local government has rather long a history in conscious efforts to promote economic development (see Sotarauta & Linnamaa 1998a). In the 00`s, due to globalising economy and changes in the Finnish economy and public administration, Finnish cities are forced to focus more on their competitiveness. At the same time the present Finnish development model re-lies more than before on partnership and networks.Instead of being directly targeted at firms or employment Finnish urban development poli-cies focus nowadays more on urban competitiveness as a whole. The core of competitive ad-vantage is consciously developed. In order to be sources of “superior performance” resources and capabilities must be, drawing on Barney & Hesterly (1996, 134), a) valuable (in the sense of enabling actors to exploit their environmental opportunities and/or neutralise their threats), b) rare among current or potential competitors, c) costly to imitate and d) without close strate-gic substitutes. According to Linnamaa (1999) the competitiveness of urban regions is based upon six basic elements1 (Figure 1). However, the competitive significance of each of these elements depends on the local context.1 For a more elaborated version of the eight elements of urban competitiveness, see Sotarauta & Mustikkamäki & Linnamaa (2001)In Finland, infra-structure, firms andhuman resources arethe ‘traditional’ targetsof policies. Yet some Finnish cities andtowns have started fo-cusing more on pro-moting the quality ofthe living environment as an element of com-petitiveness. The large body of literature has raised theissue of the kinds of institutional qualities of “local milieu” and learning regions, which seem to be important in urban development. In Finland, the importance of effective policy-networks has been recognised and present urban development policies are based on networking. How-ever, experience suggests that actors have had difficulties in comprehending how to act in networks and how to manage networks. Therefore we have proposed the following working hypothesis for studies of the significance of policy networks for competitiveness in a Finnish context: - Despite the present emphasis on network-like modes of action in Finnish local development policy, actors have difficulties in comprehending how to act in networks. Because of these difficulties resources of networks are not exploited in the a best way possible.- Many of the shortcomings faced in urban development policy processes are due to lack of at-tention to the challenges involved in network management.-The good quality of policy processes enhanced by effective network management is a com-petitive advantage of urban region 2. The competitive advantage of urban regions is affected by the effectiveness of network management. Urban governance and urban economic development policyIn this paper, drawing on the argumentation of Healey et.al. (1995, 18), “the urban” is under-stood as an ensemble of diverse social relations, with different referents and spatial dimen-sion, which co-exist in the confined arena of city areas. The particular nature of the ensemble of relations to be found in a place “makes a difference” to the possibilities for economic de-velopment. The result of this kind of reasoning is that the literature has increasingly turned the attention of researchers and policy-makers away from “economic” causes of the growth of 2 See Sotarauta & Linnamaa (1998b)3 It can also be called in question whether policy networks are only “new forms of an old corporatism” (Healey 1998).Competitiveness of urban region Infrastructure FirmsHuman resources Quality of living environment Memberships in networks Institutions and effective policy-networks FIGURE 1. The elements of competitiveness of urban regions (Linnamaa 1999)new industrial agglomerations, towards social and institutional factors. (See e.g. Amin & Thrift 1995; Pyke & Sengenberger 1992; Maskell & Malmberg 1995; Cooke et al. 1996.) Diverse social relations as a starting-point the major general level transition-facing policy-makers is a shift from government to governance. In this paper urban governance is a concept that highlights the general nature of the structures and processes that connect public sector activities to each other and to various communities and in this case, especially to economic development and the business sector. According to Bailey's definition, government implies a standardised form of policy, a highly organised and co-ordinated form of government. Gov-ernance refers to the act, manner or function of governing and suggests a multiplicity of ways in which functions are carried out and economic development promoted. It implies fragmen-tation at the local level. (Bailey 1993, 146.) From this perspective, the key question concerns whether existing or new forms of urban governance can release the potentials, and reduce the tensions, of coexistence and power sharing in multiple webs of relations (Healey et al. 1995, 9; see Bryson & Crosby 1992.)At the simplest level governance is concerned with cross-sectoral co-operation and the ad-aptation of network membership and relations to changing circumstances. Combinations should not be determined on institutional or regional grounds, but rather on the basis of shared issues, regardless of administrative borders. Thus in solving each problem an effort should be made to cover the entire network, all the actors who are affected by the issue at hand. (Benington 1994, 33.)TABLE 1. Difference in the formulation of policy processes in government and governance thinking (adapted from Sotarauta 1996)Government GovernanceSystem •bureaucratic, centrally co-ordinated andsectored, emphasis on tradition of doingthings alone •decentralised, emphasis on doing together and networking, also mutual dependence recognised and acceptedProblems •tame, can be relatively precisely defined •increasingly wicked, hard to define Objects •clear, basic assumption of shared natureof society’s main goals and lack of con-flict•differentiated; may also be contradictoryResources •resources believed to grow continu-ously, political attention on allocation ofresources; existing constructs and ac-tions not questioned •needs constantly exceed resources, ample economic operating environment formed from organisations capable of negotiation and ready to seek and start-up joint pro-jectsOrganisa-tion of co-operation•institution-based policy arena •issue-based policy arenaIn the 90’s and the 00’s, it seems that the only way to cope with the current pace of changes is to accept the increasing interplay between actors, and to benefit from it. Application of the strategy of governance leads to a multiple overlapping negotiation system between variousactors at different levels. However, the adoption a new, more communicative and interactive ways of problem solving and policy design is not only a technical issue. It is also very much a matter of mental models, and the culture of policy-making and managing.Usually the concept of policy-making refers to the planning procedures and actions of the public sector, but in this paper its interactive and participatory aspects are emphasised, and thus concepts such as urban governance, policy-networks and network management are fo-cused on. They all reflect the importance of analysing the processes and not only the struc-tures of systems or policy contents when studying urban development policy.As is indicated above, in the 90’s interactive and communicative modes of policy-making were emphasised according to principles of partnership and networks and thus the urban de-velopment policy can be defined to be ...a local and sub-regional level communicative process, in which different aims and strategies ofmany actors are reconciled, and various interests balanced, and touching-points and concrete means between many objectives are constantly looked for and co-ordinated for the promotion of economic life and development of competitiveness (Linnamaa 1996; Sotarauta & Linnamaa 1997).In this definition terms like “reconciliation”, “balancing”, and “co-ordination” have been used because such processes are necessary if network-like modes of action are to achieve shared vision, shared will, and other similar aims that have been emphasised in the Finnish policy discourse. In a way local development policy has become, drawing on Hoppe’s definition, “a never ending series of communications and strategic moves by which various actors in loosely coupled forums of public deliberation construct intersubjunctive meanings. These meanings are continually translated into collective projects, plans, actions, and artefacts, which become the issues in the next cycle of political judgement and meaning constructions and so on”. (Hoppe 1993, 77.)Policy-networksIn networks modes of resource allocation is carried out by transactions through networks of individuals engaged in reciprocal, preferential and mutually supportive actions. A basic as-sumption in networks is that one party is dependent on resources controlled by another, and that there are gains to be had by the pooling of resources. Additionally in networks individual units exist not by themselves, but in relation to other units. (Powell 1991, 272.) The network approach offers a realistic alternative to the rather straightforward policy models (HB: mitkä nämä ovat?). The concept of policy-network is used to indicate patterns of relations between interdependent public, semi-public and private actors involved in processes of public policy-making in a certain policy field. (Kickert 1997 et al.) In studies of policy networks new kinds of questions are asked – such as, “who is included and who excluded?”, “which groups exert pressure?”, “who has formal power and who informal” – allowing both the conflict and the consensus models of social interaction to be incorporated. Therefore the policy network approach does not assume that decisions flow only from top policy makersdownwards, but recognises a more versatile field of policy making. (Cooke 1996, 33.) As Kenis and Schneider state, policy networks are mechanisms of political resource mobilisation in situations where the capacity for decision making, program formulation and implementa-tion is widely distributed or dispersed among private and public actors. A policy network can be described in terms of its actors, their linkages and its boundary. (Kenis & Schneider 1991, 41.)One important advantage of the network concept is that it helps us to understand not only formal institutional arrangements but also highly complex informal relationships in the policy process (Kenis & Schneider 1991, 27). The policy network provides a plausible framework for studies of urban development policy, because in Finland, several interest groups take part in urban development policy and various organisations are dependent on each other’s re-sources, information and skills. In addition, it seems to be evident that there is no “third party” to control the network, but rather there is a process controlling itself being full of op-portunities, but also confusion due incoherence and conservatism. (see Sotarauta & Linnamaa 1997.)Hence, networks are not free of problems. The network mode of action assumes the fol-lowing causes of failure:-the lack of incentives to co-operate and the existence of blockades to collective action, -proposed goals may be vague or not provocative,-important actors may be absent, while the presence of other actors may discourage the par-ticipation of necessary actors,-crucial information about goals, means and actors may be lacking,-discretionary power may be absent,the absence of commitment of actors to the common purpose may also be a reason for fail-ure.(Kickert et al. 1997.)In addition, as Termeer and Koppenjan (1997, 79) argue, blockages in policy processes are not only caused by conflicts of interest and power relations, but equally by the perceptions of the situation.Prescriptions for networks are aimed at the improvement of the conditions of collective ac-tion. Network management, i.e. the management of the interaction processes within networks or the changing of the structural and cultural characteristics of the network can do this.Network managementOperating in a world of shared-power in which governance is the effect of actors have on one another and themselves, the achievement of successful policy processes requires new kinds of management suitable for the networks. In connection with policy networks network manage-ment refers to activity, which seeks to promote process of interaction, to serve as mediator for interaction between different actors and to direct activities towards searching for a goal. Inprinciple every actor involved in policy-network can perform management role. (Network management can be defined as a form of co-ordination of strategies of actors with different goals with regard to a certain problem or policy measure within an existing framework of in-terorganisational relations. The management role of governmental actors is not self-evident in the policy networks. In principle every actor involved in policy-network can perform a man-agement role. (Kickert et al. 1997.)Kickert and Koppenjan have divided network management into game management and network constitution. The policy-network forms the operating environment in which different games are played on political decisions. The framework for the game is determined by differ-ent formal and informal rules, which take their form from the interests of the players. The un-clear nature of the rules opens to interpretation forms relatively permanent networks. The games moreover renew the networks by strengthening the division of resources and the pre-vailing rules (Kickert & Koppenjan 1997, 39; Klijn et al. 1995, 439 - 441.) Perhaps only a few of the actors of the network take part in the individual game. Their ob-jective is the achievement of their own goals. In the game the objectives of the players are tried to reconcile and to seek solution alternatives between the various objectives. The posi-tion of a player in the network is defined via the strategies adopted; the interaction occurring with other actors and the resources the players brings. (Klijn et al. 1995, 440 - 441.) Managing the game aims at the selective activation of the actors, the mobilisation of re-sources, the possibilities and limitations imposed by the rules and the formation of different compromises and shared perceptions. When leading the game the nature of the network is taken as given, constitution the network seeks to change the network by exerting influence on the relations pertaining between the participating actors, by taking new members into the net-work by excluding from the network old members or changing the division of resources, rules, norms, values and perceptions. (Klijn et al. 1995, 42.)According to Klijn and Teisman network management may address perceptions, actors and institutions and the relations between them. In paying attention to actors’ perceptions, the similarities and differences in actors’ values, goals and perspectives are examined with rela-tion to the matter at hand. At the same time means of reconciling different perceptions, values and perspectives are sought in order to make co-operation possible. Actor-oriented network management seeks to influence the combinations of the game and the entire network. By insti-tutions Klijn and Teisman refer to those rules, resources and to that organisational field which gives the network its form. Institution-oriented network management seeks to influence the game by drawing attention to how the rules, norms etc. of the network support the functional-ity of the networks and individual games and that the interaction of actors is arranged in the best possible way for the game to be successful. Network management aimed at the institu-tions has an indirect influence on all present and future activities when the ‘architecture’ of the network changes (Klijn & Teisman 1997.)TABLE 2. Management strategies in networks (adapted from Klijn & Teisman 1997).Perceptions Actors InstitutionsGame man-agement •exploring similaritiesand differences in the ac-tors’ perceptions, actingto reconcile differentgoals•activation of actors withimportant resources•arranging the interactionbetween the actors in thebest possible way for thesuccess of the gameNetwork con-stitution •changing actors’ percep-tions of the network (e.g.why the network exists,what games are played)•bringing new actors intothe network or changingthe position of existingactors•changing the network’sresources or rulesWhen defining ‘good’ network attention must be paid to the difference in network manage-ment in relation to traditional management. From the standpoint of the hierarchical system good management is frequently evaluated by whether the goals are clear or whether intended actions have been taken. But these criteria are not suitable as main criteria in network man-agement as new actors are involved, each of who have their own objectives. These may fur-thermore change in the course of the game. The lack of a clear deciding party in policy net-works may impede assessment of management. (Klijn et al. 1995.)In the evaluation of network management and policy processes attention should be paid to the process and its quality (Sotarauta 1997; Sotarauta & Linnamaa 1997; Sotarauta & Lin-namaa 1998). A good process, however, does not guarantee a good result and conversely a good result does not necessarily mean that it has been produced in an ‘acceptable’ manner. In evaluating the quality of processes it is essential to ask whether there is interaction between the actors, how they are selected for the interaction process and how interaction and finding solutions between the different goals is arrived at. Network management may be seen to be successful if it is possible thereby to influence the actors, institutions and perceptions in such a way that...-new actors and resources are brought into the policy process and actors already involved are activated,-participants in the game can be brought to commitment so that the risk of withdrawal from joint action in the middle of it is less,-the game does not lack those actors indispensable to the present problem,-the actors in the game do not diminish the interest in participating of those actors which are crucial to the game,-the rebuilding of the network does not cause difficult conflicts or destroy valuable resources, -co-operation is possible, obstacles to it can be removed or avoided,-interaction is well organised, of high quality and open,-the costs of co-operation can be limited and shared so that the costs correspond to the share of the actors in the game (avoidance of win-lose and lose-lose situations) and that win-win re-sults are possible (not all participants need achieve their objectives to the same extent), -the risk of free riders is eliminated,-there are sufficient incentives for co-operation,on the network there is sufficient executive power,-the proposed objectives are clear and create sufficient tensions,-actors participating in the network have sufficient information on goals, means and actors, -actors’ conflicting interests, power relations and conflicts due to different perceptions can be avoided,-participants are able to communicate with others about their own original goals or goals modi-fied in the course of the process and can seek points of intersection between different goals.(Adapted and expanded after Kickert et al. 1997.)There has also been criticism of policy networks, suggesting that they produce inefficient, un-productive and insufficiently legitimised policies (Kickert et al. 1997, 171.) The risk also ex-ists that the policy networks become excessively closed “old boy” networks3. A closed net-work easily ends up pursuing its own advantages when the overall advantage of developing the urban area is relegated to the background. Different networks offer the opportunity for ac-tivities aimed at developing the urban regions to become more flexible, but at the same time there is the risk that democracy will be encroached upon unless its new modes are actively sought. Excessively closed networks are also inclined to lock into the old models of activity and thought, which have achieved success in the past. (see for example Cooke & Schienstock 1996.)On the other hand the desirability of policy networks has been justified through the notion that they enable the inclusion of interest groups and implementing organisations in the prepa-ration of policies and the utilisation of their knowledge and information in the process. The inclusion of the aforementioned organisations in the process facilitated social acceptance of the policy. Thus bringing the policy into force and implementing it is easier and less costly. Moreover, the inclusion of main individuals, groups and organisations and the taking into ac-count of their interest and values enhances the democratic nature of the process and the capac-ity for solving problems. (Kickert et al. 1997, 171, see also Kenis & Schneider 1991, 42 - 43.) Good network management promotes innovative and flexible policy process achievement and enhances the functionality of the networks. The functionality of urban networks, the qual-ity and credibility of the region’s internal interaction is preconditions for external image and credibility. Thus network management which supports network functionality may be seen as one of preconditions for the success of competition between urban regions.Case I - Managing perception gap between municipalities in urban region of TampereTampere is located 180 kilometres north of Helsinki, the capital of Finland. It is the second largest urban area in Finland with a population of almost 280 000. In the last few years’ city's population has grown rapidly. Tampere’s sub-region consists of the city of Tampere and the six municipalities around it. Tampere is also the heart of the Tampere Region (with 35 mu-nicipalities). Tampere is a traditional industrial urban region that has gone through a rather severe restructuration process. In its urban economic development strategies both such more traditional fields as automation and mechanical engineering are focused side by side with in-formation technology. In a new urban development strategy of the city government a network mode of action has been adopted: urban development policy is extended to cover other poli-cies of the city as well, i.e. educational and social policies, and many other actors outside the city government.In Finland, the significance of co-operation between municipalities has increased during the 90’s. Municipalities have sought models and strategies to better organise their co-operation in urban regions too (some progress has been reported), but at the same time it can be noted that in co-operation between municipalities the question is not only about organisa-tional models and intended strategies but management of networks is also needed. More focus on actors, institutions and perceptions is needed. Next we scrutinise how differing perceptions affected co-operation between municipalities in Tampere region in 1997 and how efforts have been made to manage the network.The Co-operation between the City of Tampere and the other municipalities around it does not go as it might be desired. According to our analysis4 this is due to varying perceptions of the need for co-operation and its significance and their failure to find common ground. This is reflected both in “a floating of institutions” and in a decrease in actors’ interest. In practice the variance in perceptions meant, that the City of Tampere perceived co-operation in promotion of economic development as an operative matter. In such a case it seeked to avoid new rigid organisational structures and built up activities in terms of projects around the existing net-works.The surrounding municipalities, for their part, perceived co-operation with City of Tam-pere as a strategic matter. In the long-term view it is important for them to get themselves into co-operation with a city, which has greater material and human resources at its disposal. The surrounding municipalities may likewise assume that the City of Tampere and its superior re-sources should carry the main responsibility for the preparation and implementation of vari-ous projects. This in turn caused the City to feel that as main producer of co-operation in prac-tice the commitment of the other municipalities to the activity itself is minor. The other mu-nicipalities, too, entertained their own suspicions regarding the commitment of the city of Tampere to the co-operation as they may interpret its attitude to be that it did not consider the co-operation to be sufficiently important. So it happened that two perceptions based on differ-ent logic led to a situation in which the organisation of co-operation is lacking in efficiency. It did not become institutionalised, i.e. it did not achieve a sufficiently stable position; there was nobody to shoulder the overall responsibility. Lack of efficiency increased the competition between municipalities, which simultaneously impeded the preparation of rules of play with which to direct the co-operation. The quality of interaction relations was also affected by the difference between perceptions and the lack of rules of play, and this in due course reflected back on the actors’ perceptions and inclination to embark on the further development of insti-tutions. The vicious circle, which began with varying perceptions hence, continued rolling on.4 Based on Sotarauta & Linnamaa (1997a).。
高三英语二轮复习组合练(十五)
组合练(十五)环境保护Ⅰ.阅读理解A(2023·湖北武汉七校联考)It's hard to imagine a snowstorm in Texas could be caused by the Arctic,right?They're thousands of miles away from each other!But if we take a closer look,scientists are theorizing(从理论上说明) that rapid heating of the Arctic can drive cold air from the North Pole further south,and surprisingly enough,can end up where we'd leastexpect.Unfortunately any measure of extreme weather leads to highdemand in electricity,which can cause energy infrastructure(基础设施) to burn out.Likely so,this past week,over 4 million people were,and currently are, stuck in freezing weather conditions without electricity in Texas,a wellknown warm US state.Who's to blame? What's to blame? Fingers are pointed in multiple directions as to what the root cause is.Judah Cohen, the director of seasonal forecasting at Atmospheric and Environmental Research,explained,“This can't boil down to natural causes.A warming planet is partially to blame, at least, we theorize.But science is behind this historical phenomenon.” When we see a natural disaster involving heat, we usually link it with climate change.Is that where we place the rest of the blame involving Texas? While it seems a bit uncharacteristic,scientists hypothesize(假设) that sudden winter storms are associated with climate change.As the Arctic is “currently one of the fastest-warming regions on the planet”,the rising temperatures may increase the odds of an imbalanced polar vortex(极涡).As climate continues to warm, it's suggested that this can and will happen more frequently.Natural disasters have proven that we need to become adequately prepared for what Mother Nature with a dash of climate change can do.Systems need to be created with reliable and lasting capabilities that can carry the next unexpected and possibly worse phenomenon.1.What is the main purpose of the first paragraph?A.To introduce polarbased scientific theories.B.To explore why Texas suffered cold weather.C.To figure out damage caused by power failure.D.To show how weather patterns affect the planet.2.What is responsible for extreme weather according to Judah Cohen?A.Gases. B.Science.C.The Arctic. D.Nature.3.What message does the author convey in the last paragraph?A.Unite to fight against the unexpected.B.Run a race to balance the world's climate.C.Develop a weather broadcasting system.D.Get wellprepared for the worse to come.4.How is the text mainly developed?A.By making theoretical analysis.B.By conducting experiments.C.By listing examples.D.By making comparisons.[语篇解读]文章主要分析了全球变暖的原因,指出了全球变暖造成的影响,并提出了人们应采取的应对之举。
- 1、下载文档前请自行甄别文档内容的完整性,平台不提供额外的编辑、内容补充、找答案等附加服务。
- 2、"仅部分预览"的文档,不可在线预览部分如存在完整性等问题,可反馈申请退款(可完整预览的文档不适用该条件!)。
- 3、如文档侵犯您的权益,请联系客服反馈,我们会尽快为您处理(人工客服工作时间:9:00-18:30)。
Towards a Theoretical Framework for Ensemble Classification Alexander K. Seewald Austrian Research Institute for Artificial Intelligence Freyung 6/VI/7, A-1010 Wien, Austria alexsee@oefai.at; alex@seewald.at
Abstract Ensemble learning schemes such as AdaBoost and Bagging enhance the performance of a single clas-sifier by combining predictions from multiple clas-sifiers of the same type. The predictions from an ensemble of diverse classifiers can be combined in related ways, e.g. by voting or simply by se-lecting the best classifier via cross-validation - a technique widely used in machine learning. How-ever, since no ensemble scheme is always the best choice, a deeper insight into the structure of mean-ingful approaches to combine predictions is needed to achieve further progress. In this paper we offer an operational reformulation of common ensemble learning schemes - Voting, Selection by Crossvali-dation (X-Val), Grading and Bagging - as a Stacking scheme with appropriate parameter settings. Thus, from a theoretical point of view all these schemes can be reduced to Stacking with an appropriate combination method. This result is an important step towards a general theoretical framework for the field of ensemble learning.
1 Introduction We apologize that space restrictions arc forcing us to be terse. For a more detailed version, see [Seewald, 2003]. We will first explain how Stacking works in order to lay the founda-tions for our functional definitions of meta classifiers later on. Fig. 1 shows Stacking on a hypothetical dataset. During training, all base classifiers arc evaluated via cross-validation on the original dataset. Each classifier's output is a class probability distribution for every example, see Fig. 1(b) The concatenated class probability distributions of all base classifiers, followed by the class value, forms the meta-level training set for Stacking's meta classifier, see Fig. 1(c) After training the meta classifier, the base classifiers are retrained on the complete training data. For testing, the base classifiers are queried for their class probability distributions. These form a meta-example for the meta classifier which outputs the final class prediction.
2 Definitions An arbitrary training dataset with n examples and k classes, and a single test instance, is given. N arbitrary base classifiers have been cross-validated on this dataset, and afterwards re-trained on the whole dataset. All base classifiers output class probability distributions, i.e. estimated probabilities for each class instead of deciding on a single class. Then, refers to the probability given by classifier i for class j on example number k during is the class prob-ability distribution of classifier i on instance k. refers to
Figure 1: llustration of Stacking on a dataset with three classes (a, b and c), n examples and TV base classifiers. refers to the probability given by classifier i for class j on example number k.
the class prob.dist. for classifier i on the unknown test in-stance. A fixed arbitrary order on the class values and N base classifiers is assumed. Classk is the true class for instance k. is the attribute vector of instance k. n is the num-ber of instances. All indices are zero-based, e.g. the instance id k satisfies the equation 0 k n — 1.
As we mentioned, we assume that all ensemble learning schemes return class probability distributions. f predictions are needed, the position of the maximum class probability in the vector - i.e. the predicted class - is easily obtained via formula (2) Trivially, Stacking with predictions can also be simulated by this variant; simply by transforming the class distributions meta-dataset to predictions via (2) prior to ap-plying the meta classifier. We can now characterize every ensemble learning scheme by what features it extracts from the meta-dataset during training and how these features define the mapping from meta-dataset to final class probability distribution.
2.1 Voting Voting, a straight-forward extension of voting for distribution classifiers, is the simplest case. During training, no features are extracted from the meta-dataset. In fact Voting does not even need the internal crossvalidation. During testing, Voting determines the final class probability distribution as follows.
(3)
POSTER PAPERS 1443