电机参数辨识-matlab官网教程
永磁直驱风电系统建模及其机电暂态模型参数辨识
永磁直驱风电系统建模及其机电暂态模型参数辨识程玮;陈宏伟;石庆均【摘要】Aiming at the characters of direct-driven wind-power system with permanent magnet synchronous generator (PMSG) based on back-to-back pulse width modulation(PWM) converter, the wind turbine, the control strategies of turbine-side converter and grid-side con verter were analyzed. PMSG detail model using Matlah/Simulink was established. Based on this, electromechanical transient model for di rect-driven wind-turbine generator was constructed according to 3 orders synchronous generator model. Particle swarm optimization ( PSO) al gorithm was used to identify the parameter for the mathematical model. The simulation results show that the detail model can reflect direct- driven wind-power system' s operation as wind speed changing, while it can track the maximum power point. The electromechanical transient model coincides with the detail model well. It reflects the active and reactive power of the direct-driven wind-power system when grid voltage is changed. The parameter identification using PSO is effective. The results indicate that the detail model can be used to refine power output control strategy, the electromechanical transient model can be used to study direct-driven wind-power system interacted with the grid.%针对基于双脉宽调制(PWM)变换器的永磁直驱风电系统的运行特性,分析了风力机特性、电机侧变换器和电网侧变换器的控制策略,利用Matla/Simulink建立了反映电力电子开关动作的永磁直驱风电系统详细模型,并在此基础上根据同步电机3阶暂态模型,建立了直驱风机的机电暂态数学模型,采用粒子群算法(PSO)对模型进行了参数辨识.仿真结果表明,该详细模型能够描述永磁直驱风电系统对不同风速的响应,实现风能的最大功率跟踪;机电暂态数学模型与详细模型特性接近,能够从总体上反映永磁直驱风电系统对端电压变化的有功、无功响应,PS0参数辨识有效.研究结果表明,所建立的详细模型能够用于控制方式的研究以改善输出特性,机电暂态模型能够用于研究电网与永磁直驱风电系统的相互影响.【期刊名称】《机电工程》【年(卷),期】2012(029)007【总页数】4页(P817-820)【关键词】双脉宽调制变换器;机电暂态;参数辨识;粒子群算法【作者】程玮;陈宏伟;石庆均【作者单位】浙江大学电气工程学院,浙江杭州310027;浙江大学电气工程学院,浙江杭州310027;浙江大学电气工程学院,浙江杭州310027【正文语种】中文【中图分类】TM6140 引言当前,变速恒频(variable-speed constant-frequency,VSCF)风力发电系统已被广泛应用,其特点是通过先进的变速和变桨技术,在风速变化时调节发电机转速处于相应的最佳值从而最大限度地捕获风能,提高了风力发电的效率,且低风速情况下风机转速下降,从而大大降低了系统的机械应力和装置成本。
基于扩展卡尔曼滤波器的交流永磁同步电机参数辨识的开题报告
基于扩展卡尔曼滤波器的交流永磁同步电机参数辨识的开题报告一、选题背景及意义交流永磁同步电机(PMSM)具有结构简单、质量轻、体积小、效率高、起动与调速性能优越等特点,已被广泛应用于电力、工业、交通等领域。
PMSM的参数辨识问题一直是电机控制领域研究的热点问题之一。
精确的参数辨识可以大大提高PMSM控制系统的性能和效率。
传统的基于最小二乘法的PMSM参数辨识方法依赖于直流和交流侧测量的电量,当输入电流和速度有较大偏差时,容易出现辨识精度较低的情况。
因此,使用基于扩展卡尔曼滤波器(EKF)的PMSM参数辨识方法来获得更准确的参数估计值,已成为一种热门研究方向。
二、研究目标本课题旨在设计一种基于EKF的PMSM参数辨识方法,以获得准确的参数估计值。
研究内容包括以下几个方面:1.建立PMSM的数学模型,包括电压、电流、转速等物理量的方程。
2.设计EKF算法,用于提高参数辨识的准确性。
3.编写MATLAB程序,实现样本数据的采集、处理及EKF算法的实现。
4.通过仿真实验和实际实验验证所设计的基于EKF的PMSM参数辨识方法的有效性和准确性。
三、研究内容1. PMSM的研究与数学模型建立本课题将研究PMSM的结构、特性、运行原理及数学模型。
对PMSM进行建模,通过建立电压、电流、转速等物理量的方程,为后续的参数辨识提供数学基础。
2. EKF算法的设计与实现将EKF算法应用于PMSM参数辨识过程中,可提高参数估计的准确性。
本课题将研究EKF算法的基本原理、实现过程及其在PMSM参数辨识中的应用,实现算法的设计与实现。
3. 样本数据采集和处理本课题将进行样本数据的采集和处理。
采集到的数据将作为基于EKF的PMSM参数辨识的输入,包括电机电流、电压、转速等实时信号。
4. 基于EKF的PMSM参数辨识仿真及实验根据所设计的基于EKF的PMSM参数辨识方法,开展仿真及实验验证。
通过对仿真结果和实验结果的分析,验证研究成果的有效性和准确性。
基于matlab的永磁同步电机调速系统的仿真
摘要本文首先介绍了永磁同步电机的国内外发展状况,然后介绍了永磁同步电机的结构及原理,接着建立了永磁同步电机的数学模型,并在此基础上用MATLAB 进行了仿真,最后进行了仿真及仿真结果的分析。
永磁同步电机是具有非线性、强耦合性、时变性的系统,在运行过程中会受到负载扰动等多因素影响。
以往研究永磁同步电机的做法是在硬件上搭建一个平台进行模拟,但是这样在做实验中难免会造成一些损失,而且硬件上的反馈会比较长研究周期长。
目前在国内外关于永磁同步电机调速系统的研究现状上来讲,基于MATLAB环境下仿真模型的构建下进行研究,这可极大的缩短研究周期和研究成本。
在利用MATLAB仿真模型研究永磁同步电机时,我们可以把那些扰动因数做成模拟信号给予模型,这样可以准确的定性分析实验得出结论。
关键字:永磁同步电机,空间矢量调制,MATLAB仿真,数学模型。
ABSTRACTIn the first, this paper introduces the domestic and international development status of Permanent Magnet Synchronous Motor(PMSM), gives a explanation about its basictheory, structure. Then it builds a mathematical model, and uses MATLAB to simulate that model.The PMSM is a nonlinear, strong-coupling and time-varying system, so in the operation process, it will be influenced by many factors such asload disturbance. Therere, it is necessary to take action when researching the control method of PMSM. The former research method is setting up a platform on hardware to perform experimensbut it is undesirable, because it often cause some loss, and the feedback cycle is longer than research cycle. As fordomestic and international current situation on the research of PMSM, it is obvious that researching under the simulation model created by MATLAB could greatly reduce the cost and cycle of researchment. When using MATLAB to build simulation model on the research of PMSM, we can transform these disturbance factors into analog signal, making a qualitative analysis to draw conclusions from them.Keywords:PMSM, SVPWM, MATLAB simulation, mathmatical model目录摘要 (I)ABSTRACT .............................................. I I 目录............................................... I II 第一章绪论 (1)1.1 研究背景及意义 (1)1.1.1 研究背景 (1)1.1.2 研究的目的及意义 (1)1.2 国内外研究现状 (2)1.2.1 国内研究历史及现状 (2)1.2.2 国外研究现状及趋势 (2)1.3 本文的主要内容 (3)第二章永磁同步电机调速系统的结构和数学模型 (5)2.1 引言 (5)2.2 永磁同步电机调速系统的结构 (5)2.3 永磁同步电机调速系统的数学模型 (6)2.3.1 PMSM在ABC坐标系下的磁链和电压方程 (6)坐标系下的磁链和电压方程 (8)2.3.2 PMSM在02.3.3 PMSM在dq0坐标系下的磁链和电压方程 (9)2.4 永磁同步电机的控制策略 (11)2.5 本章小节 (12)第三章永磁同步电机矢量控制及空间矢量脉宽调制 (14)3.1 引言 (14)3.2 永磁同步电动机的矢量控制 (14)3.3 空间矢量脉宽调制概念 (15)3.4 SVPWM模块的建立 (17)3.5 本章小结 (23)第四章基于Matlab的永磁同步调速系统仿真模型的建立 (24)4.1 引言 (24)4.2 MATLAB软件的介绍 (24)4.3永磁同步电机调速系统整体模型的建立 (25)4.4仿真参数调试及结果分析 (28)4.5本章小结 (29)第五章总结与展望 (30)5.1全文总结 (30)参考文献 (31)致谢 (33)第一章绪论1.1 研究背景及意义1.1.1 研究背景随着电力电子技术、微电子技术和现代电机控制理论的发展,交流调速系统逐步具备了宽调速范围、高稳速精度、快速动态响应及四象限运行等良好的技术性能,交流调速系统应用越来越广泛。
电机参数辨识技术研究
3) 忽略定子铁 心 与 转 子 铁 心 的 涡 流 损 耗 和 磁 滞 损耗。
4) 忽略电机参数变化。 建立在三相 静 止 坐 标 系 上 的 PMSM 数 学 模 型 经 坐标变换后可变换到任意两相坐标系中,从而简化耦
Copyright©博看网 . All Rights Reserved.
第2期
郝振翔:电机参数辨识技术研究
· 193 ·
电机参数在实际运行过程中的变化会导致与模型参数 些算法对 PMSM 的参数进行辨识。
不匹配影响控制系统的性能甚至可能损坏电机。获取 准确的电机参数可以改善电机的控制性能,例如电阻 与电感可以用于比例积分控制参数的整定计算。因此 需要通过参数辨识获取电机的参数从而保证电机的控 制性能。
犃犫狊狋狉犪犮狋:Inactualprocessofpermanent magnetsynchronous motor (PMSM),theparametersof motor changebytheinfluenceoftemperatureandmagneticcircuit,whichreducethecontroleffectofservosystemande venprobablydamagemotor.Therefore,itisnecessarytoobtainthemotorparametersthroughparameteridentifica tionandensurethecontroleffect.The motorparametersinthestaticandstableoperationstateareobtained throughoff-lineidentification,andusedastheinitialvalueofonlineidentification.theonlineidentificationofmo torparametersisbasedonmodelreferenceadaptivemethod.Takingthedirectaxisandquadratureaxiscurrente quationintherotatingcoordinatesystemasthereferencemodel,theresistanceandinductanceofthemotorarei dentifiedbythecollectedparameterssuchasvoltage,currentandspeed.Themotormodelwhichcanchangeparam etersinrealtimeisbuiltin MATLABsimulationplatform,andthemodelreferenceadaptivemoduleisbuiltforon lineidentification.Theeffectivenessofthismethodisverifiedbysimulation.
基于MRAS的永磁同步电机在线参数辨识
■技术探讨与研究TECHNIQUE RESEARCH基于MRAS的永磁同步电机在线参数辨识Online Parameter Identification of Permanent Magnet Synchronous Motor Based on MRAS Runchan Liu大连交通大学刘闰婵(Runchan Liu)摘要:在永磁电机运转过程中,电机的参数会实时发生变化,而调节器不能进行参数自校正,为了获得更好的控制效果,需要对电机的参数进行在线辨识。
本文提出基于模型参考自适应(MRAS)的PMSM在线辨识方法,建立参考模型和可调模型,利用两个模型的输出量之差/通过合适的自适应律来现对PMSM参数的辨识,在线估计定子电阻、定子电感、永磁体磁链,并通过MATLAB仿真验证可行性。
关键词:永磁同步电机;在线参数辨识;模型参考自适应;参考模型;可调模型Abstract:During the operation of permanent magnet motor the parameters of the motor will change in real time,but the regulator cart perform self-correction of paramBeters.In order to obtain better control effect,the parameters of the motor n e ed to be ide ntified online.This paper proposes a model reference adaptive system(MRAS)based on PMSM on line ide n tificati o n method,which establishes a ref e re n ee model and an adjustable model,the n uses the differe n ee betwee n the output of the two models to ide n tify the PMSM parameters through an appropriate adaptive law.Stator resista nee,stator in d u eta nee,perma nent magnet flux lin kage were estimated online and verified by MATLAB simulation.Key words:PMSM;Online par a meter ide ntificati o n;MRAS;Refere n ee model;Adjustable model【中图分类号】TM351【文献标识码】B文章编号1606-5123(2020)07-0067-051引言与传统的电励磁同步电机相比,永磁同步电机具有结构简单、体积小、质量轻、运行可靠等显著优势。
平台建模与参数辨识
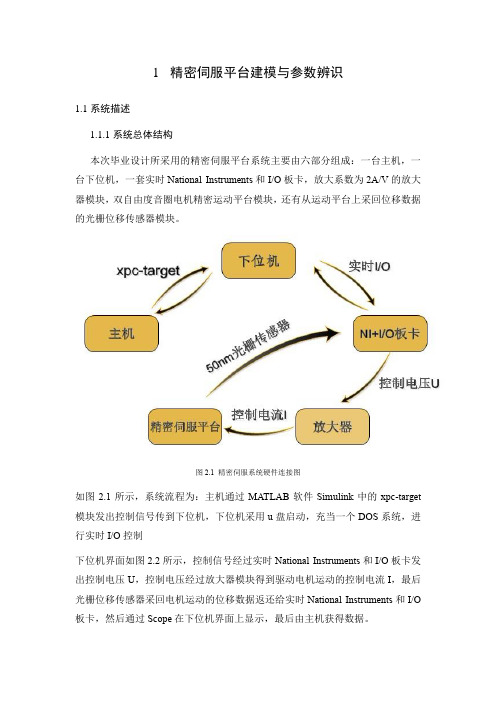
精密伺服平台建模与参数辨识系统描述系统总体结构本次毕业设计所采用的精密伺服平台系统主要由六部分组成:一台主机,一台下位机,一套实时National Instruments和I/O板卡,放大系数为2A/V的放大器模块,双自由度音圈电机精密运动平台模块,还有从运动平台上采回位移数据的光栅位移传感器模块。
图2.1 精密伺服系统硬件连接图如图2.1所示,系统流程为:主机通过MATLAB软件Simulink中的xpc-target 模块发出控制信号传到下位机,下位机采用u盘启动,充当一个DOS系统,进行实时I/O控制下位机界面如图2.2所示,控制信号经过实时National Instruments和I/O板卡发出控制电压U,控制电压经过放大器模块得到驱动电机运动的控制电流I,最后光栅位移传感器采回电机运动的位移数据返还给实时National Instruments和I/O 板卡,然后通过Scope在下位机界面上显示,最后由主机获得数据。
图2.2 下位机界面系统部分模块介绍1)National Instruments板卡+I/O板卡模块图2.2 NI+I/O板卡如图2.2所示,所采用的是NI 625x Specifications型号的板卡通过PCI接到下位机上,然后另外一段模拟端口接I/O板卡,PCB采用双层布线,布线图如图2.3、图2.4所示图2.3 I/O板卡下层PCB布线图图2.4 I/O板卡上层PCB布线图I/O板卡上有2个Analog output BNC端口,10个Analog input BNC端口,还有两个9针串口端。
2)放大器模块本次毕业设计采用的放大器实物图如图2.5所示:图2.5 放大器实物图其设计图例及相关部分功能如图2.6所示:图2.6 放大器设计图放大器原理图如图2.7所示:图2.7 放大器原理图简化之后的放大器原理图如图2.8:图2.8 放大器简化原理图对放大器原理进行理论分析建模,功能模块传递函数匹配,能得到如下结果,见图2.9:图2.9 放大器传递函数简化图其中一级放大:11=G(2.1)二级放大传递函数表示: sC C R s C C R R sR C G )(121122121222+++= (2.2)注:与图2.8中对应:R1-1k R2--B C1--F C2--E 可得到二级放大传递函数:se s e s e G 52115242.284.412.2---++= (2.3)三级放大:由平台电机负载为:H e L m R load load 33.3,5.7-=Ω= (2.4)带入可得到三级放大传递函数:5.73.32033+=-s e G (2.5)反馈系数:5.0=H (2.6)则放大器闭环条件下的总传递函数为:10015.402.859.1204.41428313432321++++=+=Φ----s e s e s e s e G HG G G G (2.7) 放大器模块的幅频相频特性曲线( bode 图)如图2.10所示:图2.10放大器bode 图放大器带宽Khz B 2291211400==π,放大倍数接近于2A/V . 3)双自由度位移平台模块三个音圈电机放置在一个双自由度位移平台上,上层为一个音圈电机单独接入,下层为两个音圈电机并联接入。
matlable软件的使用和教程
MATLAB百科名片MATLAB软件界面图MATLAB是矩阵实验室(Matrix Laboratory)的简称,是美国MathWorks 公司出品的商业数学软件,用于算法开发、数据可视化、数据分析以及数值计算的高级技术计算语言和交互式环境,主要包括MATLAB和Simulink两大部分。
目录基本功能应用发展历程新版本新功能特点优势工具基本功能应用展开编辑本段基本功能MATLAB是由美国mathworks公司发布的主要面对科学计算、可视化以及交互式程序设计的高科技计算环境。
它将数值分析、矩阵计算、科学数据可视化以及非线性动态系统的建模和仿真等诸多强大功能集成在一个易于使用的视窗环境中,为科学研究、工程设计以及必须进行有效数值计算的众多科学领域提供了一种全面的解决方案,并在很大程度上摆脱了传统非交互式程序设计语言(如C、Fortran)的编辑模式,代表了当今国际科学计算软件的先进水平。
MATLAB和Mathematica、Maple并称为三大数学软件。
它在数学类科技应用软件中在数值计算方面首屈一指。
MATLAB可以进行矩阵运算、绘制函数和数据、实现算法、创建用户界面、连matlab开发工作界面接其他编程语言的程序等,主要应用于工程计算、控制设计、信号处理与通讯、图像处理、信号检测、金融建模设计与分析等领域。
MATLAB的基本数据单位是矩阵,它的指令表达式与数学、工程中常用的形式十分相似,故用MATLAB来解算问题要比用C,FORTRAN等语言完成相同的事情简捷得多,并且MATLAB也吸收了像Maple等软件的优点,使MATLAB成为一个强大的数学软件。
在新的版本中也加入了对C,FORTRAN,C++ ,JAVA的支持。
可以直接调用,用户也可以将自己编写的实用程序导入到MATLAB函数库中方便自己以后调用,此外许多的MATLAB爱好者都编写了一些经典的程序,用户可以直接进行下载就可以用。
编辑本段应用MATLAB 产品族可以用来进行以下各种工作:● 数值分析● 数值和符号计算● 工程与科学绘图● 控制系统的设计与仿真● 数字图像处理技术● 数字信号处理技术● 通讯系统设计与仿真MATLAB在通讯系统设计与仿真的应用● 财务与金融工程MATLAB 的应用范围非常广,包括信号和图像处理、通讯、控制系统设计、测试和测量、财务建模和分析以及计算生物学等众多应用领域。
异步电机参数辨识及矢量控制系统参数自整定的开题报告
异步电机参数辨识及矢量控制系统参数自整定的开题报告一、研究背景及意义异步电机是广泛应用的一种电动机,其简单、可靠、经济的特点使其成为工业应用、家电、交通运输等领域的首选电机。
矢量控制系统是以异步电机为基础进行控制的一种高效运转方式,能够大大提高异步电机的性能,提高其动态性能、效率和可靠性,从而大大提高其广泛应用的能力。
因此,正确和准确的进行异步电机参数辨识和矢量控制系统的参数自整定,对于提高异步电机性能和控制精度具有重要的现实意义和科学价值。
目前,异步电机参数辨识和矢量控制系统参数自整定的研究已经得到了广泛关注,已经有许多重要的工作已经被展开了。
在国内外,许多学者和工程师也对此问题进行了系统的研究和实践,建立了许多有价值的理论模型和实验方法,取得了重要的成果。
二、研究内容本课题将主要着手以下几个方面的研究:1、异步电机参数辨识方面,本课题将着重研究基于测量数据和不同的参数辨识算法,提高参数辨识的精度和可靠性。
关键问题将包括:如何有效地利用测量数据获得异步电机的准确参数;如何应对实际场景中复杂工况下异步电机参数跨越及其辨识的问题过程,以及如何评估参数辨识精度的准确性等。
2、矢量控制系统参数自整定方面,本课题将研究基于最小二乘法和更复杂的自适应方法来判定矢量控制算法的基本参数值,以及如何优化参数调节的过程,从而实现好参数自整定的效果。
关键问题将包括:如何有效地获得矢量控制算法的基本参数值;如何处理在实际应用中可能出现的复杂噪声和鲁棒性问题,以及如何有效的利用自适应方法来实现更复杂的参数调整算法目标等。
3、试验研究方面,本课题将使用MATLAB/Simulink工具建立理论模型,使用向量控制模型进行仿真实验。
并使用特定数据输入模拟实际场景,并对本文提出的改进算法进行仿真实验,从而评估改进算法的性能和有效性。
三、研究方法本课题将主要采用建立理论模型、设计仿真实验的方法,深入研究与探索异步电机参数辨识及其矢量控制系统参数自整定的关键问题。
伺服系统转动惯量辨识及控制器PI参数优化
No.4Apr.2021第4期2021年4月组合机床与自动化加工技术Modular Machine Tool & Automatic Manufacturing Techninue文章编号:1001 -2265(2021)04 -0096 -04DOI : 10.13462/j. cnki. mmtamt. 2021.04. 023伺服系统转动惯量辨识及控制器PI 参数优化孙彦瑞,苏成志(长春理工大学机电工程学院,长春130000)摘要:在机器人运行时,为了使伺服电机在最优性能下达到目标速度、在工作过程中有着更强的抗 扰动能力,并避免出现震荡、谐振的状况,从而造成机器人运行时动态稳定性严重降低。
提出一种 基于非线性动态学习因子的粒子群优化算法,对普通粒子群优化算法进行改进。
该算法以伺服系 统控制模型中的速度控制器为核心,实时辨识负载转动惯量值,使伺服系统内部控制参数根据实际 工况调节;运用该辨识值,通过计算得到速度控制PI 参数值,并实时修正速度控制器PI 参数值。
MATLAB/SIMULINK 仿真结果表明,与传统的粒子群优化算法相比,无论在电机启动过程中、还是 负载扰动下,该方法都具有更快的响应速度、更高的控制精度以及更强的抗干扰能力。
关键词:转动惯量;非线性动态学习因子;粒子群优化算法;速度控制器PI 参数中图分类号:TH166 ;TG506 文献标识码:AServo System Inertia IdenhPcahon and Controller PI Parameter OptimizationSUN Yan-rui , SU Cheng-zhi(School of Mechanical and Electrical Engineering , Changchun Univvrsity of Science and Technolo/y , Changchun 130000, Ch/ia )Abstrach : During the operation of the robot , in order to make the servo motor achieve the target speed un der the optimal performance , and have stronger anti-disirbance ability in the working proces s , and to a void the prob —m of vibration and resonance , resulting in a serous reduction in the dynamic stability of the robot. The coniol model of servo motor is analyzed , and a particle swarm optimization algorithm based on nonlmear dynamic learning factor is proposed. The algorithm ties the speed conioller in the servo system coniol model as the core , and can identify the loadz moment of inertia in real time , so that the internaicontrol parameters of the s ervo system can be adjusted according to the acial condbions. By using the i dentification value , the PI parameter value of the speed control is obtained through calculation , and the PI parameter value of the speed conioller is corrected in real time. The results of MATLAB/SIMULINK sim ulation show that compared with the traditional pakWle swarm optimization algorithm , this method has fas ter response speed , higher control accuracy and stronger anti-interference ability , whether in the motorsha+hing p+oce s o+unde+hheload dishu+bance.Key wois : moment of inertia ; nonlinear dynamic learning factor ; particle swarm optimization tgoriim ; speed conho l e+PIpa+amehe+0引言机器人在运行时,每个轴的负载转动惯量与负载 扭矩随着机器人的姿态的变化而变化;伺服系统对负 载转动惯量的辨识精度、辨识快慢,决定着伺服系统运 行的稳定性、精确性与快速性。
ARX模型辨识-自行车机器人系统辨识及MATLAB仿真-2
第五章基于ARX模型的自行车机器人系统辨识
固定平衡点的动态特性。
车体倾角
驱动电压
图5-4去趋势项后的输入输出图
Measured Output and Simulated Model Output
腰 娶 蛙 *
图5-5模型输出与测量输出比较图
北京邮电大学硕十研究生学位论文 Correlation function of residuals.Output车体倾角
y(七)+aly(k一1)+a2y(七一2)+…+n%y(七一,ln)
(5.6)
、7
=即(七-1)+b2u(k一2)+...+饥。“@一%)+e(七)
式中,y(k)为系统输出量的第k次观测值,y(k--1)为系统输出量的第k--1
次观测值,依次类推;u(k)为系统的第k个输入值,u(k--1)为系统的第k--1个
贝0上式变fiYg y(k);hT(七)臼+P(七)
(5—8)
对于k=l,2…,L,式(5—7)构成一个线性方程组,可以把它写成 虼=HL@妒+气@)
(5-9)
式中
y(1)
e(1)
yL:产’】,气:产’】,
y(L)
y∞)
-y(O) …-y(1-n。) u(O) …“(1一n。)
吼:【一y(1)…一y(2-n,,)“(1)…“(2-nb)】
(5—3)
cov{eL)=E慨气1); E{e2(1)) E忙(1)P(2)】. … E{e(1弦(L)】.
【Ep(1)P(2)) E忙2(2)) …E忙(2弘犯)1
E忙但弘(1)}E{e0妒(2))… E{e2犯))
全∑。=吒2,
(5·4)
式中吒2为噪声e(k)的方差:I为单位矩阵。
- 1、下载文档前请自行甄别文档内容的完整性,平台不提供额外的编辑、内容补充、找答案等附加服务。
- 2、"仅部分预览"的文档,不可在线预览部分如存在完整性等问题,可反馈申请退款(可完整预览的文档不适用该条件!)。
- 3、如文档侵犯您的权益,请联系客服反馈,我们会尽快为您处理(人工客服工作时间:9:00-18:30)。
Creating a High-Fidelity Model of an Electric Motor for Control System Design and VerificationBy Brad Hieb, MathWorksAn accurate plant model is the linchpin of control system development using Model-Based Design. With a well-constructed plant model,engineers can verify the functionality of their control system, conduct closed-loop model-in-the-loop tests, tune gains via simulation,optimize the design, and run what-if analyses that would be difficult or risky to do on the actual plant.Despite these advantages, engineers are sometimes reluctant to commit the time and resources required to create and validate a plant model. Concerns include how much time it will take to run a simulation, how much domain and tool knowledge will be required to build and validate the model, and what type of equipment will be needed to acquire hardware test data for building and validating the model.This article describes a workflow for creating a permanent magnet synchronous machine (PMSM) plant model using MATLAB ®and Simulink ®and commonly available lab equipment. The workflow involves three steps:▪Execute tests▪Identify model parameters from test data▪Verify parameters via simulationWe used the plant model to build and tune a closed-loop PMSM control system model. We ran step response and coast-down tests using the controller model in simulation and on hardware using an xPC Target™ turnkey real-time testing system. We found close agreement between the simulation and hardware results, with normalized root mean square deviation (NRMSD) below 2% for key signals such asrotor velocity and motor phase currents (Figure 1).Figure 1. Comparison of simulation results (blue) with hardware results (red) for rotor velocity (left) and phase current (right).The Plant Model and Its ParametersThe PMSM plant model, developed with SimPowerSystems™, includes the motor and a load—in this example, an acrylic disc. The model has nine parameters that define its behavior: one (disc inertia) associated with the load and eight associated with the motor (Figure 2).See more articles and subscribe at /newsletters .Figure 2. Simulink model of a PMSM.We conducted five tests to characterize these parameters: the bifilar pendulum test, the back EMF test, the friction test, the coast-down test, and the DC voltage step test (Table 1). In this article, we will focus on the coast-down test and the DC voltage step tests. These tests demonstrate progressively more sophisticated methods of parameter identification, and illustrate extracting parameter values via curve fitting and parameter estimation, respectively.Test Parameters Identified Identification MethodBifilar pendulum test Disk inertia (H d)CalculationCalculationBack EMF test Number of poles (P)Flux linkage constant (A pm)Torque constant (Kt)Curve fittingFriction test Viscous damping coefficient (b)Coulomb friction (J0)Coast-down test Rotor inertia (H)Curve fittingParameter estimationDC voltage step test Resistance (R)Inductance (L)Table 1. Model parameters and the tests conducted to characterize them.For each test, we describe the test setup and then explain how we conducted the test, acquired the data, extracted the parameter value, and verified it.Characterizing Rotor Inertia with the Coast-Down TestTo characterize the rotor inertia (H) we spin the rotor up to an initial speed (ωr0) and measure the rotational speed (ω) as the rotor coasts to a stop. Using this measured result, the rotor inertia can be identified by curve fitting the equation for ωr to the measured rotational speed during the period of time when the motor is coasting to a stop.The differential equation [1] describes the mechanical behavior of the motor. The coast-down test is set up so that the load torque (T load) is always 0. Once the motor is up to an initial, steady-state speed, the motor is turned off, so that the electromagnetic driving torque(T em) is also 0. Under these conditions the solution to [1] is given by the equation for ωr[2], whereωr is the rotational speed of the rotor shaftωr0is the initial rotational speed of the rotor shaftJ0and b are the Coulomb friction and viscous damping coefficient, respectively, characterized from aseparate friction testT em is the electromagnetic driving torque (0 during this test)T load is the load torque (0 during this test)Conducting the Test and Acquiring the DataIn the lab we created an open-loop Simulink test model to drive the motor to an initial speed of 150 radians per second, at which time the motor drive was turned off and the rotor coasted to a stop. Throughout the test the model captured the output of the rotational speed sensor. Using Simulink Coder™ and xPC Target, we deployed this model to an xPC Target turnkey real-time system. We executed the model using xPC Target, and imported the rotor speed data into MATLAB for analysis.Extracting and Verifying the Parameter ValuesAfter running the tests, we plotted the measured speed data in MATLAB and used Curve Fitting Toolbox™ to fit equation [2] for the rotor angular velocity (ωr) to the measured speed data while the rotor was coasting to a halt. Using the value of H from the curve fit, we evaluated equation [2] from the point at which the motor started coasting and plotted the results with the original test data (Figure 3). As Figure 3 shows, equation [2] with the value of H from the curve fit closely predicts the motor speed during the coast-down test.Figure 3. Plot of rotor velocity during the coast-down test. Blue = hardware test results; red = curve fitting results.We used a model to verify our parameter identification result. Using the rotor inertia value obtained from the coast-down test(3.2177e-06 Kg m^2 in our PMSM model), we ran a simulation of the coast-down test in Simulink. We then compared and plotted the simulated results with the measured results (Figure 4). The results matched closely, with a normalized root mean square deviation (NRMSD) of about 2%.Figure 4. Comparison of measured rotor velocity (red) and simulated rotor velocity (blue).Characterizing Resistance and Inductance with the DC Voltage Step TestIn the DC voltage step test a DC voltage is applied across the motor phase A and phase B connections and the resulting current is measured. Electrically, under these conditions, a three-phase PMSM behaves like a circuit with two series resistors and two seriesinductors (Figure 5).Figure 5. Equivalent electrical circuit for DC step test.The measured current (i) is used to find the resistance and inductance parameter values. During the test the rotor is held motionless to avoid complicating the analysis with back EMF waveforms, which tend to oppose the current flow. To avoid burning out the motor with the rotor motionless, a current limiting resistor (R limit) is added and a step pulse rather than a steady DC voltage is used.Conducting the Test and Acquiring the DataWe again used xPC Target and an xPC Target turnkey real-time system to conduct the test. In Simulink we developed a model that produced a series of 24-volt pulses roughly 2.5 milliseconds in duration. We deployed this model to our xPC Target system using Simulink Coder, and applied the voltage pulse across the phase A and phase B terminals of the PMSM. We measured the applied voltage and the current flowing through the motor using an oscilloscope, and using Instrument Control Toolbox™ we read the measured data into MATLAB, where we plotted the results (Figure 6).Figure 6. Voltage (top) and current (bottom) for a pulse in the DC voltage step test.Extracting and Verifying the Parameter ValuesExtracting the phase resistance from the measured data required only the application of Ohm’s law (R = V/I) using the steady-state values for voltage and current. For the PMSM we calculated the resistance as 23.26 volts / 2.01 amps = 11.60 ohms. By subtracting 10 ohms (the value of the current limiting resistor), and dividing the result by 2 to account for the two-phase resistances in series, we calculated the motor phase resistance to be 0.8 ohms.Characterizing the inductance required a more sophisticated approach. At first glance, it looks as if we could have used curve fitting, as we did when characterizing the rotor inertia. However, due to the internal resistance of the DC supply, the measured DC voltage decays from an initial value of 24 volts at the start of the test, when the current into the circuit is 0, to a steady-state value of 23.26 volts after the current is flowing in the circuit. Because the input voltage is not a pure step signal, the results from curve fitting the solution to the series RL circuit equation would not be accurate.To overcome this difficulty we opted for a more robust approach using parameter estimation and Simulink Design Optimization™. The advantage of this approach is that it requires neither a pure step input nor curve fitting.We modeled the motor’s equivalent series RL circuit with Simulink and Simscape™ (Figure 7). Simulink Design Optimization applied the measured voltage as an input to the model, and with the value of the limiting resistor (R limit) and the motor phase resistance (R_hat)already known, estimated the value of the inductance (L_hat) to make the current predicted by the model match the measured current data as closely as possible.Figure 7. Simscape model of the motor’s equivalent circuit.To verify the values that we had obtained for phase resistance (0.8 ohms) and inductance (1.15 millihenries), we plugged the values into our PMSM model and stimulated the model with the same input that we used to stimulate the actual motor. We compared the simulation results with our measured results (Figure 8). The results matched closely, with an NRMSD of about 3%.Figure 8. Comparison of measured results (blue) with simulation results (red) for voltage (top) and current (bottom).Using the Plant Model to Design the ControllerAfter identifying and verifying all key parameters, our PMSM plant model was ready to use in the development of the motor controller. We used Simulink Design Optimization to tune the proportional and integral gains of the controller’s outer loop, the velocity regulator. We ran closed-loop simulations to verify the functionality of the controller model, and used Simulink Coder to generate code from the model, which we deployed to an xPC Target turnkey real-time target machine.As a final controller verification step, we ran step response and coast-down simulations in Simulink and hardware tests using the deployed controller code on an xPC Target turnkey real-time system. We compared simulation and hardware test results for rotorvelocity and phase current, and once again found close agreement between the model and the hardware, with NRMSD below 2% in bothcases (Figure 9).Figure 9. Comparison of simulation results (blue) with hardware results (red) for rotor velocity (left) and phase current (right).SummaryDevelopment of the PMSM plant model highlighted two parameter identification tests. Data was acquired via a sensor for thecoast-down test, and with Instrument Control Toolbox via an oscilloscope for the DC voltage step test. We extracted data via curve fitting for the coast-down test and parameter estimation for the DC voltage step test. We verified all parameter values by comparing simulation results against measured test data, which enabled us to produce a plant model that we could trust as we developed and tuned the controller.All this work can be done early in the development process, well before embedded code is generated for the control system, enabling engineers to find and eliminate problems with the requirements and the design before hardware testing begins. These benefits typically far outweigh the costs associated with creating the plant model, particularly if the model can be reused on other projects.We would like to acknowledge the contribution of Professor Heath Hofmann of the University of Michigan, who recommended test procedures for characterizing a PMSM and allowed us to use his lab facilities for the initial phase of this project.Products Used▪MATLAB ▪Simulink ▪Curve Fitting Toolbox ▪Instrument Control Toolbox ▪SimPowerSystems ▪Simscape ▪Simulink Coder ▪Simulink Design Optimization ▪xPC Target Learn More ▪Webinar: A Simulink Real-Time Testing Solution for Power Electronics and Motor Control (45:08)▪Webinar: Embedded Code Generation for AC Motors (50:56)▪Video: Parameterizing and Verifying a Permanent Magnet Synchronous Motor Model (37:16)See more articles and subscribe at /newsletters .Published 201392130v00。