Lect 7 Financial Sector Development and Growth-Handout
曼昆宏观经济学第七版英文课件第八章

Consists of: k to replace depreciating capital
n k to provide capital for new workers g k to provide capital for the new “effective”
CHAPTER 8
Economic Growth II
5
Technological progress in the Solow model
We now write the production function as:
where L ×E = the number of effective workers. Increases in labor efficiency have the
If true, then the income gap between rich & poor
countries would shrink over time, causing living standards to “converge.”
In real world, many poor countries do NOT grow
CHAPTER 8Fra bibliotekEconomic Growth II
3
Examples of technological progress
From 1950 to 2000, U.S. farm sector productivity
曼昆宏观经济学第七版英文课件第二章

Gross Domestic Product: Expenditure and Income
Two definitions:
CHAPTER 2 The Data of Macroeconomics
3
The Circular Flow
Income ($) Labor
Households
Goods Expenditure ($)
CHAPTER 2 The Data of Macroeconomics
Firms
4
Gross Domestic Product: Expenditure and Income
18
U.S. Government Spending, 2008
$ billions
Govt spending
$2,882.4
- Federal
1,071.9
Non-defense
337.0
Defense
734.9
- State & local
1,810.4
CHAPTER 2 The Data of Macroeconomics
in the production of final goods
CHAPTER 2 The Data of Macroeconomics
23
Байду номын сангаас
GNP vs. GDP
▪ Gross National Product (GNP):
Total income earned by the nation’s factors of production, regardless of where located
国际会计第七版英文版课后答案(第七章)
国际会计第七版英文版课后答案(第七章)预览说明:预览图片所展示的格式为文档的源格式展示,下载源文件没有水印,内容可编辑和复制Chapter 7Financial Reporting and Changing PricesDiscussion Questions Solutions1.Historical-based financial statements may be misleading during periods of significant inflation.Many resources may have been acquired in periods when the purchasing power of the monetary unit was much higher. These expenses then typically are deducted from revenues that reflect current purchasing power. The resulting income number is unintelligible. Another problem for statement readers is that the value of assets recorded at their historical acquisition cost is typically understated as a result of inflation. Understated asset values produce understated expenses and overstated earnings.Financial trends are also difficult to interpret, as trend statistics generally include monetary units of different purchasing power. A positive trend in sales may be due to price changes, not real increases in sales.2. A price index is a cost ratio, that is, the ratio of a representative “basket” of goods and servicesconsumed by an average family, compared to the price of that same basket in a benchmark (“base”) year. The price index is invaluable in enabling a statement reader to translate sums of money paid in the past to their current purchasing power equivalents.3.This statement is partly true and shows the confusion thatsurrounds inflation accounting. Inaccounting for changing prices, users must distinguish between general price changes and specific price changes. General prices refer to the prices of all goods and services in the economy. The object of accounting for general price level changes is to preserve the general purchasing power of a company’s money capital. Specific price changes refer to changes in the prices of specific commodities. The object of accounting for specific price changes is to preserve a company’s productive capacity or operating capability.4.The congressman is wrong. The object of inflation accounting is to clarify the distinction betweencapital and income, not to minimize corporate taxes. Inflation accounting shows how much money the company can pay in expenses, taxes, and dividends, while keeping enough resources to maintain its capital.5.Although it is generally conceded in principle that price level-adjusted financial statements are moreuseful than conventional accounting statements during periods of significant inflation, it is a judgment call to identify exactly when price level-adjusted statements become more meaningful. Asa rule of thumb, executives in Brazil use an inflation rate greater than 10 % per month. Investors inGermany or Switzerland may believe that 5 % inflation per year is alarming. Unfortunately, no one has yet developed a formal, rigorous, easy-to-apply definition of meaningfulness.How does one determine whether the benefits of price level-adjusted accounting information exceed the costs? While the costs to generate such information can be measured, it is muchharder to quantify the benefits. Financial accounting deals with information produced by business enterprises for use by external decision makers. Consequently, measurement of the benefits of price level-adjusted information must cover all user groups in an economy. Multiple user groups, uneven distributions of benefits (both within and between groups), and favorable economy-wide spillover effects of price level information complicate the task. Adding international dimensions makes the problem even worse.6.The U.S. approach resembles the price-level adjusted current cost model, whereas the U.K.approach embraces the current cost model. While both require disclosure of the impact ofchanging prices on monetary items, the U.S. approach basically uses the general price level index to compute monetary gains and losses, whereas the U.K. employs specific prices changes by way of its gearing adjustment.1.The International Accounting Standards Board sanctions use of the general price level model orthe current cost framework. Whichever method is employed, these inflation adjustments must be expressed in terms of constant purchasing power as of the balance sheet date. Purchasing powergains or losses are to be included in current income. Firms adjusting their accounts for changingprices must disclose, at a minimum: a) the fact that end-of-period purchasing power adjustmentshave been made, b) the asset valuation framework employed in the primary financial statements,c) the type of inflation index or indexes employed and theirlevel at the end of the period as wellas their movements during the period, and d) the net purchasing power gain or loss on netmonetary items held during the period. Given the options that are available, analysts mustunderstand the differences between the approved inflation accounting methods to be able tocompare companies choosing one option over the other and to assure proper interpretation ofinflation adjusted amounts.2.The historical cost-constant dollar model measures the impact of general price level changes on afirm's reported performance and financial position. The current cost model examines the impact of specific price changes on enterprise income and wealth.The two measurement frameworks are similar in that both attempt to clarify the distinction between capital and income. They differ in reporting objectives. Whereas the historical cost/constant dollar model attempts to preserve the general purchasing power of a firm's original money capital, the current cost model attempts to preserve an entity's physical capital or productive capacity.3.Your authors think that restating foreign and domestic accounts to their current cost equivalentsproduces information that is far more helpful to investor decisions than historical cost methods, whether or not adjusted for changes in general price levels. Such information provides a performance measure that signals the maximum amount of resources that enterprises can distribute without reducing their productive capacity. It also facilitates comparisons ofconsolidated data.10. The gearing adjustment is an inflation adjustment that partially offsets the additional charges toincome associated with assets whose values are restated for inflation (e.g., higher depreciation and cost of sales). This adjustment recognizes that borrowers generally gain from inflation because they can repay their debts with currency of reduced purchasing power. Hence, it is unnecessary to recognize the higher replacement cost of inventory and plant and equipment in the income statement so far as they are financed by debt.11. Accounting for foreign inflation differs from accounting for domestic inflation in two major ways.First, foreign rates of inflation often are higher than domestic rates, which increases potential distortions in an entity's reported results from changing prices. Second, as foreign exchange rates and differential national rates of inflation are seldom perfectly negatively correlated, care must be taken to avoid double-dipping when consolidating the results of foreign operations.12.Double-dipping refers to methods that count the effects of foreign inflation twice in reportedearnings. Earnings are reduced once when cost of sales is adjusted upwards for inflation, andagain when inventories are translated to domestic currency using a current exchange rate, whichyields a translation loss. Since the change in the exchange rate itself was caused by inflation, the result is a double charge for inflation.Exercise Solutions1.This exercise is a good way to test students’ understanding of the various approaches toaccounting for changin g prices. Vestel’s earnings numbers are based on the general price levelmodel whereas Infosys is measuring its performance based on a current cost framework. Modello goes a step further and adjusts its current cost statements for changes in the general price level.Some may feel that current cost data, which is based on the notion of replacement costs, is toosubjective a notion to be reliable. Since general price level data are based on general price level indices, the numbers appearing in Vestel’s income statement are much more objective andfacilitates comparisons among companies using a similar methodology. Moreover, Vestel’sstatements do not violate the historical cost doctrine. Others will argue that the value of stockinvestments are based on discounted future cash flows. Accordingly, the current cost framework provided by Infosys is more germane to investor decisions as it measures the amount of earnings that could be distributed as dividends without reducing the firm’s future dividend gen eratingpotential. Moreover, current cost earnings, including the gearing adjustment , reflects how thefirm is impacted by prices that are more germane to the firm, as opposed to the general public.Some will argue that Modello’s income statement combin es the best of both worlds. However,there is merit to the argument that the income statementshould measure the performance of thefirm and that this is best accomplished with the current cost framework. Since individualinvestors are affected by the g eneral price level, they should adjust their share of a firm’s current cost earnings distributions for general inflation.2. a.Income Statement Historical Price Level Historical Cost-Cost Adjustment Constant Dollar Revenue MXP 144,000,000 420/340 MXP 177,882,353 Operating expenses (86,400,000) 420/340 (106,729,412) Depreciation (36,000,000) 420/263 (57,490,494)Operating income MXP 21,600,000 MXP 13,662,447a Monetary gains(losses) - (73,248,759)Net income MXP 53,280,000 MXP(59,586,312)Balance SheetCash MX(P 157,600,000 420/420 MXP 157,600,000Land 180,000,000 420/263 287,452,471Building 720,000,000 420/263 1,149,809,885Acc. Depreciation (36,000,000) 420/263 (57,490,494)Total MXP 1,021,600,000 MXP 1,537,371,862Owners' equity(beg.) MXP1,000,000,000 rolled forward b MXP 1,596,958,174Net income (loss) 21,600,000 (59,586,312)Owner's equity MXP 1,021,600,000 MXP 1,537,371,862(end)a Monetary loss:CashBeginning balance 1,000,000,000 420/263 1,596,958,174 Purchase ofreal estate ( 900,000,000) 420/263 (1,437,262,356)Rental revenues 144,000,000 420/340 177,882,353Operating expenses (86,400,000) 420/340 106,729,412)157,600,000 230,848,759-157,600,000 Monetary loss (73,248,759)b Beginning equity x price level adjustment = adjusted amount= P 1,000,000,000 x 420/263 = P 1,596,958,1742.b.Cost HC/Constant DollarReturn on Assets 21,600,000 (59,586,312)1,021,600,000 1,537,371,862= 2.1% = -3.9%Cost-based profitability ratios tend to provide a distorted (overstated) picture of a company's operating performance during a period of inflation.3.20X7 20X8Cash MJR 2,500 MJR 5,100Current liabilities (1,000) (1,200)LT-Debt (3,000) (4,000)Net monetary liabilities MJR (1,500) MJR (100)Zonolia Enterprise’s net monetary liability position changed by MJR1,400 during the year (MJR100) –(MJR1,500).4.Nominal Restate for ConstantMJR’s Majikstan GPL MJR’sNet monetary liab.'s MJR 1,500 x 32,900/30,000 = MJR1,645 12/31/X7Decrease during year (1,400) = (1,400)Net monetary liab.'s MJR 100 x 32,900/36,000 = MJR 9112/31/X8Monetary (general purchasing power) gain MJR 1545. Historical Current Cost Current Income Statement Cost Adjustment Cost Revenues MXP 144,000,000 - MXP 144,000,000 Operating expenses 86,400,000 - 86,400,000 Depreciation (36,000.000) 1.8 64,800,000 Net Income (loss) MXP 21,600,000 MXP (7,200,000)Balance SheetCash MXP 157,600,000 - P 157,600,000 Land 180,000,000 1.9 342,000,000 Building 720,000,000 1.8 1,296,000,000 Acc. Depreciation (36,000,000) 1.8 (64,800,000) Total MXP1,021,600,000 MXP 1,730,800,000 Owners' Equity Beg. Balance MXP1,000,000,000 MXP 1,000,000,000 OE revaluation a - 738,000,000Net income (loss) 21,600,000 (7,200,000) Total MXP1,021,600,000 MXP 1,730,800,000a Revaluation of land MXP 162,000,000Revaluation of building 576,000,000MXP 738,000,0006. Solution in 000,000's:MJR8,000 X 137.5/100.0 = MJR11,00020X7 20X8Current cost MJR8,000 MJR11,000Acc. depreciation (1,600) (3,300)aNet current cost MJR6,400 MJR7,700a Current cost depreciation = MJR800 X 137.5/100.0 = 1,100per year for 3 years.7. As no new assets were acquired during the year, we must determine to what extent the MJR3,000 increase in the current cost of Zonolia's equipment exceeded the change in the general price level during the year. The appropriate calculation follows: MJR11,000 - [MJR8,000 X 36,000/30,000]= MJR11,000 - MJR9,600= MJR1,400Alternatively, if we follow the FASB’s sug gested methodology, where calculations are expressed in average (20X8) dollars, current cost depreciation would be computed by reference to the average current cost of the related assets. Thus, Current cost, 12/31/X7 MJR8,000,000Current cost, 12/31/X8 11,000,000MJR19,000,000Average current cost MJR19,000,000/2 = MJR9,500,000Current cost depreciation at 10% = MJR950,000Increase in current cost of equipment, net of inflation (000's): Current Restate for Current cost/Cost Inflation Constant Zonos Current cost, net12/31/X7 MJR6,400 X 32,900/30,000 MJR7,019Depreciation (950) (950)Current cost, net12/31/X8 7,700 X 32,900/36,000 7,037MJR 2,250 MJR968The increase in the current cost of equipment, net of inflation is MJR968. The difference between the nominal renge amount (MJR2,250) and constant renges (MJR968) is the inflation component of the equipment's current cost increase.8. Restate-translate method:Constant Translate $ Equivalentsrenges of constantrengesIncrease in currentcost of equip., netof inflation MJR968,000 X 1/4,800 = $202Translate-restate method:CC (MJR) Translate CC ($) Restate CC/ Constant $U.S. GPLCC, net MJR 6,400,000 x 1/4,800 = $1,333 x 292.5/281.5 = $1,38512/31/X7Dep. (950,000) x 1/4,800 = (198) = (198)CC, net 7,700,000 x 1/4,800 = 1,604 x 292.5/303.5 = 1,54612/31/X8MJR 2,250,000 $ 469 $ 3599.20X7 20X8£m £mTrade receivables 242 270-Trade payables (170) (160)Net monetary working capital 72 110Change in monetary working capital = £38 (£110 - £72) Nominal Restate for Constant£British PPI £Net monetary W/C 72 X 110/100 = 79.212/31/20X7Increase during year 38 = 38.0Net monetary W/C 110 X 110/120 = 100.812/31/20X8Monetary working capital adjustment = (16.4)aa This amount is added to the current cost adjustments for depreciation and cost of sales because trade receivables exceeded trade payables, thus tying up working capital in an asset that lost purchasing power.Gearing adjustment:[(TL – CA)/(FA + I + MWC)] [CC Dep. Adj. + CC Sales Adj. + MWCA]where TL = total liabilities other than trade payablesCA = current assets other than trade receivables and inventoryFA = fixed assets including investmentsI = inventoryMWC = monetary working capitalCC Dep. Adj. = current cost depreciation adjustmentCC Sales adj. = current cost of sales adjustmentMWCA = monetary working capital adjustment= [(128 – 75)/(479 + 220 + 110] [£m 216]= [.066 ] [216]= £14.3The only number I could readily identify in problem 9 is inventory of 220. The next number I could come close on is fixed assets. Looks like the solution above says 479, the text for 08 indicates 473. I could not see where the 110 (MWC) came from. Neither is it clear where the other 3 items in brackets came from. The solution needs to be clearer before I can check the numbers.This gearing adjustment of £14.3 million is subtracted from the current cost of sales and depreciation adjustments. It represents the purchasing power gain from using debt to finance part of the firm's operating assets.a.Nominal Thai Historical Translation U.S.baht inflation c ost/constant rate dollaradjustment baht equivalentInven-tory BHT500,000 x 100/200 = BHT250,000 x .02 = $5,000b.Nominal Translation U.S. U.S. Historicalbaht rate dollar inflation c ost/constantequivalent adjustment dollarsInven-tory BHT500,000 x .02 = 10,000 x 180/198 = $9,090Sorry this seems confusing compared to number 2 where the year end index was in the numerator and either the beginning or average index was in the denominator (e.g. 420/340 or 420/263). It is not clear why we do the opposite here where the Thai price level doubles and we put the 200 in the denominator and 100 in the numerator.c. Most students will prefer the restate-translate method. This approach has merit if general and specific pricelevels move in tandem. If not, neither approach is satisfactory as both are based on a historical cost valuation framework that is generally irrelevant for investment decisions.d. For reasons enumerated in this chapter, we favor restating local currency assets for specific price changesand then translating these current cost equivalents to dollars using the current exchange rate.11. We assume that Doosan Enterprises translates its inventory at the current rate and adjusts its cost ofsales for inflation by simulating what it would have been ona LIFO basis. Two adjustments are necessarybecause local inflation impacts exchange rates used to translate foreign currency inventory balances to dollars.With FIFO inventories, a translation loss is recorded in "as reported" earnings when it is originally translatedto U.S. dollars by a current exchange rate that changed (devalued) during the period. This translation loss isan indirect charge for local inflation. The inflation adjustment (simulated LIFO charge) to increase "as reported" cost of sales to a current cost basis is an additional charge for inflation. Absent some offsettingentry, consolidated results would be charged twice for inflation. To avoid this double charge, the translation loss embodied in reported earnings is deducted from the simulated LIFO charge to arrive at a net U.S. dollarcurrent cost of sales adjustment. Steps in the adjustment process are as follows:1. FIFO inventory subject to simulated LIFO charge KRW10,920,0002. Restate line 1 to January 1 currency units(KRW10,920,000 x 100/120). The result is anapproximation of December 31 LIFO inventory KRW9,100,0003. Difference between FIFO and LIFO inventorybalances (line 1 minus line 2) is the additionallira LIFO expense (current cost adjustment)for the current year. KRW1,820,0004. Translate line 3 to dollars at the January 1exchange rate (KRW1,820,000 ÷ 900). The resultis the additional dollar LIFO expense for thecurrent year $ 2,0225. Calculate the translation loss on FIFO inventory(line 1) that has already been reflected in "asreported" results:a. Translate line 1 at Januaryexchange rate (KRW10,920,000 ÷ KRW900) $ 12,133b. Translate line 1 at December 31exchange rate (L 10,920,000 ÷ KRW1,170) $ 9,333c. The difference is the translationloss in “as reported” results $ (2,800)6. The difference between lines 4 and 5c isthe cost of sales adjustment in dollars:a. Additional dollar LIFO expense fromline 4. $ 2,022b. Less: Inventory translation loss alreadyreflected in "as reported” results (fromline 5c) $ (2,800)c. The difference is the net dollar currentcost of sales adjustment $ (778)Here, the current cost of sales adjustment is negative (i.e., reduces the dollar cost of sales adjustment). This is because the won devalued by more than the differential inflation rate (assuming a U.S. inflation rate close to zero). If the lira devalued by less than the differential inflation rate, the cost of sales adjustment would have been positive.12.1. Cost of fixed assets at 12/31 EUR20,0002. FIFO inventory at 12/31 EUR 8,0003. Total EUR28,0004. Less: Owners' equity at 12/31 EUR 2,0005. Liabilities used to financefixed assets and inventory EUR26,0006. Restate liabilities to beginningof period markka (EUR26,000 X300/390) EUR20,0007. Purchasing power gain EUR 6,0008. Purchasing power gain inpounds (EUR 6,000/EUR 1.5) £4,0009. Translation gain on appliedliabilities(EUR 26,000/EUR 1.5 -EUR26,000/EUR1.95) £4,00010. Net purchasing power gain £ -0-In this case the translation gain on liabilities used to finance nonmonetary assets equals the purchasing power gain because the currency devaluation matched the differential inflation of 30%. Hence, no purchasing power gains would be recognized.Case 7-1 SolutionCase 7.1 Kashmir Enterprises1.a–cHistorical Price Level HistoricalCost Adjustment Cost ConstantIncome Statement RupeesRevenues INR6,000,000 160/144 I NR6,666,667Cost of Sales 2,560,000 160/128 3,200,000Selling & Admin. 1,200,000 160/144 1,333,333Depreciation 160,000 160/128 200,000Interest 240,000 160/160 240,000Monetary gains (losses)a - 741,666Net Income INR1,840,000 INR2,435,000Balance SheetCash INR2,480,000 160/160 I NR2,480,000 Inventory 480,000 160/128 600,000Building 3,200,000 160/128 4,000,000Accu. depreciation (160,000) 160/128 (200,000) Total INR6,000,000 INR6,880,000Accounts payable INR 620,000 160/160 I NR 620,000 Notes payable 2,400,000 160/160 2,400,000 Owners' equity 2,980,000 3,860,000INR 6,000,000 INR6,880,000a Monetary gains/(losses):CashBeg. balance INR 720,000 160/128 INR1,150,000 Down payment (800,000) 160/128 (1,000,000) Sales 6,000,000 160/144 6,666,667Selling & Adm. exp. (1,200,000) 160/144 (1,333,333) Payment on account (2,200,000) 160/144 (2,444,444) Interest (240,000) 160/160 (240,000)INR 2,480,000 INR2,798,890-2,480,000Monetary loss INR (318,890)a Monetary gains and losses:Accounts PayableBeg. balance INR 420,000 160/128 INR525,000 Purchases 2,400,000 160/128 3,000,000Payments on account (2,200,000) 160/144 (2,444,444) INR 620,000 INR1,080,556- 620,000Monetary gain INR 460,556a Monetary gains/(losses):Notes PayablePurchase warehouse INR 2,400,000 160/128 INR 3,000,000 - 2,400,000Monetary gain INR 600,000Net monetary loss: INR(318,890) + INR460,556 + INR600,000 = INR741,666.Current Cost Financial StatementsHistorical Adjustment Current Cost Income Statement Cost F actor EquivalentsRevenues INR6,000,000 - INR 6,000,000Cost of Sales 2,560,000 1.3 3,328,000Selling and adm. 1,200,000 - 1,200,000Depreciation 160,000 1.4 224,000Interest 240,000 - 240,000Net Income INR 1,840,000 INR1,008,000Balance SheetCash INR 2,480,000 - INR 2,480,000Inventory 480,000 1.3 624,000Building 3,200,000 1.4 4,480,000Acc. depreciation 160,000 1.4 224,000Total INR 6,000,000 INR 7,360,000Accounts payable INR 620,000 - INR 620,000Notes payable 2,400,000 - 2,400,000Owners' equity 2,980,000 4,340,000INR 6,000,000 INR 7,360,0002. Your authors favor current cost over historical or historical cost/constant dollar financial statements. Finance theory states that investors are interested in a firm's dividend-generating potential, as the value of their investment depends on future cash flows. A firm's dividend-generating potential, in turn, is directly related to its productive capacity. Unless a firm preserves itsproductive capacity or physical capital(e.g.,plant, equipment, inventories), dividends can’t be sustained over time. Under these circumstances, current cost financial statements give investors information important to their decisions. They show the maximum resources that a firm can distribute to investors without impairing its operating capability.3.Translate-Restate MethodBalance Sheet, Jan. 1Local Currency Trans. Dollar Inflation Historical costRate Equivalents Adjustment Constant $Cash INR 920,000 .025 $23,000 - $23,000Inventory 640,000 .025 16,000 - 16,000 Total INR1,560,000 $39,000 $39,000A/P INR 420,000 .025 $10,500 - $10,500 Owners' equity 1,140,000 .025 28,500 - 28,500 Total INR 1,560,000 $39,000 $ 39,000Income StatementDec. 31Revenues INR 6,000,000 .022 $ 132,000 108/104 $ 137,077 Cost of sales 2,560,000 .022 56,320 108/100 60,825Selling & Adm. 1,200,000 .022 26,400 108/104 27,415 Depreciation 160,000 .022 3,520 108/100 3,802 Interest 240,000 .022 5,280 108/108 5,280Net Income INR 1,840,000 $ 40,480 $ 39,755 Monetary gains (losses)a - - 4,468$44,223a Monetary gains/(losses):CashBeg. Bal INR 920,000 .02 $ 18,400 108/100 $ 19,872Downpayment (800,000) .02 (16,000) 108/100 (17,280) Sales 6,000,000 .02 120,000 108/104 124,615Selling & Adm. (1,200,000) .02 (24,000) 108/104 (24,923)Payments on Acc. (2,200,000) .02 (44,000) 108/104 (45,692) Interest (240,000) .02 (4,800) 108/108 (4,800)INR 2,480,000 $ 49,600 51,792-49,600Monetary loss $ (2,192) Accounts PayableBeg. Bal. INR 420,000 .02 $ 8,400 108/100 $ 9,072Purchases 2,400,000 .02 48,000 108/100 51,840Pmt. on acc. (2,200,000) .02 (44,000) 108/104 45,692INR 620,000 $ 12,400 $ 15,592- 12,400Monetary gain $ 2,820Notes payablePur. W/house Rpe 2,400,000 .02 $ 48,000 108/100 $ 51,840 48,000Monetary gain $ 3,840Netmonetary gain: $(2,192) + $2,820 + $3,840 = $4,468.Balance Sheet Local Trans. Dollar Inflation Historical cost- Dec. 31 Currency Rate Equiv. Adjustment Constant $Cash INR 2,480,000 .02 48,600 108/108 $ 48,600 Inventory 480,000 .02 9,600 108/100 10,368 Building 3,200,000 .02 64,000 108/100 69,120Acc. Dep. 160,000 .02 3,200 108/100 3,456Total INR 6,000,000 $120,000 $ 124,632Acc. payable 620,000 .02 12,400 108/108 $ 12,400Notes payable 2,400,000 .02 48,000 108/108 48,000Trans. adj.b - (9,380) (9,978)Owners' equity c 2,980,000 68,980 74,210Total INR 6,000,000 $120,000 $124,632________________________________________________________________ __b Translation adjustment:Beginning net assets Rpe 1,140,000 (.02 - .025) = $ (5,700) X 108/100 = $(6,156)Increase in net assets Rpe 1,840,000 (.02 - .022) = (3,680) X 108/104 = $(3,822)$(9,380) $(9,978) c Balancing residualRestate - Translate MethodBalance Sheet Local Inflation Historical Cost- Trans. D ollar Jan 1. Currency Adjustment Constant rupee Rate equivalents Cash INR 920,000 128/128 INR 920,000 .025 $ 23,000 Inventory d 640,000 128/128 640,000 .025 16,000Total INR1,560,000 INR1,560,000 $ 39,000Acct. payable INR 420,000 128/128 INR 420,000 .025 $ 10,500Owner's equity 1,140,000 1,140,000 28,500Total INR 1,560,000 INR 1,560,000 $ 39,000d Assumes inventory acquired near year-end.Income StatementYear ended Dec. 31Revenues INR 6,000,000 160/144 INR 6,666,666 .022 $ 146,667Cost of Sales 2,560,000 160/128 3,200,000 .022 70,400 Selling & Adm. 1,200,000 160/144 1,333,333 .022 29,333 Depreciation 160,000 160/128 200,000 .022 4,400Interest 240,000 160/160 240,000 .022 5,280Net Income INR1,840,000 INR1,693,334 $ 37,254 Monetary gains(losses)a- 741,666 .022 16,317INR2,435,000 $ 53,571Balance SheetDec. 31Cash INR 2,480,000 160/160 INR 2,480,000 .02 $ 49,600Inventory 480,000 160/128 600,000 .02 12,000Building 3,200,000 160/128 4,000,000 .02 80,000Acc. deprec. 160,000 160/128 200,000 .02 4,000Total INR 6,000,000 INR 6,880,000 $137,600Acc. payable INR620,000 160/160 INR 620,000 .02 $ 12,400 Notes payable 2,400,000 160/160 2,400,000 .02 48,000Owner's equity 2,980,000 3,860,000 87,770 Translation adj.b - (10,570)Total INR 6,000,000 INR 6,880,000 $137,600________________________________________b Beginning net assets INR1,140,000 (.02 - .025) = $ (5,700)Change in net assets 2,435,000 ).02 - .022) = $(4,870)$(10,570)Both methods are inadequate for American investors because they are based on the historical cost valuation framework. A better reporting procedure is to restate local accounts to their current cost equivalents, then translate these amounts to the reporting currency using the year-end (current) foreign exchange rate. This is illustrated here.Restate (current cost)/Translate (current rate)Cash INR 920,000 - INR 920,000 .025 $ 23,000Inventory 640,000 - 640,000 .025 16,000Total INR 1,560,000 INR1,560,000 $ 39,000Acc. payable INR 420,000 - INR 420,000 .025 $ 10,500Owner's equity 1,140,000 - 1,140,000 28,500。
【PPT精品课件】货币金融学7版英文课件--14-大学课件2-专业PPT文档

• The Bank was created by the Bank of Canada Act in 1934 and started operations on March 11, 1935
• Initially the Bank was a private institution but was nationalized in 1938, so is now a national institution with headquarters in Ottawa
By 1945, however, the bank had a monopoly over note issue in the country.
The Bank also conducts ongoing research, working closely with private sector partnerships and note-issuing authorities in other countries, in order to improve costeffectiveness, increase the durability of bank notes, and reduce counterfeiting.
© 2005 Pearson Education Canada Inc.
14-7
Government Debt and Asset Management Services
As the federal government’s fiscal agent, the Bank • provides debt-management services for the federal
ch1 lecture notes-06-handout

Ch. 2 Conceptual Framework underlying Financial Reporting
What is the conceptual framework?
The conceptual framework is, like a constitution, a coherent set of objectives and fundamentals that can lead to consistent standards and that prescribes the nature, function, and limits of financial accounting and financial statements.
CH.1 FINANCIAL ACCOUNTING AND ACCOUNTING STANDARDS
I. ACCOUNTING
- is an information system that identifies, measures, and communicates financial information about economic entities to interested persons.
Financial Statements
- B/S - I/S - STATEMENT OF CASH FLOWS - STATEMENT OF SHAREHOLDERS' EQUITY
III.GENERALLY ACCEPTED ACCOUNTING PRINCIPLES (GAAP)
IV.HISTORY OF ACCOUNTING STANDARDS SETTING
1939 - 1959 Committppointed by AICPA - Issued 51 Accounting Research Bulletins
21世纪大学实用行业英语综合教程Unit 7

Unit 7 Financial Accounting
Reading
Oral Practice
MiniProject
Phrases & Terms
Surfing the Internet
Video Clip
Words & Phrases positive /pztv/ a. 积极的;正面的
Unit 7 Financial Accounting
Reading
Oral Practice
MiniProject
Phrases & Terms
Surfing the Internet
Video Clip
Chinese Version
会计介绍
基本会计概念 会计是一个过程,用来衡量和记录一个企业的财产和负 债的财务价值,并随着时间的推移当价值发生变化时加以监 控。一个企业可以是指个人、公司或其他任何需作会计记录 的实体。
Unit 7 Financial Accounting
Learniቤተ መጻሕፍቲ ባይዱg Objectives
From studying this unit, students are expected to 1. learn the basics of accounting; 2. have the knowledge of cash flow; 3. learn about internal control.
Unit 7 Financial Accounting
Unit 7 Financial Accounting 财务会计
Unit 7 Financial Accounting
Part I Reading Part II Oral Practice Part III Mini-Project Part IV Phrases & Terms Part V Surfing the Internet Part VI Video Clip
产业组织理论参考教材及经典文献选读
《产业组织理论》参考教材及经典文献选读一、参考教材:1.廖进球主编:产业组织理论,上海财经大学出版社,2012年。
2.施马兰西、威利格:产业组织经济学手册(第1卷),经济科学出版社,2009年。
3.斯蒂芬•马丁:高级产业经济学,上海财经大学出版社,2003年。
4.泰勒尔:产业组织理论,中国人民大学出版社,1997年。
5.夏伊:产业组织理论与应用,清华大学出版社,2005年。
6.卡尔顿、佩洛夫:现代产业组织,中国人民大学出版社,2009年。
7.乔治·J·施蒂格勒:产业组织和政府管制,潘振民译,上海三联书店,1989年。
二、经典外文文献选读(References for Industrial Organization)I. The Theory of the FirmA. Theory1. Tirole, Introduction and The Theory of the Firm.2. Chandler, ''Organizational Capabilities and the Economic History of the Industrial Enterprise,''Journal of Economic Perspectives, 6 (Summer 1992), 79-100.3. R. Coase, ''The Nature of the Firm,'' reprinted in G. Stigler and K. Boulding, eds., Readings in Price Theory, Irwin, 1952, 33 l-351.4. S. Grossman and O. Hart, ''The Costs and Benefits of Ownership: A Theory of Vertical and Lateral Integration," Journal of Political Economy, 94 (August 1986), 691 -796.5. B. Holmstrom and J. Tirole, ''The Theory of the Firm," in HIO.6. B. Klein, R. Crawford, and A. Alchian, ''Vertical Integration, Appropriable Rents, and the Competitive Contracting Process,''Journal of Law and Economics, 21 (October l978), 297-326.7. O. Williamson,The Economic institutions of Capitalism, Free Press, 1985, Chapters 3-6 (especially 1 and 3).B. Empirical Evidence on Asset Specificity1. E. Anderson and D. Schmittlein, ''Integration of the Sales Force: An EmpiricalExamination,"Rand Journal of Economics,15(Autumn 1984), 327-343.2. P. Joskow, ''Vertical Integration and Long Term Contracts: The Case of Coal-Burning Electric-Generating Plants,"Journal of Law, Economics and Organization, I (Spring 1985), 33-80.3. P. Joskow, ''Contract Duration and Relationship-Specific Investments: Empirical Evidence from Coal Markets,"American Economic Review, 77 (March 1987), 168-l85.4. P. Joskow, ''Asset Specificity and the Structure of Vertical Relationships: Empirical Evidence," Chapter 8 in O. Williamson and S. Winter,The Nature of the Firm:Origins, Evolution, and Development,Oxford 1993, 117-137.5. K. Monteverde and D. Teece, ''Supplier Switching Costs and Vertical Integration in the Automobile Industry,''BellJournal of Economics, 13 (Spring 1982), 206-213.6. A. Shepard, "Contractual Form, Retail Pricing and Asset Characteristics in Gasoline Retailing,"Rand Journal of Economics, 24(Spring 1993), 58-77.II. Monopoly PricingA. Basic Monopoly Pricing and Durable Goods1. Tirole, Chapter 1 (including supplementary section).2. M. Pesendorfer, ``Retail Sales. A Study of Pricing Behavior in Supermarkets,'' mimeo.B. First and Third Degree Price Discrimination1. Tirole, Sections 3.0 - 3.22. Katz, M., "The Welfare Effects of Third-Degree Price Discrimination in Intermediate Goods Markets,"American Economic Review, 77, (March 1 987), pp. 154-67.3. Schmalensee, R., ''Output and Welfare Implications of Monopolistic Third-Degree Price-Discrimination,''American Economic Review,71 (March 1981), pp. 242-47.4. Varian, H., ''Price Discrimination and Social Welfare,''American Economic Review, 75 (September 1985), pp. 870-5.5. Perry, Martin, ''Forward Integration by ALCOA: 1888-1930,"Journal of Industrial Economics,29 (l), September 1980, pp. 37-53.C. Second Degree Price Discrimination1. Tirole, Sections 3.3 - 3.5.2. Maskin, E. And J. Riley, "Monopoly with Incomplete Information,"Rand Journal of Economics15 (Summer 1984), pp. 171-96,3. Oi, W., ''A Disneyland Dilemma: Two-Part Tariffs for a Mickey-Mouse Monopoly,''Quarterly Journal of Economics,85 (February 197l), pp. 77-96.4. McAfee, P., J. McMillan, and M. Whinston, ''Multiproduct Monopoly, Commodity Bundling, and Correlation of Values,''Quarterly Journal of Economics, 104 (May 1989), pp. 37l-83.5. Blackstone, E., ''Restrictive Practices in the Marketing of Electrofax Copying Machines. The SCM Corporation Case,''Journal of Industrial Economics, 23 (March 1975), pp. 189-202.6. Shepard, A., ''Price Discrimination and Retail Configuration,''Journal of Political Economy, 99 (February 1991), pp. 30-53.7. I. Ayers, and P. Siegelman, "Race and Gender Discrimination in Bargaining for a New Car,''American Economic Review, 85 (June 1995), 304-321.8. Borenstein, S. and N. Rose, "Competition and Price Dispersion in the U.S. Airline Industry,"Journal of Political Economy, 102 (August 1994), 653-683.III. Estimating Demand (and Supply)1. Deaton and J. Muellbauer,Economics and Consumer Behavior, Parts 1 and2.2. S. Anderson, A. De Palma and J. Thisse,Discrete Choice Theory of Product Differentiation, Chapters 2-5.3. D. Epple, "Hedonic Prices and Implicit Markets: Estimating Demand and Supply Functions for Differentiated Products,Journal of Political Economy, 95 (February 1987), 59-80.4. Berry, S., J. Levinsohn, and A. Pakes, ''Automobile Prices in Market Equilibrium,"Econometrica, Vol. 63, No. 4, July 1995, pp. 841-890.5. A. Petrin, "Quantifying the Benefits of New Products: The Case of the Minivan'', mimeo.6. Goldberg, P.K., ''Product Differentiation and Oligopoly in international Markets: The Case of the U.S. Automobile Industry,''Econometrica, Vol. 63, No. 4, July 1995, pp. 891-952.7. S. Ellison, I. Cockburn, Z. Griliches and J. Hansman, "Characteristics of Demand for Pharmaceutical Products: An Examination of Four Cephalosporins,''Rand Journal of Economics, 28, Autumn 1997, 426-446.8. J. Hausman, "Valuation of New Goods under Perfect and Imperfect Competition,'' inTheEconomics of New Goods, T. Bresnahan and R. Gordon (eds.) and comment by T. Bresnahan.9. J. Hansman, "Reply to Prof. Bresnahan," mimeo.10. T. Bresnahan, "The Apple-Cinnamon Cheerios War: Valuing New Goods, Identifying Market Power, and Economic Measurement," mimeo.IV. Introduction to Strategic Behavior and Static CompetitionA. Introduction to Strategic Behavior1. D. Fudenberg and J. Tirole, ''Noncooperative Game Theory for Industrial Organization: An Introduction and Overview,'' inHIO.2. Tirole, pp. 205-208 and Chapter 11.B. Prices and Output1. C. Shapiro, ''Theories of Oligopoly Behavior," inHIO.2. Tirole, Chapters 2.1 and 5.3. D. Kreps and J. Scheinkman, ''Quantity Precommitment and Bertrand Competition Yield Cournt Outcomes,"BellJournal of Economics,14 (Autumn 1983), 326-337.4. Klemperer, P., "The Competitiveness of Markets with Switching Costs,"Rand Journal of Economics, 18 (Spring 1987), pp. 138-50.5. Sutton, J., and A. Shaked, ''Relaxing Price Competition through Product Differentiation,''Review of Economic Studies,49 (January 1982), pp. 3- 14.6. D. Stalil, "Oligopolistic Pricing with Heterogeneous Consumer Search,''International Journal of Industrial Organization, 14 (April 1996), 243-268.V. Dynamic CompetitionA. Theory1. Tirole, Chapter 6.2. Rotemberg, J. J. and G. Saloner, "A Supergame-Theoretic Model of Price Wars During Booms,''American Economic Review, 76 (June 1986), 390-407.3. K. Bagwell and R. W. Staiger, "Collusion over the Business Cycle,''Rand Journal of Economics, (Spring 1997), 82-106.4. Brock, W. and J. Scheinkman, "Price-Setting Supergames with Capacity Constraints,''Review of Economic Studies, 52 (1985), pp. 37 l-82.5. Green, E. and R. Porter, ''Non-cooperative Collusion Under Imperfect PriceInformation,''Econometrica, 52 (January 1984), pp. 87-100.6. Maskin, E. and J. Tirole, "A Theory of Dynamic Oligopoly II: Price Competition, Kinked Demand Curves, and Edgeworth Cycles,"Econometrica, 56 (May 1988), pp.571 -99.7. Bernheim and M. Whinston, "Multimarket Contact and Collusive Behavior,"Rand Journal of Economics, 21 (Spring 1990), l-26.8. Stigler, G.J., "A Theory of Oligopoly,"Journal of Political Economy, 72 (February l964), pp. 44-61.B. Empirical Evidence1. R. Porter, ''A Study of Cartel Stability: The Joint Economic Committee, 1880-l886,"Bell Journal of Economics, 14 (Autumn 1983), 301-314.2. G. Ellison, ''Theories of Cartel Stability and the Joint Executive Committee,''Rand Journal of Economics, 25 (Spring 1994), 37-57.3. D. Genesove and W. Mullin, "Narrative Evidence on the Dynamics of Collusion: The Sugar Institute Case, " mimeo.4. R. Grether and C. Plott, ''The Effects of Market Practices in Oligopolistic Markets: An Experimental Examination of the Ethyl Case,''Economic inquiry, 22 (October l984), 479-507.5. M. Levenstein, "Price Wars and the Stability of Collusion: A Study of the PreWorld War I Bromine industry,''The Journal of Industrial Economics, June 1997, 117-138.6. S. Borenstein and A. Shepard, ''Dynamic Pricing in Retail Gasoline Markets,''The Rand Journal of Economics, Autumn 1996, Vol. 27, No. 3, pp. 429-451.VI. Empirical Studies of Firm ConductA. Inter-Industry Studies1. F. M. Scherer and D. Ross, Industrial Market Structure and Economic Performance, Chapter 11.2. R. Schmalensee, ''Interindustry Studies of Structure and Performance,'' inHIO.3. Demsetz, H., "Industry Structure, Market Rivalry and Public Policy,''Journal of Law and Economics, 16, (1973), l-10.4. I. Domowitz, R. Hubbard and B. Petersen, "Business Cycles and the Relationship Between Concentration and Price-Cost Margins,"Rand Journal of Economics, 17(Spring 1986), 1-17.5. R. Schmalensee, ''Do Markets Differ Much?"American Economic Review, 75 (June 1985), 341-351.6. M. Salinger, "The Concentration-Margin Relationship Reconsidered,''Brookings Papers on Economic Activity: Microeconomics,1990, 287-335.B. Theory of Conduct Parameters1. T. Bresnahan, "The Oligopoly Solution Concept is Identified,"Economics Letters, 10, 1982, 87-92.2. L. Lau, "On Identifying the Degree of Competitiveness from Industry Price and Output Data,''Economics Letters, 10, 1982, 93-99.3. J. Panzar and J. Rosse, "Testing for 'Monopoly' Equilibrium,"Journal of Industrial Economics, 35 (June 1987), 443-456.4. K. Corts, "Conduct Parameters and the Measurement of Market Power,''Journal of Econometrics???C. Industry-Specific Studies of Firm Conduct1. T. Bresnahan, "Empirical Studies of Industries with Market Power,'' inHIO.2. R. Coterill, "Market Power in the Retail Food Industry: Evidence from Vermont,"Review ofEconomics and Statistics, 68 (August 1986), 379-386.3. A. Nevo, "Measuring Market Power in the Ready-to-Eat Cereal Industry,'' mimeo.4. T. Bresnahan, "Competition and Collusion in the American Automobile Industry: The 1955 Price War,''Journal of Industrial Economics, 35 (June 1987), 457-482.5. D. Genesove and W. Mullin, "Testing Oligopoly Models: Conduct and Cost in the Sugar Industry, 1898-1914,''Rand Journal of Economics,29 (Summer 1 998), 355-377.6. C. Wolfram, "Measuring Duopoly Power in the British Electricity Spot Market,'' mimeo.7. Baker, J. and T. Bresnahan, ''Empirical Methods of Identifying and Measuring Market Power,"Antitrust Law Journal,Vol.61, 1992,pp.3-16.VII. EntryA. Basic Theory1. Tirole, Sections 7.l-7.22. Mankiw, N.G. and M.D. Whinston, "Free Entry and Social Inefficiency,''Rand Journal of Economics,17 (Spring 1986), pp. 48-58.3. Anderson, S., A. de Palma, and Y. Nesterov, "Oligopolistic Competition and the Optimal Provision of Products,"Econometrica, Vol. 63, No. 6, November 1995, pp.l281-1302.4. Sutton, J.,Sunk Costs and Market Structure, MIT Press, 1991, Chapters l-2.5. B. Jovanovic, ''Selection and the Evolution of Industry,"Econometrica, (May 1982), 649-670.6. Banmol, W.K., J.C. Panzar, and R.D. Willig, ''On the Theory of Perfectly Contestable Markets," in J.E. Stiglitz and G.F. Mathewson, eds.,New Developments in the Analysis of Market Structure, MIT Press, 1986.B . Empirical Evidence1. T. Bresnahan and P. Reiss, ''Entry and Competition in Concentrated Markets,'' Journal of Political Economy, 99 (October 1991), 977- 009.2. Comments on Bresnahan and Reiss,Brookings Papers on Economic Activity: Special Issue on Microeconomics, 3 (1987), 872-882.3. T. Dunne, M. Roberts, and L. Samuelson, ''Patterns of Firm Entry and Exit in U.S. Manufacturing,''Rand Journal of Economics, 19 (Winter 1988), 495-515.4. Berry, S. and J. Waldfogel, ''Free Entry and Social Inefficiency in Radio Broadcasting," June 1996.5. S. Berry, ''Estimation of a Model of Entry in the Airline industry, "Econometrica, 60 (July 1992), 889-918.VIII. Strategic InvestmentA. General Considerations1. Tirole, pp. 207-8, Chapter 8.2. J. Bulow, J. Geanakoplos and P. Klemperer, '`Multimarket Oligopoly: Strategic Substitutes and Complements,"Journal of Political Economy,93 (June 1985), 488-511.3. D. Fudenberg and J. Tirole, "The Fat Cat Effect, the Puppy Dog Ploy and the Lean and Hungry Look,''American Economic Review, 74 (May 1 984), 36 1 -366.4. R. Gilbert, ''Mobility Barriers and the Value of Incumbency," inHIO.B. Capacity, Product Differentiation, beaming Curves, Contracts1. A. Dixit, ''The Role of Investment in Entry Deterrence,''Economic Journal, 90 (March l980), 95-106.2. R. Schmalensee, ''Economies of Scale and Barriers to Entry,''Journal of Political Economy, 89(December 1981), pp. 1228-38.3. J.R. Gelman and S.C. Salop, ''Judo Economics. Capacity Limitation and Coupon Competition,''BellJournal of Economics, 14 (Autumn 1983), pp. 315-25.4. D. Fudenberg and J. Tirole, "Capital as a Commitment: Strategic Investment to Deter Mobility,''Journal of Economic Theory,31 (December 1983), 227-250.5. R. Schmalensee, ''Entry Deterrence in the Ready-to-Eat Breakfast Cereal Industry,''BellJournal of Economics, 9 (Autumn 1978), pp. 305-27.6. K. Judd, ''Credible Spatial Preemption,"Rand Journal of Economics,16 (Summer 1985), pp. 153-66.7. D. Fudenberg and J. Tirole, "Learning by Doing and Market Performance,''BellJournal of Economics,14 (Autumn 1983), pp. 522-30.8. P. Aghion and P. Bolton, "Entry Prevention Through Contracts with Customers,''American Economic Review, 77, June 1987, pp. 388-401.9. T.E. Cooper, "Most-Favored Customer Pricing and Tacit Collusion,''Rand Journal of Economics, 17 (Autumn 1986), pp. 377-88.10. J. J. Laffont, P. Rey and J. Tirole, "Network Competition I: Overview and Nondiscriminatory Pricing,''Rand Journal of Economics, 29 (Spring 1 998), l -37.C. Empirical Evidence on Strategic Investment1. J. Chevalier, "Capital Structure and Product Market Competition: Empirical Evidence from the Supermarket Industry,''American Economic Review, June 1995.2. M. Lieberman, "Post Entry investment and Market Structure in the Chemical Processing Industry,"Rand Journal of Economics, 18 (Winter 1987), 533-549.3. G. Hurdle, et al., "Concentration, Potential Entry, and Performance in the Airline Industry,''Journal of Industrial Economics,38 (December 1989), 119-140.4. R. Smiley, "Empirical Evidence on Strategic Entry Deterrence,''International Journal of Industrial Organization, 6 (June 1988), 167- 180.IX. Information and Strategic BehaviorA. Limit Pricing1. Tirole, Sections 9.0 - 9.4.2. P. Milgrom and J. Roberts, ''Limit Pricing and Entry Under Incomplete Information: An Equilibrium Analysis,''Econometrica, 50 (March 1982), 443-460.B. Predation1. Tirole, Sections 9.5 - 9.7.2. P. Milgrom and J. Roberts, ''Predation, Reputation, and Entry Deterrence,"Journal of Economic Theory,27 (August 1982), pp. 288-312.3. G. Saloner, ''Predation, Merger, and Incomplete information,"RandJournal of Economics,18 (Summer 1987), pp. 165-186.4. D. Fudenberg and J. Tirole, ''A 'Signal-Jamming' Theory of Predation,''Rand Journal of Economics, 17 (Autumn 1986), pp. 366-76.5. P. Bolton and D. Scharfstein, ''A Theory of Predation Based on Agency Problems in Financial Contracting,''American Economic Review, 80 (March 1 990), pp. 93- 106.6. Benoit, J.P., ''Financially Constrained Entry in a Game of Incomplete Information,"Rand Journal of Economics,15, pp. 490-99.7. J. Oulover and G. Saloner, ''Predation, Monopolization and Antitrust," inHIO.C. Empirical Studies of Information Asymmetries and Predation1. D. Cooper, S. Garvin and J. Kagel, "Signaling and Adaptive Learning in an Entry Limit Pricing Game,''Rand Journal of Economics, 28 (Winter 1997), 662-683.2. D. Genesove, "Adverse Selection in the Wholesale Used Car Market,''Journal of Political Economy,101 (August 1993), 644-665.3. M. Doyle and C. Snyder, "Information Sharing and Competition in the Motor Vehicle Industry," mimeo.4. T. Hubbard, "Consumer Beliefs and Buyer and Seller Behavior in the Vehicle Inspection Market,'' mimeo.5. J. McGee,'' Predatory Price Cutting The Standard Oil (NJ) Case,''Journal of Law and Economics, l (October 1958), 137-169.6. D. Genesove and W. Mullin, "Predation and Its Rate of Return: The Sugar industry, l887- 1914,"NBER Working Paper6032, 1997.7. D. Weiman and R. Levin, ''Preying for Monopoly: Southern Bell,"Journal of Political Economy,102 (February 1994), 103-26.8. Kadiyali, V., ''Entry, Its Deferrence, and its Accommodation: A Study of the U.S. Photographic Film Industry,"The Rand Journal of Economics, Autumn 1 996, Vol. 27,X. Advertising1. Tirole, Sections2.2-2.4, 7.32. M. Stegeman, ''Advertising in Competitive Markets,''American Economic Review, 81 (March 1991), 210-223.3. F. M. Scherer and D. Ross,Industrial Market Structure and Economic Performance, Chapter 18.4. Kwoka, J. ''Advertising the Price and Quality of Optometric Services,''American Economic Review Papers and Proceedings, 1984, 211 -216.5. P. Ippolito and A. Mathios, ''Information, Advertising and Health: A Study of the Cereal Market,''Rand Journal of Economics,21 (Autumn 1 990), 459-480.6. D. Ackerberg, "Advertising, Learning, and Consumer Choice in Experience Good Markets: An Empirical Examination,'' mimeo.XI. Auctions1. P. McAfee and J. McMillan, ''Auctions and Bidding,"JEL, June 1987, pp. 699-738.2. P. Milgrom, "Auctions and Bidding: A Primer,"JEP, Summer 1989, pp. 3-22.3. K. Hendricks and R. Porter, ''An Empirical Study of an Auction with Asymmetric Information,''American Economic Review, December 1 988, pp. 865-83.4. R. Porter, ''The Role of Information in U.S. Offshore Oil and Gas Lease Auctions,"Econometrica, 63 (January 1995), pp. 1-27.5. R. Porter and D. Zona, "Detection of Bid Rigging in Procurement Auctions,"JPE, June 1993, pp.5 18-38.6. P. Bajari, "Econometrics of the First Price Auction with Asymmetric Bidders," mimeo.7. J.-J. Laffont, H. Ossard, and Q. Vuong, ''Econometrics of First Price Auctions,''EM, July 1995, pp. 953-80.8. J. Kagel, R. Harstad and D. Levin, ''Information Impact and Allocation Rules in Auctions with Affiliated Private Values: A Laboratory Study, "Econometrica, 55 (1987), pp. 1275- 1304.9. J. Kagel, ''Auctions: A Survey of Experimental Research,'' in J. Kagel and A. Roth, eds.,The Handbook of Experimental Economics.XII. Technological ChangeA. Research and Development1. Tirole, Sections 10.l - 10.5, 8. l.32. G. C. Loury, ''Market Structure and Innovation,''Quarterly Journal of Economics, 93 (1979), pp. 395-410.3. D. Fudenberg, R. Gilbert, J. Stiglitz, and J. Tirole, "Preemption, Leapfrogging, and Competition in Patent Races,"European Economic Review, 22 (1983), pp. 3-31.4. D. Fudenberg and J. Tirole, ''Preemption and Rent Equalization in the Adoption of New Technology,''Review of Economic Studies, 52 (1985), pp. 383-401.5. Symposium on Patent Policy,Rand Journal of Economics, 21 (Spring 1990).B. Standardization1. J. Farrell and G. Saloner, "Standardization, Compatibility, and Innovation,''Rand Journal of Economics, 16 (1985), pp. 70-83.2. M. Katz and C. Shapiro, ''Technology Adoption in the Presence of Network Externalities,"Journal of Political Economy, 94 (1986), pp. 822-841.C. Diffusion of Technologies1. Rogers and Shoemaker,The Diffusion of Innovation: A Cross-Cultural Approach, Free Press, 1971.2. G. Ellison and D. Fudenberg, "Rules of Thumb for Social Learning,"Journal of Political Economy, 101 (1993), pp. 612-643.D. Empirical Studies1. A. Pakes, "Patents as Options: Some Estimates of the Value of Holding European Patent Stocks,Econometrica, 54 (July 1986), 755-784.2. M. Trajtenberg, "The Welfare Analysis of Product Innovations with an Application to Computed Tomography Scanners,"Journal of Political Economy, 97 (April 1989), 444-479.3. G. Saloner and A. Shepard, "Adoption of Technologies with Network Effects: An Empirical Examination of the Adoption of Automated Teller Machines,"Rand Journal of Economics, 13 (Autumn 1995), 479-501.4. T. Hubbard, "Why Are Process Monitoring Technologies Valuable? The Use of On-Board Information Technology in the Trucking Industry," mimeo.5. E. Mansfield, "How Rapidly Does New industrial Technology Leak Out?"Journal of Industrial Economics, 34 (December 1985), 217-223.6. N. L. Rose and P. L. Joskow, ''The Diffusion of New Technologies. Evidence from the Electric Utility industry,"Rand Journal of Economics, 21 (Autumn 1990), 354-373.XIII. Managerial incentives and Firm Behavior1. Tirole, pages 34-55.2. B. Holmstrom, "Managerial Incentive Problems - A Dynamic Perspective,'' inEssays in Honor of Lars Wahlbeck,1982.3. S. Grossman and O. Hart, "Takeover Bids, the Free-Rider Problem and the Theory of the Corporation,''BellJournal of Economics, 11 (Spring 1980), 42-64.4. A. Shleifer and R. Vishny, "Large Shareholders and Corporate Control,''Journal of Political Economy, 94 (June 1996), 461-488.5. O. Hart, "The Market Mechanism as an Incentive Scheme,''BellJournal of Economics,14 (Autumn 1983), 366-382.6. C. Fershtman and K. Judd, "Equilibrium Incentives in Oligopoly,"American Economic Review, 77(December 1987), 927-940.7. R. Masson, "Executive Motivation, Earnings, and Consequent Equity Performance,"Journal of Political Economy, 79 (December 1971), 1278- 1292.8. P. Healy, "The Effect of Bonus Schemes on Accounting Decisions,''Journal of Accounting and Economics,7 (April 1985), 85-107.XIV. Antitrust: Overview1. Kaye, Scholer, Fierman, Hays & Handler, 1992, "Executive Summary of the Antitrust Laws."Kaye, Scholer's Antitrust Deskbook, NY, pp. 319.2. Kaye, Scholer, Fierman, Hays & Handler, 1992, "Introduction to EC Competition Law,''Kaye, Scholer's Antitrust Deskbook, NY, pp. 237-242.XV. Antitrust: Horizontal MergersA. Policy Issues1. Materials on Time-Warner/Turner Merger (mimeo).Available from Graphic Arts as Part A of the 14.272 Readings Packet.B. Theory and Evidence1. J. Farrell & C. Shapiro, "Horizontal Mergers: An Equilibrium Analysis,"American Economic Review, 80 (March 1990), 107-126.2. Robert D. Willig, "Merger Analysis, Industrial Organization Theory, and Merger Guidelines,"Brookings Papers on Economic Activity: Microeconomics, 1991, pp. 281-332.3. B.E. Eckbo, "Mergers and Market Concentration Doctrine Evidence from the Capital Market,"Journal of Business,58 (July 1985), 325-349.4. R. McAfee & M. Williams, "Can Event Studies Detect Anticompetitive Merger?"Economic Letters, (1988), 199-203.5. R.A. Prager, "The Effects of Horizontal Mergers on Competition: The Case of the Northern Securities Company,"Rand Journal of Economics, 23 (Spring 1992), 123-133.6. G.L. Mullin, J.C. Mullin, and W.P. Mullin, "The Competitive Effects of Mergers: Stock Market Evidence from the U.S. Steel Dissolution Suit,"Rand Journal of Economics, 26 (Summer 1995), 314-330.7. S. Bhagat, A. Shleifer, & R.W. Wishny, "Hostile Takeovers in the 1980s: The Return to Corporate Specialization,"Brookings Papers on Economic Activity. Microeconomics, 1990. 1-84.8. M. Pesendorfer, "Horizontal Mergers in the Paper industry,''NBER Working Paper6751. October 1988C. Horizontal Merger Policy1. US Department of Justice,Horizontal Merger Guidelines(revised April 1992).2. J. Hausman and G. Leonard, "Economic Analysis of Differentiated Product Mergers Using Real World Data," mimeo, October 25, 1996.3. David Scheffman and Pablo Spiller, "Econometric Market Delineation,''Managerial and Decision Economics, Vol. 17, 165-178 (1996)4. G.J. Werden and L.M. Froeb, "The Effects of Mergers in Differentiated Products Industries: Logit Demand and Merger Policy,''Journal of Law, Economics, and Organization,10 (October 1994), 407-26.5. S.C. Salop, L.J. White, F. M. Fisher, & R. Schmalensee, "Symposium: Horizontal Mergers and Antitrust,"Journal of Economic Perspectives, 1 (Fail 1987), 3-54.6. S. Dalkir & F.R. Warren-Boulton, "Prices, Market Definition, and the Effects of Merger: Staples-Office Depot (1997),'' in J.E. Kwoka, Jr. and L.J. White, eds.,The Antitrust Revolution: Economics, Competition, and Policy,3rded. Oxford: Oxford University Press (1999), pp. 143-165. XVI. Antitrust: Vertical Relations & Vertical Restraints1. Tirole, Chapter 4 (including supplementary section).2. J.A. Ordover, G. Saloner, & S.C. Salop, "Equilibrium Vertical Foreclosure,"American Economic Review,80 (March 1990), 127-142.3. Benjamin Klein, "Market Power in Aftermarkets,"Managerial and Decision Economics, Vol. 17, 143-164 (1996).4. Carl Shapiro, "Aftermarkets and Consumer Welfare: Making Sense of Kodak,''Antitrust Law Journal, Vol. 63 at 483 (1995).5. O. Hart and J. Tirole, "Vertical Integration and Market Foreclosure,"Brookings Papers on Economic Activity: Microeconomics, 1990, 205-286.6. P. Rey and J. Stiglitz, " The Role of Exclusive Territories in Producers' Competition,"Rand Journal of Economics, 26 (Autumn 1995), 431-451.7. M. B. Lieberman, "Determinants of Vertical Integration: An Empirical Test,"Journal of Industrial Economics,39(September 1991), 451-466.8. S.J. Ornstein & D.M. Hanssens, "Resale Price Maintenance: Output Increasing or Restructuring? The Case of Distilled Spirits in the United States,"Journal of Industrial Economics, 36 (September 1987), 1-18.9. F. Lafontaine, "Agency Theory and Franchising: Some Empirical Results,''Rand Journal of Economics,23 (Summer 1992) 263-283.XVII. The Political Economy of Regulation1. R. G. Noll, ''Economic Perspectives on the Politics of Regulation,'' in R. Schmalensee & R. D. Willig (eds.),Handbook of Industrial Organization,Volume 2, Amsterdam North- Holland, 1989, Ch. 22, 1253-1287.2. Armstrong et al, Chapter 1.3. G.J. Stigler, "The Theory of Economic regulation,''Bell Journal of Economics, 2 (Spring 1971), 3-21.4. S. Peltzman, ''The Economic Theory of regulation after a Decade of Deregulation,"Brookings Papers on Economic Activity: Microeconomics, 1989, 1-60.5. R.A. Posner, ''Taxation by Regulation,''BellJournal of Economics, 2 (Spring 1971 ), 22-50.6. R.A. Posner, ''Theories of Economic Regulation,"BellJournal of Economics,5 (Autumn 1974), 335-358.7. J.Q. Wilson, "The Politics of Regulation," in J.Q. Wilson (Ed.),The Politics of Regulation,Cambridge: Harvard University Press, 1980.8. J.P. Kalt & M. A. Zupan, "Capture and Ideology in the Economic Theory of Politics,"American Economic Review, 74 (June 1984), 279-300.9. R. Prager, "Using Stock Price Data to Measure the Effects of Regulation The Interstate Commerce Act and the Railroad industry,''Rand Journal of Economics, 20 (Summer 1989), 280-290.10. T. Romer de H. Rosenthal, "Modern Political Economy and the Study of Regulation," in E. E. Bailey (ed.),Public Regulation: Perspectives on Institutions and Policies, Cambridge: MIT Press, 1987, 73-116.。
7菲利普斯曲线
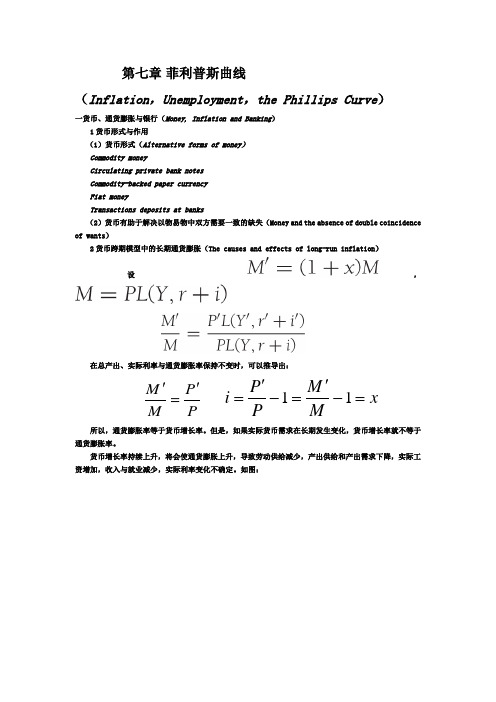
第七章 菲利普斯曲线(Inflation ,Unemployment ,the Phillips Curve )一货币、通货膨胀与银行(Money, Inflation and Banking )1货币形式与作用(1)货币形式(Alternative forms of money )Commodity moneyCirculating private bank notes Commodity-backed paper currency Fiat moneyTransactions deposits at banks(2)货币有助于解决以物易物中双方需要一致的缺失(Money and the absence of double coincidence of wants )2货币跨期模型中的长期通货膨胀(The causes and effects of long-run inflation )设,在总产出、实际利率与通货膨胀率保持不变时,可以推导出:P P M M '=' x M M P P i =-'=-'=11所以,通货膨胀率等于货币增长率。
但是,如果实际货币需求在长期发生变化,货币增长率就不等于通货膨胀率。
货币增长率持续上升,将会使通货膨胀上升,导致劳动供给减少,产出供给和产出需求下降,实际工资增加,收入与就业减少,实际利率变化不确定。
如图:(Show that money is not superneutral – higher money growth causes higher inflation, which affects real economic variables;An increase in the money growth rate increases the inflation rate and the nominal interest rate, and reduces employment and output)所以弗里德曼主张最优货币政策是使利率为0的通货紧缩货币政策。
- 1、下载文档前请自行甄别文档内容的完整性,平台不提供额外的编辑、内容补充、找答案等附加服务。
- 2、"仅部分预览"的文档,不可在线预览部分如存在完整性等问题,可反馈申请退款(可完整预览的文档不适用该条件!)。
- 3、如文档侵犯您的权益,请联系客服反馈,我们会尽快为您处理(人工客服工作时间:9:00-18:30)。
Channels to growth
Capital accumulation-technological accumulation
Growth
FINANCE AND DEVELOPMENT
WHAT IS FINANCIAL SECTOR DEVELOPMENT?
• Financial development involves improvements in 1. producing information about possible investments and allocating capital, 2. monitoring firms and exerting corporate governance, 3. trading, diversification, and management of risk, 4. mobilization and pooling of savings, 5. easing the exchange of goods and services.
FINANCE AND DEVELOPMENT
• Asset transformation Financial intermediaries simultaneously satisfy both borrowers’ needs for permanent or longterm capital and the desires of many lenders for a high degree of liquidity in their asset holdings (assets may be turned into cash at short notice).
Market frictions
Information costs-transaction costs
Financial markets/intermediaries
Financial functions
Mobilise savings-allocate resources-exert corporate controlfacilitate risk management-ease trading of goods and service
FINANCE AND DEVELOPMENT
• Asymmetric information
NEOLIBERAL ASSUMPTION = Existence of perfect information
all available information is freely available to all agents in the market. But there is asymmetric information between providers of capital and those seeking capital.
Financial Sector Development and Growth
INTRODUCTION
• There is a believe that financial sector development leads to economic growth • Because a well functioning financial market allow savings mobilisation, thus potential for productive investment, which will lead to growth
FINANCE AND DEVELOPMENT
• Transaction costs
– There are four main types of transaction costs:
1. Search costs: costs of searching out, and finding information about, a
FINANCE AND DEVELOPMENT
• In short financial institutions – Help transform assets in order to satisfy simultaneously the different requirements of lenders and borrowers – reduce transaction costs by taking advantage of economies of scale, economies of scope and expertise – satisfy the liquidity needs of individual investors – reduce problems arising out of asymmetric information. On the one hand, financial intermediaries reduce adverse selection thanks to their expertise in information production and their ability to avoid the free-rider problem. On the other hand, they reduce moral hazard because they gain the full benefits of their monitoring and enforcement, and have an incentive to devote sufficient resources to these activities.
These financial functions influence savings and investment decisions, and technological innovations and hence economic growth.
FINANCE AND DEVELOPance growth nexus supported by empirical evidence?
Objective of this lecture
• Explain the role played by financial institutions within the wider economy • Define what is meant by the term financial sector development • Summarise the main theoretical views on the link between finance and growth • Provide an overview of the empirical literature
FINANCE AND DEVELOPMENT
FINANCE AND GROWTH: AN OVERVIEW OF THE THEORETICAL LITERATURE • Theoretical link FSD and growth could be traced back to:
suitable counterpart (incurred both by lenders and borrowers).
2. Verification costs: lenders incur costs to verify the accuracy of the information provided by borrowers. 3. Monitoring and auditing costs: once a loan is made, lenders incur costs to monitor the activities of borrowers, and their adherence to the conditions of the contract. 4. Enforcement costs: in case the borrower is unable to meet the conditions of the contract, the lender will need to ensure their enforcement.
• differences in the preferences of lenders and borrowers • presence of transaction costs • asymmetric information (which gives rise to both adverse selection and moral hazard)
Ex-ante: Adverse selection Ex-post: Moral Hazard
FINANCE AND DEVELOPMENT
• Adverse selection is the problem created by asymmetric information before the transaction occurs. It arises when the potential borrowers who are most likely to produce an undesirable (adverse) outcome are the ones who most actively seek out loans. Thus adverse selection increases the probability that bad credit risks will get loans. As a consequence, lenders may decide not to give any loans, even to good credit risks. • Moral hazard is the problem that occurs after the transaction is made. It is the risk (hazard) that the borrower will engage in activities that are undesirable (immoral) for the lender. These activities potentially reduce the probability that the loan will be repaid. Again, the consequence is that lenders may decide not to make any loans. Investors are more likely to behave differently when using borrowed funds rather than when using their own funds.