图表类作文
四级英语图表作文
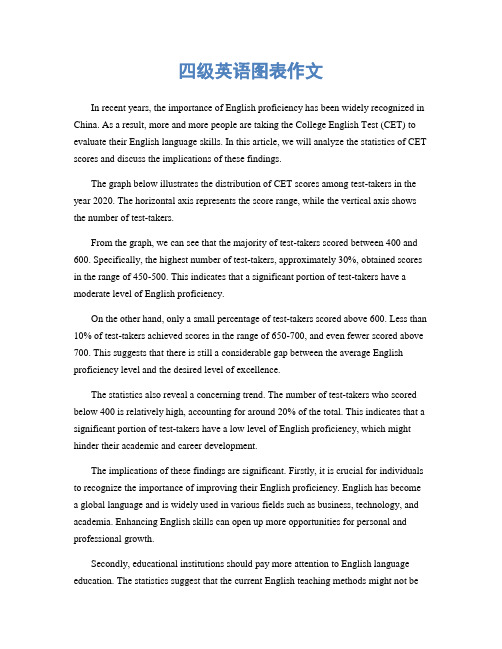
四级英语图表作文In recent years, the importance of English proficiency has been widely recognized in China. As a result, more and more people are taking the College English Test (CET) to evaluate their English language skills. In this article, we will analyze the statistics of CET scores and discuss the implications of these findings.The graph below illustrates the distribution of CET scores among test-takers in the year 2020. The horizontal axis represents the score range, while the vertical axis shows the number of test-takers.From the graph, we can see that the majority of test-takers scored between 400 and 600. Specifically, the highest number of test-takers, approximately 30%, obtained scores in the range of 450-500. This indicates that a significant portion of test-takers have a moderate level of English proficiency.On the other hand, only a small percentage of test-takers scored above 600. Less than 10% of test-takers achieved scores in the range of 650-700, and even fewer scored above 700. This suggests that there is still a considerable gap between the average English proficiency level and the desired level of excellence.The statistics also reveal a concerning trend. The number of test-takers who scored below 400 is relatively high, accounting for around 20% of the total. This indicates that a significant portion of test-takers have a low level of English proficiency, which might hinder their academic and career development.The implications of these findings are significant. Firstly, it is crucial for individuals to recognize the importance of improving their English proficiency. English has become a global language and is widely used in various fields such as business, technology, and academia. Enhancing English skills can open up more opportunities for personal and professional growth.Secondly, educational institutions should pay more attention to English language education. The statistics suggest that the current English teaching methods might not beeffective enough in improving students' language skills. Therefore, it is necessary to explore innovative teaching approaches, such as interactive language learning platforms and immersive language programs, to help students achieve better results in the CET.Furthermore, the government should invest more resources in promoting English education. English proficiency is closely related to a country's competitiveness in the global economy. By providing more funding and support to English language programs, the government can contribute to the overall improvement of English proficiency in the country.In conclusion, the statistics of CET scores in 2020 indicate that while a significant portion of test-takers have a moderate level of English proficiency, there is still room for improvement. It is crucial for individuals, educational institutions, and the government to work together in promoting English language education and enhancing English proficiency. Only by doing so can we meet the challenges of globalization and seize the opportunities it brings.。
雅思作文图表题范文(热门3篇)

雅思作文图表题范文第1篇It is said that countries are becoming similar to each other because of the global spread of the same products, which are now available for purchase almost anywhere. I strongly believe that this modern development is largely detrimental to culture and traditions worldwide.A country’s history, language and ethos are all inextricably bound up in its manufactured artefacts. If the relentless advance of international brands into every corner of the world continues, these bland packages might one day completely oust the traditional objects of a nation, which would be a loss of richness and diversity in the world, as well as the sad disappearance of the manifestations of a place’s character. What would a Japanese tea ceremony be without its specially crafted teapot, or a Fijian kava ritual without its bowl made from a certain type of tree bark?Let us not forget either that traditional products, whether these be medicines, cosmetics, toy, clothes, utensils or food, provide employment for local people. The spread of multinational products can often bring in its wake a loss of jobs, as people urn to buying the new brand, perhaps thinking it more glamorous than the one they are used to. This eventually puts old-school craftspeople out of work.Finally, tourism numbers may also be affected, as travelers become disillusioned with finding every place just the same as the one they visited previously. To see the same products in shops the world over is boring, and does not impel visitors to open their wallets in the same way that trinkets or souvenirs unique to the particular area too.Some may argue that all people are entitled to have access to the same products, but I say that local objects suit local conditions best, and that faceless uniformity worldwide is an unwelcome and dreary prospect.Heres my full answer:The line graphs show the average monthly amount that parents in Britain spent on their children’s sporting activities and the number of British children who took part in three different sports from 2008 to is clear that parents spent more money each year on their children’s participation in sports over the six-year period. In terms of the number of children taking part, football was significantly more popular than athletics and 2008, British parents spent an average of around £20 per month on their children’s sporting activities. Parents’ spending on children’s sports increased gradually over the following six years, and by 2014 the average monthly amount had risen to just over £ at participation numbers, in 2008 approximately 8 million British children played football, while only 2 million children were enrolled in swimming clubs and less than 1 million practised athletics. The figures for football participation remained relatively stable over the following 6 years. By contrast, participation in swimming almost doubled, to nearly 4 million children, and there was a near fivefold increase in the number of children doing athletics.剑桥雅思6test1大作文范文,剑桥雅思6test1大作文task2高分范文+真题答案实感。
英语图表作文范文条形图
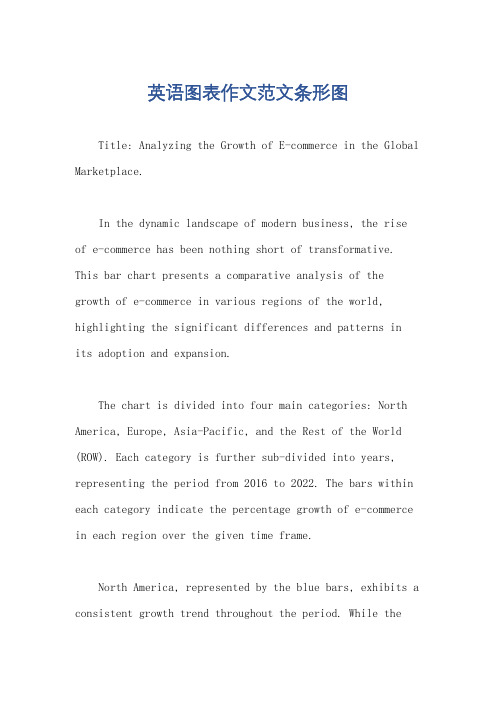
英语图表作文范文条形图Title: Analyzing the Growth of E-commerce in the Global Marketplace.In the dynamic landscape of modern business, the rise of e-commerce has been nothing short of transformative. This bar chart presents a comparative analysis of the growth of e-commerce in various regions of the world, highlighting the significant differences and patterns inits adoption and expansion.The chart is divided into four main categories: North America, Europe, Asia-Pacific, and the Rest of the World (ROW). Each category is further sub-divided into years, representing the period from 2016 to 2022. The bars within each category indicate the percentage growth of e-commerce in each region over the given time frame.North America, represented by the blue bars, exhibits a consistent growth trend throughout the period. While theinitial growth rate was relatively modest, it picked up significantly in recent years, indicating a maturing market and increasing consumer confidence in online shopping. This growth can be attributed to factors such as widespread internet access, a technologically savvy population, and a robust infrastructure supporting e-commerce transactions.Europe, depicted by the green bars, follows a similar trend to North America, albeit with a slightly slower growth rate. This can be explained by factors such as the diversity of languages and currencies within the European Union, which can make cross-border transactions more complex. However, despite these challenges, the European e-commerce market has shown resilience and continues to expand.The Asia-Pacific region, shown by the orange bars, experiences the most significant growth in e-commerce adoption. This rapid expansion can be attributed to several factors, including the region's rapidly growing middle class, widespread access to mobile technology, and a younger, more tech-savvy demographic. Furthermore,governments in many Asian countries have been proactive in promoting e-commerce development through policies and infrastructure investments, further accelerating its growth.The Rest of the World (ROW), represented by the purple bars, displays a mixed pattern of growth. While someregions within this category have seen modest increases ine-commerce activity, others have lagged behind. This heterogeneity can be attributed to a range of factors, including economic development, infrastructure, andcultural preferences for traditional shopping methods. However, even within this diverse group, there are pocketsof rapid growth, indicating that the potential for e-commerce expansion remains untapped in many parts of the world.Comparing the four regions, it is evident that theAsia-Pacific region has emerged as the fastest-growing market for e-commerce. This trend is likely to continue in the coming years, driven by factors such as increasing internet penetration, mobile phone ownership, and a young, tech-savvy population. North America and Europe, althoughmature markets, continue to experience steady growth, indicating that there is still room for expansion in these regions. The Rest of the World, while diverse and challenging, offers巨大的潜力 for e-commerce companies looking to expand their global footprint.In conclusion, the bar chart presents a compelling picture of the growth of e-commerce in different regions of the world. From North America's consistent growth to the Asia-Pacific region's rapid expansion, the chart highlights the dynamism and diversity of the global e-commerce landscape. As companies and policymakers continue to navigate this evolving market, it is crucial to stay attuned to these trends and leverage them to drive sustainable growth and innovation.。
英语图表作文精选10篇

英语图表作文精选10篇四级英语作文图表类篇一图片模板:It seems to me that the cartoon / drawing issending a message about ____________(图画内容),which reveals ____________(稍作评价).In myperspective of view, ____________ (表明个人观点)。
Apparently, ____________(将个人观点和图片内容相结合,得出观点。
)For one thing, ____________(从社会角度论证).For another thing, ____________(从个人角度说明).For example, ____________(自己、朋友或他人,只要自己知道或听过的例子).Last but not least, ____________(从反面角度谈论).Asa result, the drawer of the illustration is urging us to _____________(建议或措施).Only inthis way can we ____________(展望结果).In conclusion / To my understanding, ____________(再次表明观点或态度).We should____________(进一步说明个人的观点).图表模板:According to the bar chart / pie chart / line graph displays the changes in the numberof____________(图表整体趋势).There was an increase in ____________(图表细节).At the point of ____________, ____________reaches its peak value of ____________(数据或变化).What has caused these changes? There are mainly three reasons.Firstly, ____________ (原因一).Secondly, ____________(原因二).The number of ____________ increased overthe period.____________ rose by _________ from ________ to ________________.Andthere were____________.Finally, ____________(最后一个原因).In conclusion / We can safely draw the conclusion that ____________(结论).Therefore, ____________(进一步谈论更多个人想法).英语四级图表类作文篇二In the morning, the clear sky, father-in-law of the sun was inlaid with a golden halo. A group of happy little magpies chirped in the branches, as if holding a singing contest, very lively!Noon is the hottest time of the day. The sun gave out a blazing light, as if to roast the earth. There was no one in the street. Everyone hid in the house to blow the air conditioner, for fear that they would be cooked outside. At this time, the little magpie on the tree also became quiet, they all hide in the deep leaves of the nap. Only the indefatigable cicada was still shouting “hot, hot.。
英语图表作文模板及精选4篇

英语图表作文模板及精选4篇(经典版)编制人:__________________审核人:__________________审批人:__________________编制单位:__________________编制时间:____年____月____日序言下载提示:该文档是本店铺精心编制而成的,希望大家下载后,能够帮助大家解决实际问题。
文档下载后可定制修改,请根据实际需要进行调整和使用,谢谢!并且,本店铺为大家提供各种类型的经典范文,如总结报告、合同协议、规章制度、条据文书、策划方案、心得体会、演讲致辞、教学资料、作文大全、其他范文等等,想了解不同范文格式和写法,敬请关注!Download tips: This document is carefully compiled by this editor. I hope that after you download it, it can help you solve practical problems. The document can be customized and modified after downloading, please adjust and use it according to actual needs, thank you!Moreover, our store provides various types of classic sample essays, such as summary reports, contract agreements, rules and regulations, doctrinal documents, planning plans, insights, speeches, teaching materials, complete essays, and other sample essays. If you want to learn about different sample formats and writing methods, please pay attention!英语图表作文模板及精选4篇学而不思则罔,思而不学则殆,以下是本店铺给大伙儿收集整理的英语图表作文模板及精选4篇,欢迎参考。
大英赛图表类的作文
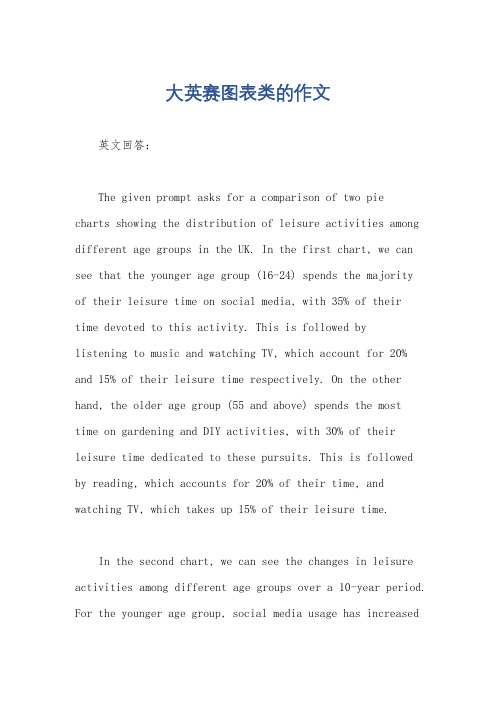
大英赛图表类的作文英文回答:The given prompt asks for a comparison of two piecharts showing the distribution of leisure activities among different age groups in the UK. In the first chart, we can see that the younger age group (16-24) spends the majorityof their leisure time on social media, with 35% of their time devoted to this activity. This is followed bylistening to music and watching TV, which account for 20% and 15% of their leisure time respectively. On the other hand, the older age group (55 and above) spends the most time on gardening and DIY activities, with 30% of their leisure time dedicated to these pursuits. This is followed by reading, which accounts for 20% of their time, and watching TV, which takes up 15% of their leisure time.In the second chart, we can see the changes in leisure activities among different age groups over a 10-year period. For the younger age group, social media usage has increasedsignificantly from 30% to 35%, while listening to music has remained relatively stable at 20%. However, there has beena decrease in the time spent watching TV, from 20% to 15%. On the other hand, for the older age group, gardening and DIY activities have seen a slight decrease from 35% to 30%, while reading has remained stable at 20%. There has also been a decrease in the time spent watching TV, from 20% to 15%.中文回答:给定的提示要求比较两个饼图,显示英国不同年龄组之间的休闲活动分布。
英语作文描述图表

英语作文描述图表The bar chart shows the percentage of people in different age groups who use social media. As we can see, the highest percentage of social media users is in the 18-24 age group, at around 90%. The percentage then gradually decreases as the age group increases, with the lowest percentage being in the 65+ age group, at around 20%.Looking at the pie chart, we can see the distribution of social media platforms used by the surveyed individuals. It is clear that the most popular platform is Instagram, accounting for 40% of the total usage. This is followed by Facebook at 30%, Twitter at 20%, and LinkedIn at 10%.The line graph illustrates the amount of time spent on social media by people in different age groups. Surprisingly, the 25-34 age group spends the most time on social media, with an average of 3 hours per day. This is followed by the 18-24 age group at 2.5 hours per day, and the 35-44 age group at 2 hours per day. The 45-54, 55-64,and 65+ age groups all spend less than 1.5 hours per day on social media.In conclusion, the data clearly shows that social media usage is most prevalent among younger age groups, with Instagram being the most popular platform. Additionally, the amount of time spent on social media tends to decrease as age increases.。
英语图表作文模板及范文(通用12篇)

英语图表作文模板及范文(通用12篇)(经典版)编制人:__________________审核人:__________________审批人:__________________编制单位:__________________编制时间:____年____月____日序言下载提示:该文档是本店铺精心编制而成的,希望大家下载后,能够帮助大家解决实际问题。
文档下载后可定制修改,请根据实际需要进行调整和使用,谢谢!并且,本店铺为大家提供各种类型的经典范文,如工作总结、工作计划、合同协议、条据文书、策划方案、句子大全、作文大全、诗词歌赋、教案资料、其他范文等等,想了解不同范文格式和写法,敬请关注!Download tips: This document is carefully compiled by this editor. I hope that after you download it, it can help you solve practical problems. The document can be customized and modified after downloading, please adjust and use it according to actual needs, thank you!Moreover, our store provides various types of classic sample essays for everyone, such as work summaries, work plans, contract agreements, doctrinal documents, planning plans, complete sentences, complete compositions, poems, songs, teaching materials, and other sample essays. If you want to learn about different sample formats and writing methods, please stay tuned!英语图表作文模板及范文(通用12篇)英语图表作文模板及范文第1篇The table/chart diagram/graph shows (that)According to the table/chart diagram/graphAs (is)shown in the table/chart diagram/graphAs can be seen from the table/chart/diagram/graph/figures,figures/statistics shows (that)……It can be seen from the figures/statisticsWe can see from the figures/statisticsIt is clear from the figures/statisticsIt is apparent from the figures/statisticstable/chart/diagram/graph figures (that)……table/chart/diagram/graph shows/describes/illustrates图表类英语作文范文The past years have witnessed a mounting number of Chinese scholars returning from overseas.As is lively illustrated by the column chart, the number of returnees climbed from a mere thousand in 20XX to over thousand in 20XX, at an annual increase rate of around 50%.A multitude of factors may have led to the tendency revealed by the chart, but the following are the critical ones from my perspective.First and foremost, along with the development ofChinese economy and society, the number of Chinese studying abroad has been soaring in the past years, which has provided an eXpanding base for the number of returnees.In the second place, the government has enacted a series of preferential policies to attract overseas Chinese scholars back st but not least, the booming economy, science and technology in this country have generated more attative job opportunites for scholars returning from overseas.The waves of returnees will definitely contribute to this nation’s development, since they have brought back not only advanced science and technology but also pioneering concepts of education and management.With more scholars coming back from overseas, and with the concerted efforts of the whole nation,we have reasons to eXpect a faster rejuvenation of this country.更多培训课程:苏州个人提升英语更多学校信息:苏州虎丘区朗阁教育机构咨询电话:英语图表作文模板及范文第2篇Students tend to use computers more and more frequently nowadays.Reading this chart, we can find that the average number of hours a student spends on the computer per week has increased sharply.In 1990, it was less than 2 hours; and in 1995, it increased to almost 4 hours, and in 2000, the numbersoared to 20 hours.Obviously computers are becoming increasingly popular.There are several reasons for this change.First,computers facilitate us in more aspects of life.Also, the fast development of the Internet enlarges our demands for using computers.We can easily contact with friends in remote places through the Internet.Besides, the prices of computers are getting lower and lower,which enables more students to purchase them.However, there still eXist some problems, such as poor quality, out-of-date designs and so on.And how to balance the time between using computers and studying is also a serious problem.Anyhow, we will benefit a lot from computers as long as we use them properly.英语图表作文模板及范文第3篇As can be clearly seen from the graph/table/chart (As is shown in the table/figure), great changed have taken place in_______,The_________have/has skyrocketed/jumped from _____to _____.When it comes to the reasons for the changes,different people give different eXplanations.Here I shall just give a begin with, ______What’s more,___________, Last but not least, ________.While it is desirable that ___________,there are still some problems and difficulties for __________Firstly, __________,In addition, __________,In a word, __________.以上就是为大家整理的英语专四图表作文范文模板,希望能够对大家有所帮助。
- 1、下载文档前请自行甄别文档内容的完整性,平台不提供额外的编辑、内容补充、找答案等附加服务。
- 2、"仅部分预览"的文档,不可在线预览部分如存在完整性等问题,可反馈申请退款(可完整预览的文档不适用该条件!)。
- 3、如文档侵犯您的权益,请联系客服反馈,我们会尽快为您处理(人工客服工作时间:9:00-18:30)。
3. 直接导致和诱发犯罪
1. 远离毒 2. 品的建 3. 议(自 拟)
青少年吸毒原因分析饼状图
As is shown on the chart above, 30% of the teenagers taking drugs are cheated into doing it, and 50% are driven by curiosity. Another 15% just seek excitements or try to get rid of their anxieties. The rest try it for some other reasons.
2008江苏宿迁
• 假设下面是你们学校对学生课外阅读情况所作的调 查。请根据下面的图表为某报社写一篇有关这次调 查的报道,并适当发表你自己的看法。 图 学生阅读各类书籍的比例
文学10% 课本45% 其它15%
卡通画册30%
Warming up
图表式作文的几种形式:
一是以表格形式,将统计的数据或被说明的事 物直接用表格形式体现出来,即统计表。 二是以图形形式 A 表示数据变化的曲线图; B 表示数据的大小或数量之间的差异 的柱状图; C 表示总体内部结构变化的扇形图。
你校将开展禁毒宣传,请你根据下面的表格和饼状图写一篇短文。短文内容 需包括青少年吸毒原因分析,介绍毒品危害并给同学们提出建议,以便让同 学们懂得如何 远离毒品。
1. 毒品交易日益泛滥, 每年浪费8000亿美元
毒品的 危害
2. 严重危害健康,加速死亡
其他5% 追求刺激、 消除烦恼 15%
好奇心50% 上当受骗30%
高考英语书面表达写作指导 之
图表式作文 (议论类)
目前,家长开车接送孩子上下学已成为一个普遍现象,人们 对此做法褒贬不一。下面是就此现象所做的问卷调查结果。 请根据下列图表提示,描述被访者的看法,并就此现象发表 自己的观点。 注意:1.词数150左右,文章的开头已经给出,不计入词数。 3.可以适当增加细节,以使行文连贯。
读图 (2004上海春)
某城市近年每百人中手机用户增长示意图。根据所给 图表,简要描述某城市近年每百人中手机用户增长情 况,并试分析其增长原因。 (%)
80 70 60 50 40 30 20 10 0
1. 1997年10%的人 有手机 2.1999年20%的人有手机 3.2001年50%的人有手机 4.2004年80%的人有手机
1997年
1999年
2001年
2004年
The chart above shows the increasing number of mobile phones. According to the first column, only 10 percent of the population owned mobile phones in 1997. As time went on, in 1999 the number doubled , reaching 20 in 100. In 2001,the people owning mobile phones were 5 times as many as those in 1997. Three years later, 80 percent of the citizens had the magic tools.
93
25
12
30
34
46
做家务 体育 用电脑 听音乐 看电视 做作业 锻炼
Let’s practise!
• The chart shows the daily average amount of time the students of the school spend on different after-class activities. The students put the most time-93 minutes-into their homework, and next in line is watching TV, which takes up 46 minutes. They put in about the same amount of time listening to music and working on the computer, 34 minutes and 30 minutes each. While 25 minutes is spent on sports, only 12 minutes goes into housework.
Let’s practise!
你校将开展禁毒宣传,请你根据下面的表格和饼状图写一篇短 文。短文内 容需包括青少年吸毒原因分析,介绍毒品危害并给同学们提出建议,以便让 同学们懂得如何 远离毒品。
1. 毒品交易日益泛滥, 每年浪费8000亿美元
毒品的 危害
2. 严重危害健康,加速死亡
其他5% 追求刺激、 消除烦恼 15%
People take different views on this question.
Table
表格
Bar Chart / Graph
柱状图
Group work (1):
1.share your essay with your group members
2. raise the difficulties you had when writing it
Difficulties?
• • • 读图 解意 谋篇
Topic sentence:
Different people hold different opinions.
Opinions are divided.
People have taken/adopted different attitudes towards … People have different opinions on this problem.
读图
数据 百分比 / 数量,
拒绝 most , the majority ,some, a few
文字 写作要求
读图 (2004北京)
• 某学校对中学生课余活动进行了调查,结果如下。请根据 图表1提供的信息描述学生每天的课余活动。
(分钟)
100 90 80 70 60 50 40 30 20 10 0
读图
目前,家长开车接送孩子上下学已成为一个普遍现 象,人们对此做法褒贬不一。下面是就此现象所做的问卷调 查结果。请根据下列图表提示,描述被访者的看法,并就此 现象发表自己的观点。 注意:1.词数150左右,文章的开头已经给出,不计入词数。 3.可以适当增加细节,以使行文连贯。
We can see that half of the supporters believe that more valuable time can be saved for students to get enough sleep. Another 30% think children can rest or have meals comfortably in their own cars. About 15% consider it reasonable just for the sake of children’s safety. The rest of them think it offers more chances for parents to communicate with their children.
2004上海春
某城市近年每百人中手机用户增长示意图。根据所给 图表,简要描述某城市近年每百人中手机用户增长情 ( 上海春季)某城市近年每百人中手机用户增长示意图。根据所给图 况,并试分析其增长原因。
80 70 60 50 40 30 20 10 0 1997年 1999年 2001年 2004年
表,简要描述某城市近年每百人中手机用户增长情况,并试分析其增长 原因
Part 1 Describe the graph
开门见山地点明本图表所反映的主题即 topic sentence / conclusion,并分析数据间的主要 差异及趋势 常用句型:
• 1.The graph/chart/table above shows … • 2. From the above graph/chart, it can be seen that... • 3. As is shown in the graph, ... • 4.The chart/table shows the differences between…
Line Graph
曲线图
Pie Chart
饼状图
1994
1995 60%
1996 48%
1997 42%
1998 35%
Item
Food 65%
Clothing
8%
9%
5% 26% 100%
12%
7% 33% 100%
15%
8% 35% 100%
17%
10% 38% 100%
Recreation 3% Others Total 24% 100%
Let’s practise!
目前,家长开车接送孩子上下学已成为一个普遍现象,人们对此 做法褒贬不一。下面是就此现象所做的问卷调查结果。请根据下 列图表提示,描述被访者的看法,并就此现象发表自己的观点。 注意:1.词数150左右,文章的开头已经给出,不计入词数。 3.可以适当增加细节,以使行文连贯。
好奇心50% 上当受骗30%
3. 直接导致和诱发犯罪
1. 远离毒 2. 品的建 3. 议(自 拟)
青少年吸毒原因分析饼状图
解意 Reasons : convincing
Solutions: effective Opinion : clear