太阳光发电系统翻译最终版本
太阳能英中词汇翻译
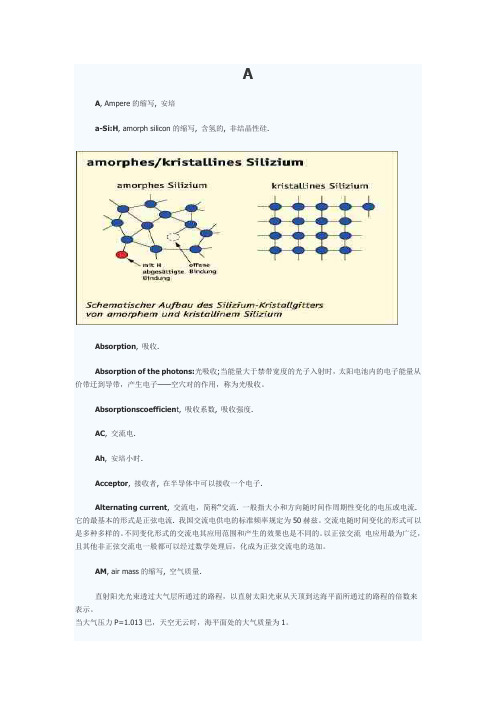
AA, Ampere的缩写, 安培a-Si:H, amorph silicon的缩写, 含氢的, 非结晶性硅.Absorption, 吸收.Absorption of the photons:光吸收;当能量大于禁带宽度的光子入射时,太阳电池内的电子能量从价带迁到导带,产生电子——空穴对的作用,称为光吸收。
Absorptionscoefficien t, 吸收系数, 吸收强度.AC, 交流电.Ah, 安培小时.Acceptor, 接收者, 在半导体中可以接收一个电子.Alternating current, 交流电,简称“交流. 一般指大小和方向随时间作周期性变化的电压或电流. 它的最基本的形式是正弦电流. 我国交流电供电的标准频率规定为50赫兹。
交流电随时间变化的形式可以是多种多样的。
不同变化形式的交流电其应用范围和产生的效果也是不同的。
以正弦交流电应用最为广泛,且其他非正弦交流电一般都可以经过数学处理后,化成为正弦交流电的迭加。
AM, air mass的缩写, 空气质量.直射阳光光束透过大气层所通过的路程,以直射太阳光束从天顶到达海平面所通过的路程的倍数来表示。
当大气压力P=1.013巴,天空无云时,海平面处的大气质量为1。
amorphous silicon solar cell:非晶硅太阳电池(a—si太阳电池)用非晶硅材料及其合金制造的太阳电池称为非晶硅太阳电池,亦称无定形硅太阳电池,简称a—si太阳电池。
Angle of inclination, 倾斜角,即电池板和水平方向的夹角,0-90度之间。
Anode, 阳极, 正极.BBack Surface Field, 缩写BSF, 在晶体太阳能电池板背部附加的电子层, 来提高电流值.Bandbreak, 在半导体中, 价带和导带之间的空隙,对于半导体的吸收特性有重要意义.Becquerel, Alexandre-Edmond, 法国物理学家, 在1839年发现了电池板效应.BSF, back surface field的缩写.Bypas-Diode, 与太阳能电池并联的二极管, 当一个太阳能电池被挡住, 其他太阳能电池产生的电流可以从它处通过.CCadmium-Tellurid, 缩写CdTe; 位于II/VI位的半导体, 带空隙值为1,45eV, 有很好的吸收性, 应用于超薄太阳能电池板, 或者是连接半导体.Cathode, 阴极,或负极,是在电池板电解液里的带负电的电极,是电池板电解液里带电粒子和导线里导电电子的过渡点。
太阳能发电英文
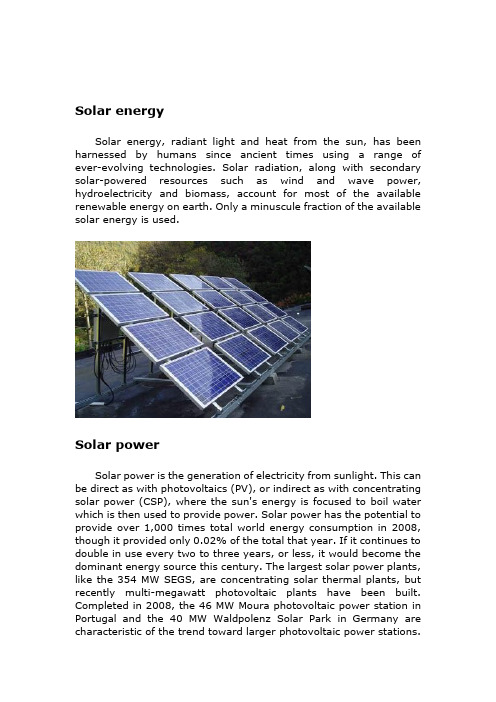
Solar energySolar energy, radiant light and heat from the sun, has been harnessed by humans since ancient times using a range of ever-evolving technologies. Solar radiation, along with secondary solar-powered resources such as wind and wave power, hydroelectricity and biomass, account for most of the available renewable energy on earth. Only a minuscule fraction of the available solar energy is used.Solar powerSolar power is the generation of electricity from sunlight. This can be direct as with photovoltaics (PV), or indirect as with concentrating solar power (CSP), where the sun's energy is focused to boil water which is then used to provide power. Solar power has the potential to provide over 1,000 times total world energy consumption in 2008, though it provided only 0.02% of the total that year. If it continues to double in use every two to three years, or less, it would become the dominant energy source this century. The largest solar power plants, like the 354 MW SEGS, are concentrating solar thermal plants, but recently multi-megawatt photovoltaic plants have been built. Completed in 2008, the 46 MW Moura photovoltaic power station in Portugal and the 40 MW Waldpolenz Solar Park in Germany are characteristic of the trend toward larger photovoltaic power stations.Much larger ones are proposed, such as the 100 MW Fort Peck Solar Farm, the 550 MW Topaz Solar Farm, and the 600 MW Rancho Cielo Solar Farm.Solar power is amazing. On average, every square meter of Earth's surface receives 164 watts of solar energy. In other words, you could stand a really powerful (150 watt) table lamp on every square meter of Earth's surface and light up the whole planet with the Sun's energy! Or, to put it another way, if we covered just one percent of the Sahara desert with solar panels, we could generate enough electricity to power the whole world. That's the good thing about solar power: there's an awful lot of it—much more than we could ever use.But there's a downside too. The energy the Sun sends out arrives on Earth as a mixture of light and heat. Both of these are incredibly important—the light makes plants grow, providing us with food, while the heat keeps us warm enough to survive—but we can't use either the Sun's light or heat directly to run a television or a car. We have to find some way of converting solar energy into other forms of energy we can use more easily, such as electricity. And that's exactly what solar panels do.Solar cellA solar cell is a device that converts the energy of sunlight directly into electricity by the photovoltaic effect. Sometimes the term solar cell is reserved for devices intended specifically to capture energy from sunlight such as solar panels and solar cells, while the term photovoltaic cell is used when the light source is unspecified. Assemblies of cells are used to make solar panels, solar modules, or photovoltaic arrays. Photovoltaics is the field of technology andresearch related to the application of solar cells in producing electricity for practical use. The energy generated this way is an example of solar energy.History of solar cellsThe development of the solar cell stems from the work of the French physicist Antoine-César Becquerel in 1839. Becquerel discovered the photovoltaic effect while experimenting with a solid electrode in an electrolyte solution; he observed that voltage developed when light fell upon the electrode. About 50 years later, Charles Fritts constructed the first true solar cells using junctions formed by coating the semiconductor selenium with an ultrathin, nearly transparent layer of gold. Fritts's devices were very inefficient, transforming less than 1 percent of the absorbed light into electrical energy.By 1927 another metalÐsemiconductor-junction solar cell, in this case made of copper and the semiconductor copper oxide, had been demonstrated. By the 1930s both the selenium cell and the copper oxide cell were being employed in light-sensitive devices, such as photometers, for use in photography. These early solar cells, however, still had energy-conversion efficiencies of less than 1 percent. This impasse was finally overcome with the development of the silicon solar cell by Russell Ohl in 1941. In 1954, three other American researchers, G.L. Pearson, Daryl Chapin, and Calvin Fuller, demonstrated a silicon solar cell capable of a 6-percent energy-conversion efficiency when used in direct sunlight. By the late 1980s silicon cells, as well as those made of gallium arsenide, with efficiencies of more than 20 percent had been fabricated. In 1989 a concentrator solar cell, a type of device in which sunlight is concentrated onto the cell surface by means of lenses, achieved an efficiency of 37 percent due to the increased intensity of the collected energy. In general, solar cells of widely varying efficiencies and cost are now available.StructureModern solar cells are based on semiconductor physics -- they are basically just P-N junction photodiodes with a very large light-sensitive area. The photovoltaic effect, which causes the cell toconvert light directly into electrical energy, occurs in the three energy-conversion layers.The first of these three layers necessary for energy conversion in a solar cell is the top junction layer (made of N-type semiconductor ). The next layer in the structure is the core of the device; this is the absorber layer (the P-N junction). The last of the energy-conversion layers is the back junction layer (made of P-type semiconductor).As may be seen in the above diagram, there are two additional layers that must be present in a solar cell. These are the electrical contact layers. There must obviously be two such layers to allow electric current to flow out of and into the cell. The electrical contact layer on the face of the cell where light enters is generally present in some grid pattern and is composed of a good conductor such as a metal. The grid pattern does not cover the entire face of the cell since grid materials, though good electrical conductors, are generally not transparent to light. Hence, the grid pattern must be widely spaced toallow light to enter the solar cell but not to the extent that the electrical contact layer will have difficulty collecting the current produced by the cell. The back electrical contact layer has no such diametrically opposed restrictions. It need simply function as an electrical contact and thus covers the entire back surface of the cell structure. Because the back layer must be a very good electrical conductor, it is always made of metal.How do solar cells workA solar cell is a sandwich of n-type silicon (blue) and p-type silicon (red).1.When sunlight shines on the cell, photons (light particles)bombard the upper surface.2.The photons (yellow blobs) carry their energy down through thecell.3.The photons give up their energy to electrons (green blobs) inthe lower, p-type layer.4.The electrons use this energy to jump across the barrier into theupper, n-type layer and escape out into the circuit.5.Flowing around the circuit, the electrons make the lamp lightup.Solar Power - Advantages and Disadvantages Solar Power AdvantagesThere are many advantages of solar energy. Just consider the advantages of solar energy over that of oil:· Solar energy is a renewable resource. Although we cannot utilize the power of the sun at night or on stormy, cloudy days, etc., we can count on the sun being there the next day, ready to give us more energy and light. As long as we have the sun, we can have solar energy (and on the day that we no longer have the sun, you can believe that we will no longer have ourselves, either).· Oil, on the other hand, is not renewable. Once it is gone, it is gone. Yes, we may find another source to tap, but that source may run out, as well.· Solar cells are totally silent. They can extract energy from the sun without making a peep. Now imagine the noise that the giant machines used to drill for and pump oil make!· Solar energy is non-polluting. Of all advantages of solar energy over that of oil, this is, perhaps, the most important. The burning of oil releases carbon dioxide and other greenhouse gases and carcinogens into the air.·Solar cells require very little maintenance (they have no moving parts that will need to be fixed), and they last a long time.· Although solar panels or solar lights, etc., may be expensive to buy at the onset, you can save money in the long run. After all, you do not have to pay for energy from the sun. On the other hand, all of us are aware of the rising cost of oil.· Solar powered lights and other solar powered products are also very easy to install. You do not even need to worry about wires.Here are the disadvantages of solar energy:•The initial cost is the main disadvantage of installing a solar energy system, largely because of the high cost of thesemi-conducting materials used in building one.•The cost of solar energy is also high compared tonon-renewable utility-supplied electricity. As energy shortages are becoming more common, solar energy is becoming moreprice-competitive.•Solar panels require quite a large area for installation to achievea good level of efficiency.•The efficiency of the system also relies on the location of the sun, although this problem can be overcome with the installation of certain components.•The production of solar energy is influenced by the presence of clouds or pollution in the air.•Similarly, no solar energy will be produced during nighttime although a battery backup system and/or net metering willsolve this problem.Development, deployment and economicsBeginning with the surge in coal use which accompanied the Industrial Revolution, energy consumption has steadily transitioned from wood and biomass to fossil fuels. The early development of solar technologies starting in the 1860s was driven by an expectation that coal would soon become scarce. However development of solar technologies stagnated in the early 20th century in the face of the increasing availability, economy, and utility of coal and petroleum.The 1973 oil embargo and 1979 energy crisis caused a reorganization of energy policies around the world and brought renewed attention to developing solar technologies.Deployment strategies focused on incentive programs such as the Federal Photovoltaic Utilization Program in the US and the Sunshine Program in Japan. Other efforts included the formation of research facilities in the US (SERI, now NREL), Japan (NEDO), and Germany (Fraunhofer Institute for Solar Energy Systems ISE).Between 1970 and 1983 photovoltaic installations grew rapidly, but falling oil prices in the early 1980s moderated the growth of PV from 1984 to 1996.Photovoltaic production growth has averaged 40% per year since 2000 and installed capacity reached 10.6 GW at the end of 2007,and 14.73 GW in 2008.Since 2006 it has beeneconomical for investors to install photovoltaics for free in return for a long term power purchase agreement. 50% of commercial systems were installed in this manner in 2007 and it is expected that 90% will by 2009. Nellis Air Force Base is receiving photoelectric power for about 2.2 ¢/kWh and grid power for 9 ¢/kWh.Commercial concentrating solar thermal power (CSP) plants were first developed in the 1980s. CSP plants such as SEGS project in the United States have a levelized energy cost (LEC) of 12–14 ¢/kWh.The 11 MW PS10 power tower in Spain, completed in late 2005, is Europe's first commercial CSP system, and a total capacity of 300 MW is expected to be installed in the same area by 2013.In August 2009, First Solar announced plans to build a 2 GW photovoltaic system in Ordos City, Inner Mongolia, China in four phases consisting of 30 MW in 2010, 970 MW in 2014, and another 1000 MW by 2019. As of June 9, 2009, there is a new solar thermal power station being built in the Banaskantha district in North Gujarat. Once completed, it will be the world's largest.。
太阳能发电外文翻译文献

太阳能发电外文翻译文献(文档含中英文对照即英文原文和中文翻译)Design of a Lead-Acid Battery Charging and Protecting IC in Photovoltaic SystemZENG De-you,LING Chao-dong,LI Guo-gang1.IntroductionSolar energy as an inexhaustible, inexhaustible source of energy more and more attention. Solar power has become popular in many countries and regions, solar lighting has also been put into use in many cities in China. As a key part of the solar lighting, battery charging and protection is particularly important. Sealed maintenance-free lead-acid battery has a sealed, leak-free, pollution-free, maintenance-free, low-cost, reliable power supply during the entire life of the battery voltage is stable and no maintenance, the need for uninterrupted for the various typesof has wide application in power electronic equipment, and portable instrumentation. Appropriate float voltage, in normal use (to prevent over-discharge, overcharge, over-current), maintenance-free lead-acid battery float life of up to 12 ~ 16 years float voltage deviation of 5% shorten the life of 1/2. Thus, the charge has a major impact on this type of battery life. Photovoltaic, battery does not need regular maintenance, the correct charge and reasonable protection, can effectively extend battery life. Charging and protection IC is the separation of the occupied area and the peripheral circuit complexity. Currently, the market has not yet real, charged with the protection function is integrated on a single chip. For this problem, design a set of battery charging and protection functions in one IC is very necessary.2.System design and considerationsThe system mainly includes two parts: the battery charger module and the protection module. Of great significance for the battery as standby power use of the occasion, It can ensure that the external power supply to the battery-powered, but also in the battery overcharge, over-current and an external power supply is disconnected the battery is to put the state to provide protection, the charge and protection rolled into one to make the circuit to simplify and reduce valuable product waste of resources. Figure 1 is a specific application of this Ic in the photovoltaic power generation system, but also the source of this design.Figure1 Photovoltaic circuit system block diagramMaintenance-free lead-acid battery life is usually the cycle life and float life factors affecting the life of the battery charge rate, discharge rate, and float voltage. Some manufacturers said that if the overcharge protection circuit, the charging rate can be achieved even more than 2C (C is the rated capacity of the battery), battery manufacturers recommend charging rate of C/20 ~ C/3. Battery voltage and temperature, the temperature is increased by 1 °C, single cell battery voltage drops 4 mV , negative temperature coefficient of -4 mV / ° C means that the battery float voltage. Ordinary charger for the best working condition at 25 °C; charge less than the ambient temperature of 0 °C; at 45 °C may shorten the battery life due to severe overcharge. To make the battery to extend the working life, have a certain solar battery array Charge controllercontroller Dischargecontroller DC load accumulatorunderstanding and analysis of the working status of the battery, in order to achieve the purpose of protection of the battery. Battery, there are four states: normal state, over-current state over the state of charge, over discharge state. However, due to the impact of the different discharge current over-capacity and lifetime of the battery is not the same, so the battery over discharge current detection should be treated separately. When the battery is charging the state a long time, would severely reduce the capacity of the battery and shorten battery life. When the battery is the time of discharge status exceeds the allotted time, the battery, the battery voltage is too low may not be able to recharge, making the battery life is lower. Based on the above, the charge on the life of maintenance-free lead-acid batteries have a significant impact, while the battery is always in good working condition, battery protection circuit must be able to detect the normal working condition of the battery and make the action the battery can never normal working state back to normal operation, in order to achieve the protection of the battery.3.Units modular design3.1The charging moduleChip, charging module block diagram shown in Figure 2. The circuitry includes current limiting, current sensing comparator, reference voltage source, under-voltage detection circuit, voltage sampling circuit and logic control circuit.Figure2 Charging module block diagramdriverV oltage amplifierV oltage sampling comparatorStart amplifierState level control Charging indicator Logicalmodule Undervoltage detection circuitR- powerCurrent sampling comparator Limitingamplifier Power indicatorThe module contains a stand-alone limiting amplifier and voltage control circuit, it can control off-chip drive, 20 ~30 mA, provided by the drive output current can directly drive an external series of adjustment tube, so as to adjust the charger output voltage and current . V oltage and current detection comparator detects the battery charge status, and control the state of the input signal of the logic circuit. When the battery voltage or current is too low, the charge to start the comparator control the charging. Appliances into the trickle charge state when the cut-off of the drive, the comparator can output about 20 mA into the trickle charge current. Thus, when the battery short-circuit or reverse, the charger can only charge a small current, to avoid damage to the battery charging current is too large. This module constitutes a charging circuit charging process is divided into two charging status: high-current constant-current charge state, high-voltage charge status and low-voltage constant voltage floating state. The charging process from the constant current charging status, the constant charging current of the charger output in this state. And the charger continuously monitors the voltage across the battery pack, the battery power has been restored to 70% to 90% of the released capacity when the battery voltage reaches the switching voltage to charge conversion voltage Vsam charger moves to the state of charge. In this state, the charger output voltage is increased to overcharge pressure V oc is due to the charger output voltage remains constant, so the charging current is a continuous decline. Current down to charge and suspend the current Ioct, the battery capacity has reached 100% of rated capacity, the charger output voltage drops to a lower float voltage VF.3.2 Protection ModuleChip block diagram of the internal protection circuit shown in Figure 3. The circuit includes control logic circuit, sampling circuit, overcharge detection circuit, over-discharge detection comparator, overcurrent detection comparator, load short-circuit detection circuit, level-shifting circuit and reference circuit (BGR).Figure3 Block diagram of battery protectionThis module constitutes a protection circuit shown in Figure 4. Under the chip supply voltage within the normal scope of work, and the VM pin voltage at the overcurrent detection voltage, the battery is in normal operation, the charge and discharge control of the chip high power end of the CO and DO are level, when the chip is in normal working mode. Larger when the battery discharge current will cause voltage rise of the VM pin at the VM pin voltage at above the current detection voltage Viov, then the battery is the current status, if this state to maintain the tiov overcurrent delay time, the chip ban on battery discharge, then the charge to control the end of CO is high, the discharge control side DO is low, the chip is in the current mode, general in order to play on the battery safer and more reasonable protection, the chip will battery over-discharge current to take over the discharge current delay time protection. The general rule is that the over-discharge current is larger, over the shorter the discharge current delay time. Above Overcharge detection voltage, the chip supply voltage (Vdd> Vcu), the battery is in overcharge state, this state is to maintain the corresponding overcharge delay time tcu chip will be prohibited from charging the battery, then discharge control end DO is high, and charging control terminal CO is low, the chip is in charging mode. When the supply voltage of the chip under the overdischarge detection voltage (Vdd <Vdl,), then the battery is discharged state, this state remains the overdischarge delay time tdl chip will be prohibited to discharge the battery at this time The charge control side CO is high, while the discharge control terminal DO is low, the chip is in discharge mode. Sampling circuitOver discharge detection comparatorControl logic circuit Level conversion circuit Overcharge detection comparator Over-current detection comparator2 Over-current detection comparator1Over-current detection circuitLoad short detection circuitFigure4 Protection circuit application schematic diagram4.Circuit DesignTwo charge protection module structure diagram, the circuit can be divided into four parts: the power detection circuit (under-voltage detection circuit), part of the bias circuit (sampling circuit, the reference circuit and bias circuit), the comparator (including the overcharge detection /overdischarge detection comparator, over-current detection and load short-circuit detection circuit) and the logic control part.This paper describes the under-voltage detection circuit (Figure 5), and gives the bandgap reference circuit (Figure 6).Figure5 Under-voltage detection circuitProtectionmoduleBiasing circuit Reference circuit Bleeder circuit difference amplifier Output circuitAmplifierAmplifierFigure6 A reference power supply circuit diagramBattery charging, voltage stability is particularly important, undervoltage, overvoltage protection is essential, therefore integrated overvoltage, undervoltage protection circuit inside the chip, to improve power supply reliability and security. And protection circuit design should be simple, practical, here designed a CMOS process, the undervoltage protection circuit, this simple circuit structure, process and easy to implement and can be used as high-voltage power integrated circuits and other power protection circuit.Undervoltage protection circuit schematic shown in Figure 5, a total of five components: the bias circuit, reference voltage, the voltage divider circuit, differential amplifier, the output circuit. The circuit supply voltage is 10V; the M0, M1, M2, R0 is the offset portion of the circuit to provide bias to the post-stage circuit, the resistance, Ro, determine the circuit's operating point, the M0, M1, M2 form a current mirror; R1 M14 is the feedback loop of the undervoltage signal; the rest of the M3, M4 and M5, M6, M7, M8, M9, M10, M11, M12, M13, M14, composed of four amplification comparator; M15, DO, a reference voltage, the comparator input with the inverting input is fixed (V+), partial pressure of the resistance R1, R2, R3, the input to the inverting input of the comparator, when the normal working of the power supply voltage, the inverting terminal of the voltage detection is lost to the inverting terminal voltage of the comparator is greater than V+. Comparator output is low, M14 cutoff, feedback circuit does not work; undervoltage occurs, the voltage divider of R1, R2, R3, reaction is more sensitive, lost to the inverting input voltage is less than V when the resistor divider, the comparator the output voltage is high, this signal will be M14 open, the voltage across R into M at both ends of the saturation voltage close to 0V, thereby further driving down the R1> R2, the partial pressure of the output voltage, the formation of the undervoltage positive feedback. Output, undervoltage lockout, and plays a protective role.5. Simulation results and analysisThe design of the circuit in CSMC 0.6 μm in digital CMOS process simulation and analysis of the circuit. In the overall simulation of the circuit, the main observation is that the protection module on the battery charge and discharge process by monitoring Vdd potential and Vm potential leaving chip CO side and DO-side changes accordingly. The simulation waveform diagram shown in Figure 7, the overall protection module with the battery voltage changes from the usual mode conversion into overcharge mode, and then return to normal working mode, and then into the discharge mode, and finally back to normal working mode. As the design in the early stages of the various parameters to be optimized, but to provide a preliminary simulation results.Figure7 Overvoltage and under-voltage protection circuit simulation waveform6.ConclusionDesigned a set of battery charging and protection functions in one IC. This design not only can reduce the product, they can reduce the peripheral circuit components. The circuit uses the low-power design. This project is underway to design optimization stage, a complete simulation can not meet the requirements, but also need to optimize the design of each module circuit.光伏系统中蓄电池的充电保护IC电路设计曾德友,凌朝东,李国刚1.引言太阳能作为一种取之不尽、用之不竭的能源越来越受到重视。
太阳能光热系统 英语

太阳能光热系统英语English:A solar thermal system, also known as a solar hot water system or solar water heating system, utilizes sunlight to heat water for various purposes such as domestic use, space heating, or industrial processes. It typically consists of solar collectors to capture sunlight, a heat transfer system to transfer the collected heat to a storage tank, and a conventional water heating system or heat exchanger to distribute the heated water as needed. There are two main types of solar thermal systems: passive and active. Passive systems rely on natural circulation to move water through the system, while active systems use pumps or other mechanical devices to circulate the water. Solar thermal systems offer numerous benefits, including reduced energy bills, lower carbon emissions, and decreased reliance on fossil fuels. They can be particularly effective in regions with abundant sunlight, and advancements in technology continue to improve their efficiency and affordability.中文翻译:太阳能光热系统,也称为太阳能热水系统或太阳能热水供暖系统,利用阳光加热水用于各种用途,如家庭用水、空间供暖或工业生产。
太阳能行业专业术语中英文对照汇总
太阳能行业专业术语中英文对照汇总1. 太阳能发电系统 Solar Power Generation System2. 光伏板 Photovoltaic Panel3. 太阳能电池 Solar Cell4. 太阳辐射 Solar Radiation5. 光伏效率 Photovoltaic Efficiency6. 光伏薄膜 Photovoltaic Film7. 太阳能阵列 Solar Array8. 阳光能够转换的源能量 Potential Energy Converted by Sunlight9. 太阳能热发电 Solar Thermal Power Generation10. 光伏发电 Photovoltaic Power Generation11. 太阳能板 Solar Panel12. 逆变器 Inverter13. 太阳能光伏发电系统 Solar Photovoltaic Power Generation System14. 太阳能热水系统 Solar Water Heating System15. 太阳能电池组 Solar Battery Pack16. 漏电保护器 Leakage Protector17. 太阳能光伏电池组 Solar Photovoltaic Battery Pack18. 太阳能光伏电动车 Solar Photovoltaic Electric Vehicle19. 太阳能光伏发电机组 Solar Photovoltaic Power Generation Unit20. 太阳能发电塔 Solar Power Generation Tower21. 太阳能发电站 Solar Power Generation Plant22. 太阳能光伏逆变器 Solar Photovoltaic Inverter23. 太阳能电池板 Solar Cell Panel24. 太阳能电力系统 Solar Power System25. 碳排放 Carbon Emissions26. 绿色能源 Green Energy27. 可再生能源 Renewable Energy28. 太阳集热器 Solar Collector29. 太阳能集热器箱体 Solar Collector Box30. 太阳能热发电站 Solar Thermal Power Plant31. 太阳能发电设备 Solar Power Generation Equipment32. 光伏组件 Photovoltaic Module33. 太阳能光伏组件 Solar Photovoltaic Module34. 太阳能发电功率 Solar Power Generation Capacity35. 太阳能发电效益 Solar Power Generation Efficiency36. 太阳能热发电效率 Solar Thermal Power Generation Efficiency37. 太阳能供暖系统 Solar Heating System38. 太阳能温水器 Solar Water Heater39. 太阳能光伏装置 Solar Photovoltaic Device40. 太阳能热力系统 Solar Thermal System41. 太阳能电池片 Solar Cell Wafer42. 太阳能热发电板 Solar Thermal Power Generation Board43. 太阳能热发电效益 Solar Thermal Power Generation Benefit44. 太阳能热发电塔式反应器 Solar Thermal Power Generation Tower Reactor45. 光伏面板 Photovoltaic Panel46. 太阳能光伏面板 Solar Photovoltaic Panel47. 太阳能热板 Solar Thermal Plate48. 太阳能直驱泵 Solar Direct Drive Pump49. 太阳能冷水机组 Solar Cooling Unit50. 太阳能蓄电系统 Solar Battery Charging System。
太阳能专业英语翻译
Unit1 renewable Energy CommercializationIntroduction可再生能源商业化涉及可再生能源三代技术的部署要追溯到100多年,见图1.1和图1.2。
第一代技术已经成熟和经济竞争包括,生物量、水力发电、地热能和热。
第二代市场化技术目前正在部署,其中包括太阳能加热,光伏发电,风力发电、太阳能热发电站和现代形式的生物能源。
第三代技术需要继续努力研究和开发(研发)为了在全球范围内,做出巨大的贡献。
先进的生物质气化技术、包括干热岩地热发电,海洋能发电.有一些非技术性的障碍广泛存在于可再生能源,而且往往是公共政策和政治领导,帮助解决这些障碍,推动可再生能源技术的更广泛的利用。
2010年,98个国家制定自己的可再生能源期货目标和制定广泛的公共政策来提倡可再生能源。
而且气候变化的问题推动了可再生能源行业的增长。
领先的可再生能源公司包括第一太阳能、Gamesa、通用电气能源,q - cells,锋利太阳能、西门子、Sunopta尚德和维斯塔斯。
可再生能源的总投资在2010亿年达到211亿美元,高于在2009年的160亿美元。
2010年投资最多的国家是中国、德国、美国、意大利和巴西。
预计可再生能源行业的持续增长和与许多其他行业相比在2009年经济危机中促销政策能帮助天气行业。
美国总统奥巴马在2009年美国复苏与再投资法案中包括再投资700亿美元的支出和抵免税收对清洁能源和相关的运输计划。
清洁科技表明,清洁能源的商业化已经帮助世界各国摆脱2009年的全球金融危机。
经济分析师预计市场可再生能源(天然气)收益在2011年日本核事故直接影响了在全球范围内可再生能源行业中大约300万个工作岗位,其中大约一半是生物燃料产业。
根据国际能源署2011年的推测, 在50年内太阳能发电机可能产生世界上大多数的电力,显著降低有害温室气体的排放。
Lesson1 overviewRationale for renewables气候变化、污染和能源安全是当前最严重的问题和解决他们需要能量基础设施的重大改变。
光伏发电系统外文翻译文献

文献信息:文献标题:A New Controller Scheme for Photovoltaics Power Generation Systems(光伏发电系统的一种新的控制方案)国外作者:Tamer T.N.Khatib,Azah Mohamed,Nowshad Amin文献出处:《European Journal of Scientific Research》,2009,Vol.33 No.3, pp515-524字数统计:英文1337单词,7006字符;中文2149汉字外文文献:A New Controller Scheme for Photovoltaics PowerGeneration SystemsAbstract:This paper presents a new controller scheme for photovoltaic (PV) power generation systems. The proposed PV controller scheme controls both the boost converter and the battery charger by using a microcontroller in order to extract maximum power from the PV array and control the charging process of the battery. The objective of the paper is to present a cost effective boost converter design and an improved maximum power point tracking algorithm for the PV system. A MATLAB based simulation model of the proposed standalone PV system has been developed to evaluate the feasibility of the system in ensuring maximum power point operation.1.IntroductionRecently, the installation of PV generation systems is rapidly growing due to concerns related to environment, global warming, energy security, technology improvements and decreasing costs. PV generation system is considered as a clean and environmentally-friendly source of energy. The main applications of PV systems are in either standalone or grid connected configurations. Standalone PV generationsystems are attractive as indispensable electricity source for remote areas. However, PV generation systems have two major problems which are related to low conversion efficiency of about 9 to 12 % especially in low irradiation conditions and the amount of electric power generated by PV arrays varies continuously with weather conditions. Therefore, many research works are done to increase the efficiency of the energy produced from the PV arrays.The solar cell V-I characteristics is nonlinear and varies with irradiation and temperature. But there is a unique point on the V-I and P-V curves, called as the maximum power point (MPP), at which at this point the PV system is said to operate with maximum efficiency and produces its maximum power output. The location of the MPP is not known but can be traced by either through calculation models or search algorithms. Thus, maximum power point tracking (MPPT) techniques are needed to maintain the PV array’s operating point at its MPP. Many MPPT techniques have been proposed in the literature in which the techniques vary in many aspects, including simplicity, convergence speed, hardware implementation and range of effectiveness. However, the most widely used MPPT technique is the perturbation and observation (P&O) method. This paper presents a simple MPPT algorithm which can be easily implemented and adopted for low cost PV applications. The objective of this paper is to design a novel PV controller scheme with improved MPPT method.The proposed standalone PV controller implementation takes into account mathematical model of each component as well as actual component specification. The dc–dc or boost converter is the front-end component connected between the PV array and the load. The conventional boost converter may cause serious reverse recovery problem and increase the rating of all devices. As a result, the conversion efficiency is degraded and the electromagnetic interference problem becomes severe under this situation. To increase the conversion efficiency, many modified step-up converter topologies have been investigated by several researchers. V oltage clamped techniques have been incorporated in the converter design to overcome the severe reverse-recovery problem of the output diodes. In this paper, focus is also given in the boost converter design. Another important component in the standalone PV systemsis the charge controller which is used to save the battery from possible damage due to over-charging and over-discharging. Studies showed that the life time of a battery can be degraded without using a charge controller.The proposed new controller scheme for the standalone PV system controls both the boost converter and the charge controller in two control steps. The first step is to control the boost converter so as to extract the maximum power point of the PV modules. Here, a high step-up converter is considered for the purpose of stepping up the PV voltage and consequently reducing the number of series-connected PV modules and to maintain a constant dc bus voltage. A microcontroller is used for data acquisition that gets PV module operating current and voltage and is also used to program the MPPT algorithm. The controller adopts the pulse width modulation (PWM) technique to increase the duty cycle of the generated pulses as the PV voltage decreases so as to obtain a stable output voltage and current close to the maximum power point. The second control step is to control the charge controller for the purpose of protecting the batteries. By controlling the charging current using the PWM technique and controlling the battery voltage during charging, voltages higher than the gassing voltage can be avoided.2.Design of the Proposed Photovoltaic SystemMost of the standalone PV systems operate in one mode only such that the PV system charges the battery which in turns supply power to the load. In this mode of operation, the life cycle time of the battery may be reduced due to continuous charging and discharging of the battery. The proposed standalone PV system as shown in terms of a block diagram in Figure 1 is designed to operate in two modes: PV system supplies power directly to loads and when the radiation goes down and the produced energy is not enough, the PV system will charge the battery which in turns supply power to the load. To manage these modes of operation, a controller is connected to the boost converter by observing the PV output power.3.MethodologyFor the purpose of estimating the mathematical models developed for the proposed standalone PV system, simulations were carried in terms of the MATLAB codes. Each PV module considered in the simulation has a rating of 80 Watt at 1000 W/m2, 21.2 V open circuit voltage, 5A short circuit current. The PV module is connected to a block of batteries with of sizing 60 Ah, 48 V.4.Results and DiscussionThe simulation results of the standalone PV system using a simple MPPT algorithm and an improved boost converter design are described in this section. Simulations were carried out for the PV system operating above 30o C ambient temperature and under different values of irradiation. Figure 9 shows the PV array I-V characteristic curve at various irradiation values. From the figure, it is observed that the PV current increase linearly as the irradiation value is increased. However, the PV voltage increases in logarithmic pattern as the irradiation increases. Figure 10 shows the PV array I-V characteristic curve at various temperature values. It is noted from the figure that, the PV voltage decreases as the ambient temperature is increased.Figure 4 compares the PV array P-V characteristics obtained from using the proposed MPPT algorithm and the classical MPPT P&O algorithm. From this figure, it can be seen that by using the proposed MPPT algorithm, the operating point of PV array is much closer to the MPP compared to the using the classical P&O algorithm.In addition, the proposed boost converter is able to give a stable output voltage as shown in Figure 5. In terms of PV array current, it can be seen from Figure 6 that the PV current is closer to the MPP current when using the improved MPPT algorithm. Thus, the track operating point is improved by using the proposed MPPT algorithm. In terms of efficiency of the standalone PV system which is calculated by dividing the load power with the maximum power of PV array, it is noted that the efficiency of the system is better with the proposed MPPT algorithm as compared to using the classical P&O algorithm as shown in Figure 7.5.ConclusionThis paper has presented an efficient standalone PV controller by incorporating an improved boost converter design and a new controller scheme which incorporates both a simple MPPT algorithm and a battery charging algorithm. The simulation results show that the PV controller using the simple MPPT algorithm has provided more power and better efficiency (91%) than the classical P&O algorithm. In addition, the proposed boost converter design gives a better converter efficiency of about 93%. Such a PV controller design can provide efficient and stable power supply for remote mobile applications.中文译文:光伏发电系统的一种新的控制方案摘要:本文提出了一种新的光伏(PV)发电系统控制器方案。
新能源专业英语基础课文翻译

新能源专业英语基础课文翻译新能源专业英语新能源专业英语新能源专业英语新能源专业英语1。
Put thefollowingphraseintoEnglish.Unit11.温室效应thegreenhouseeffect2。
可再生能源renewableenergy3.太阳能电池solar cell4。
风力发电系统windturbinesystem5.核能nuclearenergy6.海洋能oceanenergyUnit21.辐射度irradiance2.负载load3.耐候性weatherfastness4.光电效应photoelectriceffect5.光生伏打效应photov oltaiceffectUnit31.风电场windfarm2.装机容量installedcapacity3.涡轮机turbine4。
水泵waterpumping5.风光互补windandphotovoltaichybridpower6.混合动力装置hybridpowersystem7.电网utilitygrid8。
电池batteryUnit41.热交换器heatexchanger2.核反应堆nuclearreactor新能源专业英语新能源专业英语新能源专业英语3。
浓缩铀enricheduranium4.低温冷却水subcooledwater5。
千瓦kilowatt6.沸水反应堆boilingwaterreactor7。
商用发电站comme rcialpowerplant8.快速中子反应堆afastneutronreactorUnit51.生物质biomass2.植物vegetation3.肥料manure4.残留物residue5.光合作用photosynthesis6.碳水化合物carbohydrate7.化石燃料fossilfuels8.固定碳carbonfixedUnit61.万有引力gravitationalpull2。
- 1、下载文档前请自行甄别文档内容的完整性,平台不提供额外的编辑、内容补充、找答案等附加服务。
- 2、"仅部分预览"的文档,不可在线预览部分如存在完整性等问题,可反馈申请退款(可完整预览的文档不适用该条件!)。
- 3、如文档侵犯您的权益,请联系客服反馈,我们会尽快为您处理(人工客服工作时间:9:00-18:30)。
P sh (h)=0 (P pc (h)> P D (h)) (5-2-6a)P sh (h )=P D (h )-P pc (h ) (P pc (h)<= P D (h) ) (5-2-6b)因此,一年中的第d 日(d=1~365)的瞬时供电量P ef1( d ) [kWh/日],剩余电量P sur ( d ) [kWh/日],不足电量P sh (d ) [kWh/日],可以根据以下公式计算出来。
P ef1( d )=∑P ef1(h)n+23h=n (5-2-7) P sur ( d )= ∑P sur (h)n+23h=n (5-2-8) P sh (d )== ∑P sh (h )n+23h=n (5-2-9)其中n 表示一年中第d 日第一时间带(0~1时)。
在[有逆潮流/没蓄电池]的系统构成中,剩余电量在电力系统中是以逆潮流的形式在系统内被有效地利用。
因此,一天的剩余电量中被有效利用的电量P ef2( d ) [kWh/日]等于剩余电量P sur ( d )。
即:P ef2( d )= P sur ( d ) (5-2-10)5.2.3 生活周期评价指数的定义描述作为评价对象的太阳光发电系统的能源偿还时间(EPT :Energy Payback Time ), 二氧化碳偿还时间(CO 2 PT :CO 2Payback Time ), 成本偿还时间(CPT:Cost Payback Time ), CO 2排出原单位g co2, 发电成本GC pv 等生活周期评价指标的定义和计算方法。
(1) 能源偿还时间(EPT :Energy Payback Time )EPT ,是将作为评价对象的太阳光发电系统导入时的初期投入能源量从【由系统的运用决定的回避可能的年能源量中扣除在系统运用中追加投入的一年的能源量后的实际一年回避可能能源量】中回收所需要的年数。
根据太阳光发电系统的耐用年数和要求的EPT 的大小关系的比较,可以评价太阳光发电系统的能源盈利能力。
还有,太阳光发电系统虽然随着日照的变动发电量不随意地变化,但从将计算简化的观点出发,经常将在这个模型中与太阳光发电系统的1KWh 发电量相比较的供电技术的1KWh 发电量视为等价的。
将太阳电池模块和必要的辅助机器的投入能源原单位设为e pv [MJ/W], e k [MJ/W 即MJ/m 2](k 表示必要的辅助机器),太阳光发电系统的EPT 可以用以下公式求出。
EPT=E inE AV −E om=(e pv +∑e k k≠AS )·P m +e AS ·S mf elc·P ef −E om(5-2-11)其中,E in [MJ]:太阳光发电系统的初期投入能源量E AV [MJ/年]:由太阳光发电系统导入决定的年回避可能能源量 e pv [MJ/W]:太阳能电池模块平均1W 投入能源原单位 e k [MJ/W]:除去架台的辅助机器平均1W 投入能源原单位 P m [w]:作为对象的太阳光发电系统的模块容量 e AS [MJ/m 2]:模块面积平均1m 2的架台投入的能源原单位 S m [m 2]:太阳光发电系统的模块面积 f elc [MJ/kWh]:电力的一次能源换算系数 E om [MJ/年]:一年运用能源量S m 是通过输入细胞效率,细胞大小,模块大小,模块容量和表面玻璃的透光率计算出来的。
f elc是二次能源的电力换算成一次能源的换算系数,适用于与用于太阳能电池模块的投入能源原单位的计算的值相同的值。
考虑太阳光发电系统的耐用年数,虽然不是严密的定值,随着年数的经过变化不明确,但是因为预想在系统耐用期限内的变化值很小,在这个模型中作为原则使用一定值。
另外,E om是一年的修缮、保养的能源等方面的考虑,在这个模型中如果没有特殊指定,认为E om =0。
(2)二氧化碳偿还时间(CO2 PT: CO2 Payback Time)CO 2 PT的考虑方法和定义和EPT同样。
即,CO 2 PT是将作为评价对象的太阳光发电系统制造时的CO2排出量,从运用阶段里回避可能的年CO2 排出量中回收所需要的年数,由以下公式可以算出。
CO2 PT=CO2inCO2AV−CO2om =(CO2PV+∑CO2kk≠AS)·Pm+C02AS·S mf elc·P ef−E om(5-2-12)其中,CO2in[MJ]:太阳光发电系统的初期投入机器的CO2排出量CO2AV[MJ/年]:由太阳光发电系统导入决定的年回避可能CO2 排出量CO2PV[g-C/W]:太阳能电池模块制造时的CO2排出原单位CO2k[g-C/W]:制造除去架台的辅助机器k时的CO2排出原单位CO2AS[g-C/W]:平均1m2模块面积必要的架台的CO2排出原单位CO2elc[g-C/kWh]:系统电力(受电端)的CO2排出原单位CO2om [g-C/年]:运用时的年CO 2排出量CO2elc 是系统电力的CO 2排出原单位,它和年有效发电电量的乘积等于由太阳光发电系统决定的被回避的年CO 2排出量。
关于这个CO2elc ,考虑到太阳光发电系统的发电只在白天进行,使用石油火力的发电电力(受电端)平均1kWh 的CO 2排出原单位。
另外,CO2om 是一年的修缮、保养时排出的CO 2等方面的考虑,在这个模型中若无特别指定认为CO2om =0。
(3) CO 2排出原单位:g co2CO 2排出原单位是太阳光发电系统的使用寿命期内发电电量的平均CO 2排出量,是将太阳光发电系统的CO 2减排效果与其他发电技术作比较的有用指标。
gCO2=(CO2PV +∑ CO2k k≠AS )·Pm+C02AS ·S m +CO2om·L PVP ef·L PV(5-2-13)其中,L pv [年]:太阳光发电系统的耐用年数。
(4)成本偿还时间(CPT :Cost Payback Time )CPT 是将太阳光发电系统的初期导入成本,在导入后以回避可能的成本的形式回收所需要的年数。
在此模型中,前提是用于CPT 的计算的构成机器的成本用的是上市价格,而不是制造原价。
在上市价格不明确的情况下,除了制造原价,还要考虑一般管理费,研究开发费,运输保管费,销售费用及利益等,制造原价乘以上市价格系数a 所得的值作为上市价格。
CPE =C inC AV −C om =a·(C PV +∑C k k≠AS )·P m +a·C AS ·S m +C instC AV −C om(5-2-14)其中,C in [日元]:太阳光发电系统的初期投入成本(上市价格) C AV [日元/年]:由太阳光发电系统的的导入决定的年回避可能成本a[-]:上市价格系数(=1.47)C PV [日元/W]:太阳能电池模块的成本原单位 C k [日元/W]:除去架台的辅助机器k 的成本原单位 C AS [日元/m 2]:模块平均1m 2必要的架台的成本原单位 C inst [日元]:太阳光发电系统的设置成本C om [日元/年]:太阳光发电系统的年运用成本(包含保养费用) 另外,在系统耐用期限中有必要更新的机器k 的成本包含在运用 成本中,根据以下的资本回收系数换算成年费用。
D (l k )=r·(1+r)l k(1+r)l k−1 (5-2-15)其中,r[-]:利率l k [年]:作为对象的机器k 的耐用年数。
(5)发电成本:gc pv [日元/kWh]太阳光发电系统的发电成本gc pv [日元/kWh]用以下公式计算。
gc pv =∑AC k k p ef(5-2-16)其中,AC k [日元/年]:构成机器k 的年经费。
AC k 的值在构成机器k 的耐用年数l k 和太阳光发电系统的耐用年数L PV 相比更长与更短的情况下,算出方法不同。
成本原单位关于平均1W 分配的模块,能量调节器以及配线,AC k =α·D(l k )· C k · P m (5-2-17a)(l k ≧ L PV 的情况)AC k =α·D(l k )·P m ·C k ·l k+(L pv −l k )2(1+r)l AS ·l ASL pv(5-2-17b)(l k < L PV 的情况)成本原单位关于模块面积平均1m 2分配的架台,AC AS =α·D(l AS )·C AS ·S m (5-2-18c)(l k ≧ L PV 的情况)AC AS =α·D(l AS )·S m ·C AS ·l AS+(L PV −l AS )2(1+r)l AS ·l ASL pv(5-2-18d)(l k < L PV 的情况) 另外,关于设置成本,AC inst =D(L PV )·C inst ·S m (5-2-18e)5.2.4 随时间变化的电力需要数据的制作像上面所述,评价[有逆潮流/有蓄电池]的太阳光发电系统的时候,有必要将由于太阳电池模块的发电量和住宅内电力需要量不相符而产生的剩余电量区别处理。
为此,必须得到日照量和电力需要相关的随时间变化的数据。
关于日照量,已经描叙过的网罗了国内各地不同时间日照数据的[MET-PV]是由气象协会整理出来的,在本模型中也在利用它。
另一方面,关于住宅的电力需要,适用于这种分析目的数据还未被整理出来。
在本模型中使用的是(财)省能源中心实际施行的在一般世代中的电力需要实测数据。
根据图5-2-4表示的顺序制作了一年间住宅的不同时间电力需要数据。
结果在图5-2-5中表示。
一年间的不同时间电力需要变化轮廓的作成(图5-2-4)住宅电力需要数据的作成顺序(表5-2-5)一世代的年间电力需要量,月别电力需要量,以及日平均电力需要量(1995)5.2.5 系统评价结果(1)模块的投入能量,CO2 排出量以及投入成本用于系统评价的poly-Si, a-Si太阳电池模块的各情况中的投入能量,CO2 排出量,投入成本用表5-2-6,5-2-7表示。
从模块投入(表5-2-6)各分析情况的poly-Si太阳电池模块的投入能量,CO2 排出量以及投入成本(表5-2-7)各分析情况的a-Si太阳电池模块的投入能量,CO2 排出量以成本来看,poly-Si的Case3-1GW和a-Si得Case2-1GW大致相等,分别为112,106日元/W。
从投入能量,CO2排出量来看,a-Si模块是poly-Si模块的约70%的低值。