Extraction of total RNA and DNA from bacterioplankton
药物筛选靶点蛋白2009-514
AG GCA AAC CTA AGA GCA CAG TC CGT TTG GAT TCT CGT GTC K A N L R A Q Reverse primer
CAC C GTG G AC CAC CA C TG GT G GTG CAC CAC T H H H GA GT H H G GTG ACT GCGGCCG CG CGCC H St GGCG op C NotI
附:表观遗传学(epigenetics)
当然,有些遗传现象则无法用“中心法则”来解 释清楚,也不符合孟德尔定律,简言之,有许多 调控基因的信息,它们虽然本身不改变基因的序 列,但是可以通过基因修饰,蛋白质与蛋白质、 DNA和其它分子的相互作用,而影响和调节基因 的功能和特性,并且通过细胞分裂和增殖周期影 响遗传。(例:X染色体失活) 表观遗传学(epigenetics) 则是指基于非基因序列改 变所致基因表达水平变化, 如DNA甲基化、RNA干 扰、组蛋白修饰和染色质改型等都可引起上述变 化。
5 ′ AGGCAAACCTAAGAGCACAG 3 ′ 3 ′ TCCGTTTGGATTCTCGTGTC 5 ′
保护碱基
原来的
His-tag
Stop Not I
3TCCGTTTGGATTCTCGTGTCGTGGTGGTGGTGGTGGTGACTCGCCGGCGG 5
按阅读习惯把它180°旋转使5在左边!(见下页)
药物筛选靶点蛋白的基因克隆与表达 Gene cloning and expression of the target proteins for drug screening
中国医学科学院 北京协和医学院
药物研究所
朱
平
Why doing it?
RNA、DNA和Protein纯化操作步骤
RNA/DNA/Protein Purification Products from MACHEREY-NAGELRNA/DNA/Protein Mini spin kitMaximum output – in one procedure NucleoSpin® TriPrepSimultaneous extraction ofTotal RNAGenomic DNATotal proteinfrom one unsplit sample MNMACHEREY-NAGEL O n e P r e p–T hr e e r e s u l t s!NucleoSpin ® TriPrepParallel isolation of RNA, DNA, and protein for most significant gene expression profilingOne Prep – Three resultsTotal RNA of superior quality – for reliable RT-PCR and all common downstream applications Genomic DNA of high purity – ready-to-use for e.g. PCR, sequencing, restriction enzyme digestion T otal protein in high recovery – directly suitable for quantification, SDS-PAGE, and Western blot analysis Rely on your experiments RNA/DNA/protein extracted from one unsplit sample – direct correlation – no variations Save your timeParallel isolation of RNA, DNA, and protein within one hourSave precious sample materialMaximum output – isolate three analytes from one sample High sensitivity – ideal for small and limited samplesProcedurehomogenizationof samplecell lysisfiltration of lysate NucleoSpin bind DNA/RNAProtein in flow-throughProtein purificationprecipitate protein (Protein Precipitator)wash protein pellet redissolve pellet in Protein Solving Buffertotal ProteinRNA purification digest residual DNA (rDNase incubation at RT)wash RNA elute RNADNA purificationwash DNA elute DNAtotal DNA DNA bound to silica membrane RNA bound to silica membrane total RNASample Material Sample Amount Lane Human cells (HeLa) 106 cells 1Mouse liver 3 mg 2Fish (Zebrafish) 1 larvae 3Plant root 100 mg 4Plant leave 100 mg 5Yeast 108 cells 6Bacteria 109 cells 7Product at-a-glanceTechnologySilica-membrane technology Sample material ≤ 5 x 10⁶ cells≤ 30 mg human/animal tissue≤ 100 mg plant tissue Typical yield DNA ≤ 6 μg RNA ≤ 70 μgProtein ≤ 1,200 μg Typical Ratio A 260/A 280 DNA 1.7 – 1.9RNA 1.9 – 2.1 Preparation time RNA/DNA/protein ~ 60 – 75 min RNA/DNA ~ 45 minProtein ~ 35 minApplication dataRNA/DNA/protein extraction from a large variety of starting materialsRNA, DNA, and pr otein were isolated in parallel from the same source. The range of starting materialscovers tissues, cells, plant materials, yeast, and bacteria.Total DNA of high molecular weight and purity DNA was eluted in 100 μl DNA Elute buffer. A 260/A 280 ratios are in the range of 1.81 – 1.94.DNA analyzed on 1% TAE agarose gel electrophoresis*III; Fermentas), Lanes 1-7: see table belowTotal RNA of high structural integrityRNA was eluted in 50 μl RNase-free H 2O.The RNA integrity number (RIN) was measured for all mammalian samples.RIN was 9.5 for HeLa cell RNA and 8.9 for mouse liver RNA.RNA analyzed on Agilent 2100 Bioanalyzer/RNA 6000 Nano Kit*Lane L: RNA Ladder (RNA 6000 Nano Marker; Agilent), Lanes 1-7: see table belowL 1 2 3 4 5 6 7Protein Solving Buffer .The proteins are ready to use in SDS-PAGE analysis, as well as for Lane L: Protein ladder (low molecular weight marker; GE), Lanes 1-7: see table below* Figures are compiled from different gels and runs, aligned to the corresponding length markersHigh quality RNA, DNA, and proteinfrom the same sourcePerfectly suitable for gene expression profilingL 1 2 3 4 5 6 7NucleoSpin ® TriPrepOrdering informationPrepsTriPrep*10/50/250 Mini spin kit for the simultaneous isolation of total RNA, genomic DNA, and total protein from a wide variety of unsplit samples.Protein Quantification Assay50/250 RNA/Protein10/50/250 Mini spin kit for the simultaneous isolation of total RNA and Protein from unsplit samples. Including rDNAse and shredders.Mini spin columns – XS designRNA XS10/50/250 Mini spin kit for the isolation of highly concentrated total RNA from extremely small amount of starting material. Elution down to 5 μl.RNA/DNA Buffer set*100 Buffer set for the simultaneous isolation of RNA and DNA from unsplit samples. To be used in combination with NucleoSpin ® RNA II, RNA Plant, NucleoSpin ® RNA/Protein kits./bioanalysis for detailed information Your local distributor:Accurate and reliableProtein concentration down to 0.001 μg/μl Correlation coefficient of 0.97 – 1.00Protein quantification made easy!。
TAKARA RNAiso Plus( total RNA extraction reagent)
3. Total RNA 的提取。 ① 向上述步骤 2 的匀浆裂解液中加入氯仿(RNAiso Plus 的 1/5 体积量),盖紧离心管盖,混合至溶 液乳化呈乳白色。 ② 室温静置 5 分钟。 -2-
③ 12,000 g 4℃离心 15 分钟。从离心机中小心取出离心管,此时匀浆液分为三层,即:无色的上清 液(含 RNA)、中间的白色蛋白层(大部分为 DNA)及带有颜色的下层有机相。
④ 吸取上清液转移至另一新的离心管中(切勿吸出白色中间层)。 ⑤ 向上清中加入 0.5-1 倍 RNAiso Plus 体积的异丙醇,上下颠倒离心管充分混匀后,室温下静置 10
分钟。 ⑥ 12,000 g 4℃离心 10 分钟。一般在离心后,试管底部会出现 RNA 沉淀。
4. RNA 沉淀的清洗。 小心弃去上清, 切勿触及沉淀,残留少量异丙醇没有关系。加入与 RNAiso Plus 等量的 75%乙醇,轻 轻上下颠倒洗涤离心管管壁,7,500×g 4℃离心 5 分钟后小心弃去上清,切勿触及沉淀。
● 参考文献
1. Chirgwin, J. et al ., (1979) Isolation of Biologically Active Ribonucleic Acid from Sources Enriched in Ribonuclease , Biochemistry . 18 (24) : 5294-5299.
② 提取 RNA 时使用的试剂及器材中混有 RNA 分解酶。 ③ 提取的组织材料中含有大量的 RNA 分解酶,而 RNAiso Plus 的添加量不够。
5. 提取的 RNA 中含有 DNA 污染,为什么? ① 裂解组织或细胞使用的 RNAiso Plus 量偏少。请按用量表添加或多于用量表添加。 ② 使用的组织材料中含有大量的有机溶剂(如:乙醇、异丙醇等)、高浓度的 Buffer、碱性溶剂等。 ③ 如果提取的 RNA 中含有 DNA 时,可以使用 Recombinant DNase I (RNase-free)(Code No. 2270A )进行 DNA 消化。
提植物总RNA及去DNA和反转录标准方法(会给实验室一大笔提取试剂盒的经费)

Trizol法提取植物总的RNA及反转录可用于RT-PCR【中文版】一、植物总RNA 的提取抽提RNA 所用的研钵酒精灼烧5-10min或灭菌.,器皿均高温高压灭菌,以去除RNA 酶,所有试剂都保证没有RNA 酶污染。
1) 1.5ml 离心管,取0.1g 组织在液氮中研磨至粉末, 立即加入1ml Trizol,涡旋充分混匀后放置2min。
2) 加0.2体积(氯仿Chloroform),剧烈振荡15s(vortex),室温放置3min(或不放置,直接离心)。
3) 4℃,12000rpm 离心5min,样品会分成3 层,取上层水相,取上清。
4) 加等体积的异丙醇,混匀,4℃放置10min以上。
或可以-80℃过夜。
5) 4℃,12000rpm 离心20min,4℃弃上清,管底管侧形成胶状沉淀(可看到白色沉淀)。
6) 加1ml 75%乙醇,充分溶解沉淀。
4℃,12000rpm 离心5min。
倒掉上清,用移液器吸干。
7) 晾干约10 min。
(不要晾太长时间,看不到水就可以加灭菌水)8) 加50μl灭菌的超纯水,65℃溶解,-20℃(最好-80℃)保存。
(注:要是处理DNase就不能加这么多水。
可以加5μl)整个提取步骤最好咋在4℃或冰上完成二、DNase I 处理消化植物总RNA 中的基因组DNA1) 将上述全部提取的植物总RNA 5μl,然后顺序加入1μl 10×缓冲液,1μl DNase,3μl RNase-free水,总体积10μl,充分混匀后,37℃温育30 min。
2)加入300ul 灭菌水提高体积,然后加入300ul PCI,vortex;4℃,12000rpm 离心5min;3) 加入1/10 体积3M 醋酸钠(autoclaved) pH 5.2, 和2倍体积的100% EtOH;(-20℃,10-30min或可以-80℃过夜)4) 4℃,12000rpm 离心15min,6)75% EtOH, 300ul, 12000 rpm 5min7) dry (10-15min)and add 30-50 ul of ddH2O三、反转录cDNA1) 在上述总体积为11μl 反应液中加入1μl Oligo(dT)18 引物4μl 5×缓冲液,2 μl dNTP,1μl 反转录酶,1μl RNase 抑制剂,总体积20μl,充分混匀后,42℃温育1-1.5hr。
RNA提取方法
3. Total RNA 的提取。 ① 向上述步骤 2 的匀浆裂解液中加入氯仿(RNAiso Plus 的 1/5 体积量),盖紧离心管盖,用手剧烈 振荡 15 秒(氯仿沸点低、易挥发,振荡时应小心离心管盖突然弹开)。待溶液充分乳化(无分相 现象)后,再室温静置 5 分钟。 ② 12,000 g 4℃离心 15 分钟。 ③ 从离心机中小心取出离心管,此时匀浆液分为三层,即:无色的上清液、中间的白色蛋白层及带 有颜色的下层有机相。吸取上清液转移至另一新的离心管中(切忌吸出白色中间层)。 ④ 向上清中加入等体积的异丙醇,上下颠倒离心管充分混匀后,在 15~30℃下静置 10 分钟。 ⑤ 12,000 g 4℃离心 10 分钟。一般在离心后,试管底部会出现沉淀。 -2-
图 1.动物组织 RNA 提取结果电泳图
2. 从植物组织中提取 Total RNA。 使用本试剂盒从马铃薯块根、香菇子实体、烟草叶片、水稻叶片、芒果果实、花生果实等组织中提取 了 Total RNA,电泳结果见图 2。
1 2 3 4 5 6 M1
1% Agarose 凝胶电泳图 M1:DL2,000 DNA Marker 1:马铃薯块根 2:香菇子实体 3:烟草叶片 4:水稻叶片 5:芒果果实 6:花生果实
● 制品组成
RNAiso Plus*
100 ml
* RNAiso Plus 中含有强变性剂,应避免与皮肤、衣物等接触。若不小心接触到眼睛或皮肤时,请 立即到医院进行处理。
【试剂盒之外所需准备试剂】 ◆ 氯仿 ◆ 异丙醇 ◆ 75%乙醇(DEPC 处理水配制) ◆ RNase-free 水(制备方法:使用 RNase-free 的玻璃瓶,向超纯水中加入 DEPC 至终浓度 0. 1%
2. 有关 RNA 的吸光度说明如下: 260nm、320nm、230nm、280nm下的吸光度分别代表了核酸、背景(溶液浑浊度)、盐浓度和蛋白质 等有机物的吸光度值。OD 260 /OD 280 (R)体现了RNA中的蛋白质等有机物的污染程度,质量较好的 RNA的R值应在 1.8~2.2 之间,当R<1.8 时,溶液中的蛋白质等有机物的污染比较明显;当R> 2.2 时, 说明RNA已经被水解成了单核苷酸。 在对核酸进行吸光度检测时,需要注意稀释液应使用 TE Buffer。
PrepSEQ Nucleic Acid Extraction Kit使用手册说明书
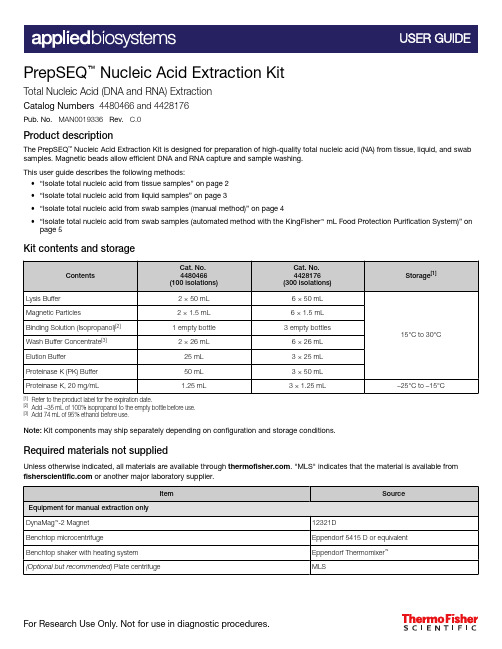
PrepSEQ ™ Nucleic Acid Extraction KitTotal Nucleic Acid (DNA and RNA) ExtractionCatalog Numbers 4480466 and 4428176Pub. No. MAN0019336 Rev. C.0Product descriptionThe PrepSEQ ™Nucleic Acid Extraction Kit is designed for preparation of high-quality total nucleic acid (NA) from tissue, liquid, and swab samples. Magnetic beads allow efficient DNA and RNA capture and sample washing.This user guide describes the following methods:•“Isolate total nucleic acid from tissue samples” on page 2•“Isolate total nucleic acid from liquid samples” on page 3•“Isolate total nucleic acid from swab samples (manual method)” on page 4•“Isolate total nucleic acid from swab samples (automated method with the KingFisher ™ mL Food Protection Purification System)” on page 5Kit contents and storage[1]Refer to the product label for the expiration date.[2]Add ~35 mL of 100% isopropanol to the empty bottle before use.[3]Add 74 mL of 95% ethanol before use.Note: Kit components may ship separately depending on configuration and storage conditions.Required materials not suppliedUnless otherwise indicated, all materials are available through . "MLS" indicates that the material is available from or another major laboratory supplier.Isolate total nucleic acid from tissue samplesa.Place up to 100 mg of solid (tissue) sample in a 1.5-mL microcentrifuge tube.b.Add 300 μL of PK Buffer and 10 μL of Proteinase K.c.Incbate for 60 minutes at 45℃ and 1000 rpm in the thermomixer.d.Centrifuge for 2 minutes ar 10,000 x g , then transfer the supernatant to a new 1.5-mL centrifugetube.e.Add 200 μL of Lysis Buffer, then vortex for 15 seconds.1Treat the samples with proteinase K and perform cell lysisVortex the Magnetic Particles until complete resuspension (approximately 5 seconds).a.Add 35 μL of Magnetic Particles to the sample.b.Vortex for 10 seconds at low speed.c.Add 350 μL of Binding Solution, then vortex for 5 seconds.d.Incubate for 10 minutes at room temperature shaking continuously.e.Vortex for 10 seconds at low speed, then place the tube in the DynaMag ™‑2 Magnet.f.Let the tube rest in the DynaMag ™‑2 Magnet until complete separation occurs (approximately 1-2minutes).g.Carefully discard the liquid phase without disturbing the Magnetic Particles pellet.2Bind the nucleic acid to the magnetic beadsa.Add 300 μL of Wash Solution to the tube, then vortex at medium speed for 5 seconds, or untilthe pellet is completely resuspended.b.Place the tube in the DynaMag ™‑2 Magnet, then let it rest for 30 seconds.c.Carefully discard the liquid phase without disturbing the Magnetic Particles pellet.d.Repeat the two last steps two more times.3Wash the nucleic acida.Air-dry the Magnetic Particles in the DynaMag ™‑2 Magnet with the lid open for 5 minutes.b.Add 50 μL of Elution Buffer.c.Close the lid, then vortex the tube at medium speed for 5 seconds.d.Incubate the tube for 5 minutes at 45℃.e.Vortex the tube at medium speed for 2 seconds, then place the tube in the DynaMag ™‑2 Magnet.f.Let the tube rest in the DynaMag ™‑2 Magnet for at least 1 minute.g.Transfer the liquid phase containing the total NA to a new tube for storage.4Elute the nucleic acid Isolate total nucleic acid from liquid samplesa.Place 250 μL of liquid sample in a 1.5-mL microcentrifuge tube.b.Add 50 μL of PK Buffer and 10 μL of Proteinase K, then vortex for 15 seconds.c.Incbate for 25 minutes at 45℃ and 1000 rpm in the thermomixer.d.Centrifuge for 2 minutes ar 10,000 x g , then transfer the supernatant to a new 1.5-mL centrifugetube.e.Add Lysis Buffer up to 500 μL of total volume, then vortex for 15 seconds.1Treat the samples with proteinase K and perform cell lysisVortex the Magnetic Particles until complete resuspension (approximately 5 seconds).a.Add 35 μL of Magnetic Particles to the sample.b.Vortex for 10 seconds at low speed.c.Add 350 μL of Binding Solution, then vortex for 5 seconds.d.Incubate for 10 minutes at room temperature shaking continuously.e.Vortex for 10 seconds at low speed, then place the tube in the DynaMag ™‑2 Magnet.f.Let the tube rest in the DynaMag ™‑2 Magnet until complete separation occurs (approximately 1-2minutes).g.Carefully discard the liquid phase without disturbing the Magnetic Particles pellet.2Bind the nucleic acid to the magnetic beadsa.Add 300 μL of Wash Solution to the tube, then vortex at medium speed for 5 seconds, or untilthe pellet is completely resuspended.b.Place the tube in the DynaMag ™‑2 Magnet, then let it rest for 30 seconds.c.Carefully discard the liquid phase without disturbing the Magnetic Particles pellet.d.Repeat the two last steps two more times.3Wash the nucleic acida.Air-dry the Magnetic Particles in the DynaMag ™‑2 Magnet with the lid open for 5 minutes.b.Add 50 μL of Elution Buffer.c.Close the lid, then vortex the tube at medium speed for 5 seconds.d.Incubate the tube for 5 minutes at 45℃.e.Vortex the tube at medium speed for 2 seconds, then place the tube in the DynaMag ™‑2 Magnet.f.Let the tube rest in the DynaMag ™‑2 Magnet for at least 1 minute.g.Transfer the liquid phase containing the total NA to a new tube for storage.4Elute the nucleic acid Isolate total nucleic acid from swab samples (manual method)a.Place the swab sample in a 1.5-mL microcentrifuge tube.b.Add 650 μL of Lysis Buffer, then vortex for 15 seconds.c.Incbate for 25 minutes at 45℃ and 1000 rpm in the thermomixer.d.Centrifuge for 2 minutes ar 10,000 x g , then transfer 500 μL of supernatant to a new 1.5-mLcentrifuge tube.1Perform cell lysis Vortex the Magnetic Particles until complete resuspension (approximately 5 seconds).a.Add 35 μL of Magnetic Particles to the sample.b.Vortex for 10 seconds at low speed.c.Add 350 μL of Binding Solution, then vortex for 5 seconds.d.Incubate for 10 minutes at room temperature shaking continuously.e.Vortex for 10 seconds at low speed, then place the tube in the DynaMag ™‑2 Magnet.f.Let the tube rest in the DynaMag ™‑2 Magnet until complete separation occurs (approximately 1-2minutes).g.Carefully discard the liquid phase without disturbing the Magnetic Particles pellet.2Bind the nucleic acid to the magnetic beadsa.Add 300 μL of Wash Solution to the tube, then vortex at medium speed for 5 seconds, or untilthe pellet is completely resuspended.b.Place the tube in the DynaMag ™‑2 Magnet, then let it rest for 30 seconds.c.Carefully discard the liquid phase without disturbing the Magnetic Particles pellet.d.Repeat the two last steps two more times.3Wash the nucleic acida.Air-dry the Magnetic Particles in the DynaMag ™‑2 Magnet with the lid open for 5 minutes.b.Add 50 μL of Elution Buffer.c.Close the lid, then vortex the tube at medium speed for 5 seconds.d.Incubate the tube for 5 minutes at 45℃.e.Vortex the tube at medium speed for 2 seconds, then place the tube in the DynaMag ™‑2 Magnet.4Elute the nucleic acid4Elute the nucleic acid (continued)f.Let the tube rest in the DynaMag™‑2 Magnet for at least 1 minute.g.Transfer the liquid phase containing the total NA to a new tube for storage.Isolate total nucleic acid from swab samples (automated method with the KingFisher™ mL Food Protection Purification System)For more information about using the KingFisher™ mL Food Protection Purification System, see Thermo Scientific™ KingFisher™ mL User Manual (Pub. No. 1508260).•Ensure that the PSNA_mL_300ul script has been downloaded from the product page and loadedonto the KingFisher™ mL Food Protection Purification System.•Ensure that a water bath or heating block is heated to 83°C.•Label the following consumables for each sample to be processed and the negative extractioncontrol:–One tube strip–Two 1.5‑mL microcentrifuge tubes (nuclease free)Note: Up to 14 samples and 1 negative extraction control can be processed at a time on theKingFisher™ mL Food Protection Purification System.1Before you beginVortex the Magnetic Particles until complete resuspension (approximately 5 seconds).a.For the number of required reactions, prepare the Binding Mix according to the following table:[1]Include 10% overage when making for multiple reactions.b.Invert the Binding Mix 5 times gently to mix, then add 700 µL to Tube A of each tube strip.Include tube strips for each sample and negative extraction control.Note: Remix the Binding Mix by inversion frequently during pipetting to ensure even distributionof beads to all samples or wells. The Binding Mix is viscous, so pipet slowly to ensure that thecorrect amount is added. DO NOT reuse pipette tips to add Binding Mix to the samples, as thehigh viscosity will cause variations in the volumes added.c.Add 300 µL of Wash Buffer to Tube B and 300 µL of Wash Buffer to Tube C of each tube strip.d.Add 100 µL of Elution Buffer to Tube D of each tube strip.e.Add 1 µL of Total RNA Control (Human) to Tube A of each tube strip.f.Vortex the swab sample tubes for 30 seconds.g.Add 300 µL of a sample to Tube A of the corresponding, pre‑labeled tube strip. Repeat for theremaining samples and tube strips.h.Add 300 µL of Nuclease-free Water (not DEPC-Treated) to Tube A of the Negative ExtractionControl tube strip.2Set up processing tubesa.Load the prepared tube strips into the tray, then place the tray in the KingFisher ™mL FoodProtection Purification System.b.Fully insert the tip combs into the tip comb slots.c.Select the PSNA_mL_300ul script, then press Start .d.When prompted by the instrument, remove the tube ‑strip tray from the instrument.e.For each tube strip, transfer the elution buffer (100 µL) from Tube D into one of thecorresponding pre ‑labeled microcentrifuge tubes.f.Cap the microcentrifuge tubes, then incubate at 83°C for 4 minutes.g.Transfer the elution buffer from each microcentrifuge tube back into Tube D of thecorresponding tube strip.h.Load the tube ‑strip tray into the instrument, then restart the run.i.After the run is complete, immediately remove the tube ‑strip tray from the instrument.j.For each tube strip, transfer the elution buffer (100 μL) from Tube D into the second pre ‑labeled microcentrifuge tube.Place the microcentrifuge tubes on ice for immediate use in real-time PCR. The extracted samples can be stored at -70°C for long ‑term storage (up to one year).3Process the samples on the instrumentLimited product warrantyLife Technologies Corporation and/or its affiliate(s) warrant their products as set forth in the Life Technologies' General Terms and Conditions of Sale at /us/en/home/global/terms-and-conditions.html . If you have any questions, please contact Life Technologies at /support .Life Technologies Ltd | 7 Kingsland Grange | Woolston, Warrington WA1 4SR | United KingdomFor descriptions of symbols on product labels or product documents, go to /symbols-definition .The information in this guide is subject to change without notice.DISCLAIMER : TO THE EXTENT ALLOWED BY LAW, THERMO FISHER SCIENTIFIC INC. AND/OR ITS AFFILIATE(S) WILL NOT BE LIABLE FOR SPECIAL, INCIDENTAL, INDIRECT,PUNITIVE, MULTIPLE, OR CONSEQUENTIAL DAMAGES IN CONNECTION WITH OR ARISING FROM THIS DOCUMENT, INCLUDING YOUR USE OF IT.Important Licensing Information : These products may be covered by one or more Limited Use Label Licenses. By use of these products, you accept the terms and conditions of all applicable Limited Use Label Licenses.©2020 Thermo Fisher Scientific Inc. All rights reserved. All trademarks are the property of Thermo Fisher Scientific and its subsidiaries unless otherwise specified. Thermomixer ™is a trademark of Eppendorf./support | /askaquestion 。
血清mrna提取方法
血清mrna提取方法英文回答:Serum mRNA extraction is a crucial step in many molecular biology experiments, as it allows researchers to analyze gene expression patterns in the blood. There are several methods available for extracting mRNA from serum samples, each with its own advantages and limitations.One commonly used method is the phenol-chloroform extraction method. This method involves the addition of phenol and chloroform to the serum sample, which helps to separate the different components of the sample. The phenol helps to denature proteins, while the chloroform helps to separate the aqueous and organic phases. After centrifugation, the mRNA is present in the aqueous phase and can be further purified using ethanol precipitation.Another method that is frequently used is the column-based RNA extraction method. This method utilizes a silica-based column that selectively binds RNA molecules, allowing for their purification from other cellular components. The serum sample is first lysed, and the RNA is bound to the column while contaminants are washed away. The purified RNA can then be eluted from the column and used for downstream applications.Both of these methods have their own advantages and disadvantages. The phenol-chloroform extraction method is relatively inexpensive and can yield high-quality RNA. However, it requires the use of hazardous chemicals and can be time-consuming. On the other hand, the column-based RNA extraction method is more user-friendly and less time-consuming. However, it can be more expensive and may not yield RNA of the same quality as the phenol-chloroform method.In summary, there are multiple methods available for serum mRNA extraction, including the phenol-chloroform extraction method and the column-based RNA extraction method. Each method has its own advantages and limitations, and the choice of method depends on factors such as cost,time, and desired RNA quality.中文回答:血清mRNA提取是许多分子生物学实验中的关键步骤,它使研究人员能够分析血液中基因表达模式。
利用CTAB_酸酚法提取棉花组织总RNA
收稿日期:2002-10-24;3联系人cotton @ 基金项目:国家重大基础研究发展规划项目(2002C B111301)作者简介:蒋建雄(1972—),男,博士后.利用CTAB Π酸酚法提取棉花组织总RNA蒋建雄,张天真3(南京农业大学作物遗传与种质创新国家重点实验室南京农业大学棉花研究所,南京210095)摘要:通过借鉴植物DNA 的CTAB 提取方法,结合总RNA 的LiCl 沉淀法,摸索出一套适合于棉花组织总RNA 提取和纯化的技术—CTAB Π酸酚法。
该方法与异硫氰酸胍法或冷酚法等相比具有更简便、得到的棉花组织总RNA 完整性好和纯度高等优点。
关键词:棉花;RNA 提取;CTAB Π酸酚法中图分类号:S562.035.3 文献标识码:A 文章编号:100227807(2003)0320166202Extraction of Total RNA in Cotton Tissues with CTAB 2acidic Phenolic MethodJ IAN G Jian 2xiong ,ZHAN G Tian 2zhen3(N ational Key L aboratory of Crop Genetics andGerm plasm Enhancement ,Cotton Research Insti 2t ute ,N anji ng A gricult ural U niversity ,N anji ng210095,Chi na )Abstract :Based on the CTAB extraction method for cotton total DNA and the LiCl precipitation method of RNA ,a new method suitable for cotton total RNA extraction ,named CTAB 2acidic pheon 2lic method ,was come into being.The method could produce cotton total RNA with higher purity and integrality in a shorter time from different tis 2sues of cotton than other conventional methods.K ey w ords :cotton ;RNA extraction ;CTAB 2acidic pheonlic method完整性好和纯度高的总RNA 是进行分子生物学研究的前提和基础。
响应面法优化火绒草中总黄酮与总酚酸的提取工艺研究
第32卷 第3期V o l .32 No .3草 地 学 报A C T A A G R E S T I A S I N I C A2024年 3月M a r . 2024d o i :10.11733/j.i s s n .1007-0435.2024.03.030引用格式:意如乐,格根图,王志军,等.响应面法优化火绒草中总黄酮与总酚酸的提取工艺研究[J ].草地学报,2024,32(3):935-944Y IR u -l e ,G EG e n -t u ,WA N GZ h i -j u n ,e t a l .S t u d y o n t h eE x t r a c t i o nP r o c e s s o fT o t a l F l a v o n o i d s a n dT o t a l P h e n o l i c A c i d s i n L e o n t o p o d i u m l e o n t o po d i o i d e s (W i l d .)B e a u v [J ].A c t aA g r e s t i aS i n i c a ,2024,32(3):935-944响应面法优化火绒草中总黄酮与总酚酸的提取工艺研究意如乐1,格根图1*,王志军1,胡日查2,百 岁2,塞西雅拉图3(1.内蒙古农业大学草原与资源环境学院,农业农村部饲草栽培㊁加工与高效利用重点实验室,内蒙古呼和浩特010019;2.克什克腾旗林业和草原局,内蒙古赤峰025300;3.克什克腾旗绿色驿站环境保护监测站,内蒙古赤峰025300)收稿日期:2023-09-19;修回日期:2023-11-26基金项目:财政部和农业农村部:国家牧草产业技术体系(C A R S -34)资助作者简介:意如乐(1999-),女,蒙古族,内蒙古赤峰人,硕士研究生,主要从事牧草加工与利用方向研究,E -m a i l :yi r u l e 1207@126.c o m ;*通信作者A u t h o r f o r c o r r e s p o n d e n c e ,E -m a i l :g e ge n t u @163.c o m 摘要:为探究野生火绒草(L e o n t o p o d i u m l e o n t o p o d i o i d e s (W i l d .)B e a u v )总黄酮与总酚酸最佳提取工艺及抗氧化活性,本试验采用快速溶剂萃取法探索萃取温度㊁循环次数㊁加热时间及萃取压力对火绒草总黄酮㊁总酚酸提取含量的影响,通过单因素试验和响应面设计法确定了活性物质的最佳提取工艺㊂结果表明:当使用70%乙醇提取火绒草中总黄酮时最佳提取工艺为:萃取温度93ħ,循环次数3次,加热时间20m i n ,萃取压力102b a r,提取含量为(45.45ʃ0.36)m g㊃g -1;总酚酸最佳提取工艺为:萃取温度90ħ,循环次数3次,加热时间19m i n ,萃取压力97b a r ,提取含量为(23.52ʃ0.34)m g ㊃g -1㊂火绒草总黄酮提取液对D P P H 自由基和A B T S 自由基的I C 50为0.012m g ㊃m L -1和0.356m g ㊃m L -1,具有一定的还原力㊂本研究可为火绒草活性物质的提取工艺及加工利用提供可靠的理论依据和详实的科学参考㊂关键词:火绒草;总黄酮;总酚酸;快速溶剂萃取;响应面法优化;抗氧化活性中图分类号:P 746.2+2 文献标识码:A 文章编号:1007-0435(2024)03-0935-10S t u d y on t h eE x t r a c t i o nP r o c e s s o fT o t a l F l a v o n o i d s a n dT o t a l P h e n o l i cA c i d s i n L e o n t o p o d i u m l e o n t o po d i o i d e s (W i l d .)B e a u v Y IR u -l e 1,G EG e n -t u 1*,WA N GZ h i -ju n 1,HU R i -c h a 2,B A I S u i 2,S A IX iY aL a -t u 3(1.K e y L a b o r a t o r y o fF o r a g eC u l t i v a t i o n ,P r o c e s s i n g a n dH i g hE f f i c i e n tU t i l i z a t i o no fM i n i s t r y o fA g r i c u l t u r e ,C o l l e ge of G r a s s l a n dR e s o u r c e s a n dE n v i r o n m e n t ,I n n e rM o ng o l i aA g r i c u l t u r a lU n i v e r s i t y ,H oh h o t ,I n n e rM o n g o li a 010019,C h i n a ;2.F o r e s t r y a n dG r a s s l a n dB u r e a uo fK e s h i k e t e n g B a n n e r ,C h i f e n g ,I n n e rM o n g o l i a 025300,C h i n a ;3.G r e e nS t a t i o n E n v i r o n m e n t a l P r o t e c t i o n M o n i t o r i n g S t a t i o no fK e s h i k e t e n g B a n n e r ,C h i f e n g ,I n n e rM o n g o l i a 025300,C h i n a )A b s t r a c t :I no r d e r t o e x p l o r e t h e o p t i m a l e x t r a c t i o n p r o c e s s a n d a n t i o x i d a n t a c t i v i t y of t o t a l f l a v o n o i d s a n d t o t a l p h e n o l i ca c i d si n w i l d L e o n t o p o d i u ml e o n t o po d i o i d e s ,t h ee f f e c t so fe x t r a c t i o nt e m p e r a t u r e ,c y c l e t i m e s ,h e a t i n g ti m e a n d e x t r a c t i o n p r e s s u r e o n t h e e x t r a c t i o nc o n t e n t o f t o t a l f l a v o n o i d s a n d t o t a l p h e n o l i c a c i d s i n L e o n t o p o d i u ml e o n t o po d i o i d e s w e r ee x p l o r e db y r a p i ds o l v e n t e x t r a c t i o n ,a n d t h eo p t i m a l e x t r a c -t i o n p r o c e s s o f a c t i v e s u b s t a n c e sw a s d e t e r m i n e db y t h e s i n g l e -f a c t o r e x p e r i m e n t a n d t h e r e s p o n s e s u r f a c e d e s i g n .T h e r e s u l t s s h o w e d t h a t t h e o pt i m a l e x t r a c t i o n p r o c e s s f o r t h e e x t r a c t i o no f t o t a l f l a v o n o i d s i n L e -o n t o p o d i u ml e o n t o po d i o i d e s u s i n g 70%e t h a n o lw a s 93ħe x t r a c t i o n t e m p e r a t u r e ,3t i m e s ,20m i n e x t r a c t i o n t i m e ,a n d 102b a r e x t r a c t i o n p r e s s u r e .E x t r a c t i o nc o n t e n tw a s (45.45ʃ0.36)m g ㊃g -1.T h eb e s t e x t r a c -t i o n p r o c e s s o f t o t a l p h e n o l i c a c i dw a s 90ħe x t r a c t i o nt e m pe r a t u r e ,3t i m e s ,19m i ne x t r a c t i o n ,a n d97b a r e x t r a c t i o n p r e s s u r e .E x t r a c t i o n c o n t e n tw a s (23.52ʃ0.34)m g ㊃g -1.T h e I C 50o f L e o n t o p o d i u m l e o n t o po -d i o i d e s t o t a l f l a v o n o i d e x t r a c t a g a i n s tD P P Hr a d i c a l s a n dA B T S r a d i c a l sw e r e 0.012m g㊃m L -1a n d 0.356草地学报第32卷m g㊃m L-1,r e s p e c t i v e l y.I t h a da c e r t a i nr e d u c i n gp o w e r.T h i s s t u d yp r o v i d e da r e l i a b l e t h e o r e t i c a l b a s i s a n dd e t a i l e d s c i e n t i f i c r e f e r e n c e f o r t h e e x t r a c t i o n p r o c e s s a n d p r o c e s s i n g a n du t i l i z a t i o no f t h e a c t i v e s u b-s t a n c e o f L e o n t o p o d i u ml e o n t o p o d i o i d e s.K e y w o r d s:L e o n t o p o d i u m l e o n t o p o d i o i d e s(W i l d.)B e a u v;T o t a l f l a v o n o i d s;T o t a l p h e n o l i c a c i d s;A c c e l e r a t e d s o l v e n t e x t r a c t i o n;R e s p o n s e s u r f a c em e t h o do p t i m i z a t i o n;A n t i o x i d a n t a c t i v i t y火绒草(L e o n t o p o d i u m l e o n t o p o d i o i d e s (W i l d.)B e a u v.)是菊科火绒草属(L e o n t o p o d i u m)多年生草本植物[1],广泛分布于世界各地,常见于欧洲和亚洲的寒带㊁温带和亚热带地区[2]㊂在我国约有41种火绒草属植物,主要分布于我国的东北㊁西北㊁华北和西南地区,其中有20多种在民间作为药用植物[3]㊂近年来有关火绒草化学成分及其药理活性研究较多,从火绒草属中发现了多种具有药理活性的化合物㊂如黄酮类㊁苯丙素类㊁葡萄糖二酸类等化合物[4-5]㊂现已将火绒草提取物用于治疗腹部疾病㊁心脏病㊁腹泻㊁痢疾㊁肺炎㊁扁桃体炎和各种癌症等多种人类和牲畜疾病,其中具有主要药理活性的成分是黄酮类及酚酸类物质[6-7],绿原酸和阿魏酸等成分具有明显抗氧化作用[8]㊂目前,人们通常使用热回流提取法㊁超声波辅助提取法㊁二氧化碳超临界流体萃取法等方法来萃取火绒草中的活性物质[9-10],但上述方法存在效率低㊁时间长㊁不环保等问题㊂本试验中使用的快速溶剂萃取法是一种新型提取技术,在高温高压条件下使用有机溶剂萃取固体或半固体样品的一种全自动萃取技术,具有成本低㊁萃取率高㊁萃取时间短㊁萃取纯度高㊁绿色环保等优点[11-12]㊂近年来,随着活性物质提取工艺的发展,该技术已逐渐应用到提取多酚㊁多糖类化合物当中[13]㊂孙海燕等[14]采用快速溶剂萃取法及正交试验对樱桃(P r u n u s p s e u d o c e r a s u s L i n d l.)核中类黄酮提取工艺进行优化;王国明等[15]研究发现使用快速溶剂萃取法萃取人参(P a n a x g i n s e n g C.A.M e y.)多糖得率高于传统的水提法㊂本研究以野生火绒草为原料,采用快速溶剂萃取法探究萃取时间㊁循环次数㊁加热时间及萃取压力等参数对总黄酮与总酚酸影响,通过响应面法对提取工艺进行优化,为火绒草开发利用提供详实的资料㊂1材料与方法1.1试验材料供试火绒草样品于2022年8月取自内蒙古自治区赤峰市克什克腾旗,经鉴定为菊科火绒草属长叶火绒草(L e o n t o p o d i u m j u n p e i a n u m K i t a m.),将样品阴干,用粉粹机磨成粉,过60目筛后备用㊂1.2供试品溶液制备精密称取火绒草3g,置于40m L萃取池中,加入一定量的石英砂,以70%乙醇作为提取溶剂,按一定条件进行萃取,过滤,用70%乙醇定容至50 m L,即得供试品溶剂,冷藏保存,备用㊂1.3总黄酮含量检测方法参照Z h i等[16-18]方法,稍作修改㊂取200μL不同浓度的芦丁对照品与40μL质量分数为5%的N a N O2溶液反应6m i n后加入40μL质量分数10%的A l(N O3)3溶液,放置6m i n,再加入400μL1m o l㊃L-1的N a O H和400μL的蒸馏水,摇匀,放置15m i n后,在510n m处测定吸光度㊂以质量浓度为横坐标,吸光度为纵坐标,构建标准曲线方程㊂得线性回归方程: y=5.9056x-0.0025R2=0.9994取200μL供试溶剂,按标准曲线方法检测供试溶剂总黄酮吸光度,参照公式计算出总黄酮含量㊂M=(CˑVˑn)/m式中M为黄酮含量,单位:m g㊃g-1;C为浓度,单位:m g㊃m L-1;V为体积,单位:m L;n为倍数;m为质量,单位:g㊂1.4总酚酸含量检测方法参照N a i d u等[19-20]方法,稍作修改㊂取200μL 不同浓度没食子酸标品与0.5m L F o l i n-C i o c a l t e u 试剂充分混匀,5m i n后加入1.5m L质量分数为20%的N a C O3溶液,蒸馏水定容至10m L,置于75ħ水浴中避光反应10m i n,在765n m处测定吸光度值㊂以质量浓度为横坐标,吸光度为纵坐标,构建标准曲线方程㊂得线性回归方程:y=49.229x+0.0075R2=0.9991取200μL供试溶剂,按标准曲线方法检测供试溶剂总酚酸吸光度,参照公式计算出总酚酸含量㊂M=(CˑVˑn)/m式中M为黄酮含量,单位:m g㊃g-1;C为浓度,单位:m g㊃m L-1;V为体积,单位:m L;n为倍数;m为质量,单位:g㊂639第3期意如乐等:响应面法优化火绒草中总黄酮与总酚酸的提取工艺研究1.5 抗氧化活性测定1.5.1 D P P H 自由基清除试验 参照W a n g 等[21]方法,取1.5m L 不同浓度的火绒草提取液(0.02,0.04,0.06,0.08,0.1m g ㊃mL -1)与0.75m L 的0.1m o l ㊃m L -1D P P H 溶液充分混匀,避光反应30m i n 后以无水乙醇作为空白在517n m 处测定吸光度,得A 1㊂取1.5m L 不同浓度的火绒草提取液与0.75m L 无水乙醇混匀,避光反应30m i n 后在517n m 处测定吸光度,得A 2㊂取1.5m L 无水乙醇与0.75m L 的0.1m o l ㊃m L -1D P P H 溶液混匀,避光反应30m i n 后在517n m 处测定吸光度,得A 0㊂以抗坏血酸作为阳性对照㊂根据吸光值计算D P P H清除率,并计算火绒草对D P P H 自由基的半数清除率I C 50㊂D P P H 自由基清除率%=[1-(A 1-A 2)/A 0]ˑ100%1.5.2 A B T S 自由基清除试验 参照L i a n g 等[22]方法,取3.9m L 的A B T S 反应液分别加入100μL 不同浓度的火绒草提取液(0.02,0.04,0.06,0.08,0.1m g ㊃m L -1)A 2或100μL 无水乙醇溶液A 1,避光反应30m i n 后,在734n m 处测定吸光值㊂以抗坏血酸作为阳性对照㊂根据吸光值计算A B T S 清除率,并计算火绒草对A B T S 自由基的I C 50㊂A B T S 自由基清除率%=[(A 1-A 2)/A 1)]ˑ100%1.5.3 总还原力测定试验 参照刘秀敏等[23]方法,稍作修改㊂取1m L 不同浓度的供试溶剂分别加入0.2m L 浓度为0.2m o l㊃L -1的磷酸盐缓冲溶液(p H6.6)和0.5m L 质量分数为5%的氢化钾,摇匀后置于50ħ水浴中反应20m i n ㊂反应结束后迅速冷却,加入1m L 质量分数为10%三氯乙酸后在5000r ㊃m i n -1下离心10m i n ,取1.5m L 上清液加入0.2m L 质量分数为1%的F e C l 3和3m L 蒸馏水静置10m i n 后在700n m 处测定吸光度,以抗坏血酸作为阳性对照㊂吸光值越大表示样品还原力越强㊂1.6 火绒草总黄酮、总酚酸提取的单因素试验采用快速溶剂萃取仪提取火绒草中总黄酮与总酚酸,主要考察萃取温度(45ħ,60ħ,75ħ,90ħ和105ħ)㊁循环次数(1,2,3,4和5次)㊁提取时间(5,10,15,20和25m i n )和萃取压力(80,90,100,110和120b a r )等4个因素对火绒草总黄酮和总酚酸提取率的影响㊂以萃取温度45ħ㊁循环一次㊁提取5m i n 和80b a r 设置为单因素基础条件,当研究某一因素时确定其他因素保持不变㊂所得提取液按照标准曲线方法测定吸光度,计算总黄酮与总酚酸含量㊂1.7 响应面试验优化火绒草总黄酮和总酚酸提取工艺基于B o x -B e n h n k e n 试验设计,综合单因素试验结果,固定萃取投料量3g ,以总黄酮和总酚酸含量为响应值,选择萃取温度(A )循环次数(B )提取时间(C )和萃取压力(D )为自变量,设计四因素三水平响应面优化试验,确定最佳提取工艺条件,验证最佳提取方法㊂方案如表1所示㊂表1 响应面试验因素与水平T a b l e 1 F a c t o r s a n d l e v e l s o f r e s po n s e s u r f a c e t e s t 水平L e v e l因素f a c t o rA 萃取温度E x t r a c t i o n t e m pe r a t u r e /ħB 循环次数C yc l e s C 时间T i m e /m i nD 萃取压力E x t r a c t i o n p r e s s u r e /b a r-1752159009032010011054251101.8 数据统计分析利用E x c e l 2016整理试验数据作表,利用O r i gi n2021软件作图,利用S P S S24软件进行方差分析,所有试验均重复3次利,用D e s i gi n -E x -pe r t 11软件进行响应面试验分析㊂P <0.05表示具有显著性差异,P <0.01表示具有极显著性差异㊂2 结果与分析2.1 提取火绒草总黄酮的单因素试验由图1可知,在萃取温度为45ħ~90ħ时,随着温度的增加提取含量随之上升,萃取温度为90ħ时提取含量最高;继续提高温度,总黄酮提取含量有所下降;在循环1~3次时,随着次数的增加提取含739草 地 学 报第32卷量有所上升,循环次数为3时提取含量最高,继续增加次数,总黄酮提取含量并没有得到增加,分析是火绒草在提取溶剂中的溶解度达到了饱和,不在溶出;在提取时间5~20m i n 时,随着时间的增加提取含量上升,15m i n 时提取含量达到最高值;在25m i n 后总黄酮提取含量有所下降;在萃取压力80~100b a r 时,随着压力的增加提取含量有所上升,在100b a r 时提取含量达到最高值,在120b a r 时总黄酮提取含量虽有上升趋势,但是没有超过最高值,在高温高压条件下黄酮类的结构可能发生变化,因此将75ħ~105ħ㊁2~4次㊁15~25m i n ㊁90~110b a r 设定为各因素考察范围㊂图1 火绒草总黄酮的单因素试验结果F i g .1 R e s u l t s o f a s i n g l e -f a c t o r t e s t o f t o t a l f l a v o n o i d s i n L e o n t o p o d i u m l e o n t o po d i o i d e s 2.2 提取火绒草总酚酸的单因素试验由图2可知,在90ħ时,提取含量达到最高,为20.63m g ㊃g -1;但温度达到105ħ时总酚酸提取含量有所下降;在循环1~3次时,随着次数的增加提取含量上升,但循环次数超过3时提取含量迅速下降;在提取5~15m i n 时,提取含量并没有明显上升,20m i n 后提取含量迅速上升,到达最高点;在萃取压力为80~100b a r 时,随着压力的增加提取含量有所上升,在100b a r 时提取含量达到最高值,之后下降㊂因此将75ħ~105ħ㊁2~4次㊁15~25m i n ㊁90~110b a r 设定为提取考察范围㊂839第3期意如乐等:响应面法优化火绒草中总黄酮与总酚酸的提取工艺研究图2 火绒草总酚酸的单因素试验结果F i g .2 R e s u l t s o f a s i n g l e f a c t o r t e s t o f t o t a l p h e n o l i c a c i d s i n L e o n t o p o d i u m l e o n t o po d i o i d e s 2.3 响应面试验优化分析2.3.1 响应面多元回归方程建立 以火绒草总黄酮与总酚酸的含量为响应值,采用四因素三水平的响应面试验设计得到最佳提取工艺参数,试验结果见表2,方差分析结果见表格3㊂对表2中响应面的结果进行了多元回归方程拟合,并获得以火绒草总黄酮含量和总酚酸含量为响应值的多元回归方程:Y 1=-337.35+1.32A+20.76B+4.49C+4.87D-0.07A B+0.001A C-0.002A D-0.0024B C-0.066B D-0.0067C D -0.0049A 2-1.37B 2-0.098C 2-0.021D 2,Y 2=-173.6+1.9442A+9.2442B +1.3468C +1.6664D-0.047A B -0.002A C -0.005A D+0.0395B C-0.005B D-0.003C D-0.007A 2-0.885B 2-0.026C 2-0.006D2㊂由表3可知,该模型极显著(P <0.01),失拟项不显著,R 2,R 2A d j,R 2P r e d 及变异系数均在可接受范围内,说明模型具有较高的拟合度和可信度,可较好的分析与预测火绒草的提取工艺条件;其中A ,B ,C 和BD 对总黄酮提取含量有显著影响(P <0.05),D ,A B ,A 2,B 2,C2和D 2对总黄酮提取含量有极显著影响(P <0.01);而A ,D ,A B ,A D ,及二次项A 2,B 2,C2和D 2对总酚酸含量均有极显著影响㊂各因素对总黄酮提取含量的影响从高到低为:压力>温度>循环次数>提取时间;各因素对总酚酸提取含量的影响从高到低为:压力>温度>提取时间>循环次数㊂939草 地 学 报第32卷表2 火绒草总黄酮、总酚酸提取工艺条件响应面优化方案及结果T a b l e 2 O p t i m i z a t i o n s c h e m e a n d r e s u l t s o f r e s p o n s e s u r f a c e o f t o t a l f l a v o n o i d s a n d t o t a l ph e n o l i c a c i de x t r a c t i o n p r o c e s s o f L e o n t o p o d i u m l e o n t o po d i o i d e s 试验号T e s t n u m b e rA :温度E x t r a c t i o nt e m pe r a t u r e /ħB :循环次数C y c l e s C :时间T i m e /m i n D :压力E x t r a c t i o n p r e s s u r e/b a rY 1总黄酮含量T o t a l f l a v o n o i d c o n t e n t /m g㊃g -1Y 2总酚酸含量T o t a l ph e n o l i c a c i d c o n t e n t /m g㊃g -11-1-1042.6320.1921-10044.5321.983-110043.6621.844110041.6420.79500-1-139.7322.546001-139.4822.79700-1143.1922.268001141.621.979-100-140.5720.3510100-142.6122.7511-100142.7321.1312100143.3520.46130-1-1042.2422.011401-1041.8121.57150-11041.8421.5616011040.9421.9117-10-1041.6721.231810-1042.8521.8419-101041.0421.0720101042.5721.14210-10-141.3222.4622010-142.0322.29230-10143.4721.9124010141.5521.5525000045.4423.4126000045.2223.1327000045.8723.7528000045.2623.67290046.0123.47表3 响应面回归模型方差分析T a b l e 3 R e s p o n s eR e g r e s s i o nm o d e l v a r i a n c e a n a l ys i s 方差来源S o u r c e平方和S u mo f s q u a r e s 自由度D F均方M e a ns qu a r e F 值P 值Y 1Y 2Y 1Y 2Y 1Y 2Y 1Y 2Y 1Y 2模型M o d e l81.325.4214145.811.8220.2723.05<0.0001<0.0001A -温度T e m p e r a t u r e 2.30.8269112.30.82698.0210.50.01330.0059B -循环次数C y c l e s 1.610.0021111.610.00215.630.02710.03250.8716C -时间T i m e 1.350.085111.350.0854.71.080.04790.3165D -压力P r e s s u r e 8.591.27118.591.2729.9616.09<0.00010.0013A B3.842.02113.842.0213.4125.60.00260.0002A C 0.03060.0729110.03060.07290.10690.92550.74860.3523A D 0.50412.36110.50412.361.7629.910.2059<0.0001B C 0.05520.156110.05520.1560.19271.980.66730.1811B D 1.730.009111.730.0096.040.11460.02770.74C D 0.44890.0729110.44890.07291.570.92550.23120.3523A 27.7415.51117.7415.5127.02196.920.0001<0.0001B 212.115.081112.115.0842.2664.51<0.0001<0.0001C 239.052.791139.052.79136.335.48<0.0001<0.0001D 229.152.221129.152.22101.7428.19<0.00010.0001残缺R e s i d u a l 4.011.114140.28650.0788失拟项L a c ko f f i t 3.490.866410100.34930.08662.691.470.1760.3798纯误差P u r e e r r o r 0.51860.2363440.12960.0591总误差C o r t o t a l85.3226.522828R 20.9530.9584R 2A d j 0.9060.9169R 2P r e d 0.7550.7979变异系数C V1.261.2849第3期意如乐等:响应面法优化火绒草中总黄酮与总酚酸的提取工艺研究2.3.2 响应面交互作用分析 如图3a ~3b 所示,循环次数不变时,总黄酮提取含量随着萃取温度的增加先呈上升后下降的趋势;当萃取温度不变时,总黄酮提取含量随着循环次数的增加同样先呈上升后下降的趋势㊂萃取温度与循环次数的等高线图呈椭圆状,说明两项之间的交互影响较强;从等高线图和三维图的倾斜度可知,萃取温度对总黄酮提取含量的影响大于循环次数㊂从图3c ~3d 可知,循环次数不变时,总黄酮提取含量随着萃取压力的增大先呈略上升后下降的趋势;当萃取压力不变时,总黄酮提取含量随着循环次数的增加先呈升高后略微下降的趋势㊂从等高线图和三维图的倾斜度可知,萃取压力对总黄酮提取含量的影响略大于循环次数㊂如图4a ~4b 所示,萃取温度不变时,总酚酸提取含量随着循环次数的增加呈上升后迅速下降趋势;当循环次数不变时,总酚酸提取含量随着萃取温度的增加先呈上升后略微下降趋势㊂从等高线图和三维图的倾斜度可知,萃取温度对总酚酸提取含量的影响大于循环次数㊂从图4c ~4d 可知,萃取温度不变时,总酚酸提取含量随着萃取压力的增大先呈略上升后下降的趋势;当萃取压力不变时,响应面值随着萃取温度的增加先呈升高后下降趋势㊂从等高线图和三维图的倾斜度可知,萃取压力对总酚酸提取含量的影响大于萃取温度㊂综上可知,结合模型结果和等高线得到提取总黄酮最佳工艺为:萃取温度92.62ħ,循环次数2.82次,提取时间19.66m i n ,萃取压力102.15b a r,总黄酮提取含量为45.92m g㊃g -1㊂根据实际情况,修改为萃取温度93ħ,循环次数3次,提取时间20m i n,萃取压力102b a r㊂总酚酸最佳提取工艺为:萃取温度93.117ħ,循环次数2.914次,提取时间19.72m i n,萃取压力95.963b a r ,总酚酸提取含量为23.582m g ㊃g -1㊂根据实际情况,修改为萃取温度93ħ,循环次数3次,提取时间20m i n ,萃取压力96b a r㊂在所得最佳提取工艺条件下进行3次平行验证试验,总黄酮提取含量为(45.45ʃ0.36)m g ㊃g -1,总酚酸提取含量为(23.52ʃ0.34)m g ㊃g -1,与模型得到的预测值相近,表明该模型优化参数稳定,且具有较高的可靠性㊂图3 各因素交互作用对总黄酮提取含量影响F i g.3 F a c t o r i n t e r a c t i v e e f f e c t s o n t h e c o n t e n t o f t o t a l f l a v o n o i de x t r a c t i o n 2.4 抗氧化活性研究2.4.1 火绒草总黄酮对D P P H 自由基的消除影响以抗坏血酸作为阳性对照,火绒草总黄酮对D P -P H 自由基的消除作用如图5所示,随着质量浓度的增加D P P H 自由基消除率持续上升,火绒草总黄酮质量浓度与D P P H 自由基清除率呈正相关作用,149草 地 学 报第32卷其I C 50为0.012m g ㊃m L -1㊂当火绒草质量浓度达到0.08m g㊃m L -1时消除率可达到80%以上㊂虽然低于抗坏血酸,但是对于D P P H 自由基,火绒草总黄酮表现出较好的消除作用㊂图4 各因素交互作用对总酚酸提取含量影响F i g .4 T h e e f f e c t s o f f a c t o r i n t e r a c t i o no n t h e e x t r a c t i o n c o n t e n t o f t o t a l ph e n o l i c a c i de x t r a c t i on 图5 火绒草对D P P H 的消除作用F i g .5 T h e e l i m i n a t i o ne f f e c t o f L e o n t o po d i u m l e o n t o po d i o i d e s o nD P P H 2.4.2 火绒草总黄酮对A B T S 自由基的消除影响以抗坏血酸作为阳性对照,火绒草总黄酮对A B T S 自由基的消除作用如图6所示,随着质量浓度的增加A B T S 自由基消除率呈缓慢上升的趋势,火绒草总黄酮质量浓度与A B T S 自由基清除率呈正相关作用,其I C 50为0.356m g ㊃m L -1㊂与相同浓度的抗坏血酸相比,火绒草总黄酮对A B T S 的清除率低于抗坏血酸㊂但也能表现出一定的消除能力㊂图6 火绒草对A B T S 的消除作用F i g.6 T h e e l i m i n a t i o ne f f e c t o f L e o n t o p o d i u m l e o n t o po d i o i d e s o nA B T S 2.4.3 火绒草总黄酮的总还原力 以抗坏血酸作为阳性对照,火绒草总黄酮的还原力如图7所示,随着质量浓度的增加吸光度呈上升的趋势,说明火绒249第3期意如乐等:响应面法优化火绒草中总黄酮与总酚酸的提取工艺研究草总黄酮质量浓度与总还原力呈正相关㊂虽然总还原力低于抗坏血酸,但还是能表现出具有一定的还原能力㊂图7 火绒草总还原力F i g .7 T o t a l r e d u c i n gp o w e r o f L e o n t o po d i u m l e o n t o po d i o i d e s 3 讨论本试验采用快速溶剂萃取法得出了火绒草中总黄酮与总酚酸的最佳提取工艺条件㊂快速溶剂萃取法是一种新兴的高压自动萃取技术[24],通过改变萃取温度㊁提取时间㊁循环次数以及萃取压力等因素来提高活性物质的提取率㊂C h u a n g 等[25]研究表明,与索式提取和热回流提取相比,快速溶剂萃取法是一种简单㊁有效㊁省时又先进的一项技术㊂王铎[26]分别采用超声提取㊁回流提取㊁温浸提取以及快速溶剂萃取四种方法对甘草(G l y c yr r h i z au r a l e n s i s F i s c h .)中的总黄酮进行了提取,结果表明快速溶剂萃取法对甘草中总黄酮的提取为最佳,平均总黄酮含量达到10.63m g ㊃g -1;C h a m a l i 等[27]探索出快速溶剂萃取法萃取桉树(E u c a l y pt u s s p p .)总酚酸的最佳提取方法为:提取温度179ħ㊁提取时间36m i n㊂而有关火绒草活性物质提取㊁纯化工艺方面的研究较少,本研究对火绒草总黄酮与总酚酸提取工艺优化进行了初步探索,为后续火绒草活性物质开发利用提供有效的技术支撑㊂本研究中火绒草总黄酮提取含量受萃取温度㊁萃取次数㊁加热时间和萃取压力的影响,其中提取时间的影响最小㊂唐巧玉等[28]研究使用快速溶剂萃取法提取水芹(O e n a n t h e ja v a n i c a (B l u m e )D C .)中总黄酮时得出提取时间对总黄酮提取含量的的影响较小㊂而吴桐[29]在研究中指出影响芦丁㊁金丝桃苷提取效果的因素顺序为提取温度>循环次数>提取压力>提取时间,这与本试验的结果有相同之处㊂原因可能是快速溶剂萃取法本身是一种快速提取的方法,大大节约了萃取时间,从而导致提取时间对提取率没有较大影响㊂刘叶等[30]采用单因素试验研究了快速溶剂萃取仪提取葡萄(V i t i s v i n i f e r a L .)籽中多酚物质的工艺并进行了正交试验优化,在文中指出影响提取含量的主要影响因素为提取时间其次是提取温度,提取压力的影响效果最小,与本试验结果存在差异,可能是因为本试验中萃取压力设置的水平之间差异较大,从而导致萃取压力对总酚酸提取含量影响较大㊂W a n g 等[31]在研究中提出随着温度㊁循环次数㊁提取时间和萃取压力的增加总酚酸含量有所上升,到达一定程度后又开始下降,在本试验结果中也存在这种现象,而这种现象可用快速溶剂萃取仪的基本原理来解释:高压的应用使萃取溶剂高于其沸点,并迫使溶剂扩散进入样品基质,而更高的温度使得溶剂具有更好的溶解能力和更低的粘度,并减弱样品与溶剂之间的相互作用,从而增加了传质,提高了萃取率[32-33]㊂本研究通过测定火绒草总黄酮提取液对D P -P H ㊁A B T S 自由基的消除率及总还原力来检测火绒草活性物质的抗氧化活性㊂D P P H 自由基在可见光范围内有特征吸收[34],A B T S 自由基会被抗氧化物抑制[35],因此都是测定抗氧化活性的重要指标㊂总还原力是测定潜在抗氧化活性的重要指标,其机理是通过样品将F e 3+还原成F e2+,中断自由基的链式反应[36]㊂展锐等[37]通过测定火绒草提取物的总还原力㊁羟自由基清除能力等比较了火绒草醇提物和水提物的抗氧化活性,结果表明,火绒草提物都具有较强的抗氧化活性,且醇提物的作用比水提物更有佳㊂吴楠贞等[3]研究发现火绒草醇提物有较强的抗氧化活性,这与本研究结果相似㊂综上所述,火绒草提取物可作为一种天然的抗氧化剂,有清除体内的自由基和抗脂质氧化等功能㊂4 结论本试验以火绒草为原料使用快速溶剂萃取法萃取火绒草中总黄酮与总酚酸,结果表明,总黄酮最佳提取方法为:萃取温度93ħ,循环次数3次,提取时间20m i n ,萃取压力102b a r;总酚酸最佳提取方法为:萃取温度93ħ,循环次数3次,提取时间20m i n ,萃取压力96b a r㊂验证试验结果表明,总黄酮提取含量为(45.45ʃ0.36)m g ㊃g -1,总酚酸提取含量为(23.52ʃ0.34)m g ㊃g -1,与模型拟合度高,可用于优化提取工艺㊂349草地学报第32卷本试验对火绒草总黄酮提取液进行了抗氧化活性研究,研究发现,火绒草总黄酮提取液对D P P H 自由基的I C50为0.012m g㊃m L-1;对A B T S自由基的I C50为0.356m g㊃m L-1;具有一定还原力,说明火绒草具有较好的抗氧化活性㊂参考文献[1]马晓玲,陈秋,夏提古丽,等.火绒草化学成分的分离与鉴定[J].沈阳药科大学学报,2018,35(9):729-732[2]李礼,张国刚,左甜甜,等.中药火绒草化学成分的研究(Ⅱ)[J].中南药学,2008(4):422-423[3]吴楠贞,展锐,苟萍.火绒草抗氧化活性成分及其结构分析[J].天然产物研究与开发,2013,25(3):296-301[4]肖阳央,苟萍,谢海辉.火绒草的苯丙素类成分[J].热带亚热带植物学报,2017,25(2):195-201[5]黄利权,伍义行.火绒草及火绒草属植物研究进展[J].中兽医医药杂志,2004(3):24-26[6] H O R N I C KA,S C HW A I G E R S,R O L L I N G E R JM,e t a l.E x t r a c t sa n dc o n s t i t u e n t s o f L e o n t o p o d i u m a l p i n u m e n h a n c e c h o l i n e r g i ct r a n s m i s s i o n:B r a i nA C h i n c r e a s i n g a n dm e m o r y i m p r o v i n gp r o p e r-t i e s[J].B i o c h e m i c a l P h a r m a c o l o g y,2008,76(2):236-248 [7]杨正明,地久此呷,兰建龙,等.基于U P L C指纹图谱及多成分含量测定的火草质量控制研究[J].中国中药杂志,2023,48(11):3000-3013[8]赵玥,张颖,王光函,等.基于抗氧化作用的火绒草药效物质基础研究[J].时珍国医国药,2021,32(8):1871-1873 [9]杨金部,袁桢燕,苟萍,等.火绒草种子萌发特性的研究[J].种子,2020,39(5):77-80[10]赵小燕,李波,杨正明,等.坚杆火绒草中总酚酸的提取及含量测定[J].中国实验方剂学杂志,2015,21(9):19-21 [11]潘春媛,武瑞,贾永全,等.火绒草乙醇提取物的化学成分研究[J].黑龙江八一农垦大学学报,2011,23(4):50-52[12]B O B I N A I TR,K R A U J A L I SP,T AMK U L,e t a l.R e c o v e r y o fb i o ac t i v e s u b s t a n c e sf r o m r o w a n b e r r yp o m a c eb y c o n s e c u t i v ee x t r a c t i o n w i t h s u p e r c r i t i c a lc a r b o n d i o x i d ea n d p r e s s u r i z e ds o l v e n t s[J].J o u r n a l o f I n d u s t r i a l a n dE n g i n e e r i n g C h e m i s t r y, 2020(85):152-160[13]闫佳佳,万璐,吴桐,等.快速溶剂萃取技术在2种食药用真菌多糖提取中的应用[J].中国农学通报,2021,37(16):150-155 [14]孙海燕.樱桃核中类黄酮快速溶剂萃取工艺优化及抗氧化研究[J].食品工业,2017,38(8):106-109[15]王国明,徐清华,徐芳菲,等.快速溶剂萃取仪提取人参多糖的工艺研究[J].人参研究,2019,31(6):2-6[16]Y I ZB,Y U Y,L I A N GYZ,e t a l.I n v i t r o a n t i o x i d a n t a n d a n-t i m i c r o b i a l a c t i v i t i e s o f t h e e x t r a c t o f P e r i c a r p i u mC i t r i R e t i c u-l a t a e o fa n e w C i t r u sc u l t i v a ra n di t s m a i nf l a v o n o i d s[J].L WT-F o o dS c i e n c e a n dT e c h n o l o g y,2008,41(4):597-603 [17]李红,李波,李晨阳,等.大孔树脂纯化苜蓿总黄酮及纯化前后抗氧化能力比较[J].草地学报,2022,30(3):750-757 [18]郝宁,张晓明,穆赢通,等.红三叶个体水平异黄酮含量的差异及其形态特征和草产量比较研究[J].草地学报,2023,31(1):196-201[19]N A I D U M M,S H Y AMA L ABN,N A I KJ P,e t a l.C h e m i c a lc o m p o s i t i o n a nd a n t i o x i d a n t a c t i v i t y o f t he h u s k a n d e n d o s p e r mo f f e n u g r e e ks e e d s[J].L WT-F o o dS c i e n c ea n d T e c h n o l o g y, 2011,44(2):451-456[20]陈誉华,魏元浩,吉慧敏,等.褐藻多酚提取物对奶牛瘤胃发酵性能及主要瘤胃细菌含量的影响[J].草地学报,2023,31(8): 2343-2351[21]WA N GSP,D O N GXF,T O N GJM.O p t i m i z a t i o no f e n z y m e-a s s i s t e de x t r a c t i o no f p o l y s a c c h a r i d e s f r o m a l f a l f aa n d i t sa n-t i o x i d a n t a c t i v i t y[J].I n t e r n a t i o n a l J o u r n a l o fB i o l o g i c a lM a c-r o m o l e c u l e s,2013(62):387-396[22]J I N GCL,D O N GXF,T O N GJM.O p t i m i z a t i o no fU l t r a s o n-i c-A s s i s t e dE x t r a c t i o n o f F l a v o n o i dC o m p o u n d s a n dA n t i o x i d a-n t s f r o m A l f a l f a U s i n g R e s p o n s eS u r f a c e M e t h o d[J].M o l e-c u l e s,2015,20(9):15550-15571[23]刘秀敏,单春会,张雪,等.超声波辅助提取红枣中黄酮类物质的研究[J].食品研究与开发,2021,42(17):107-113 [24]王慧颖,刘燕飞,张敬远,等.响应面法优化龙须菜多糖快速溶剂萃取提取工艺及其抗炎活性研究[J].食品工业科技,2023, 44(23):110-117[25]C HU A N G Y H,Z HA N G YJ,Z H A N G W,e t a l.C o m p a r i s o no f a c c e l e r a t e ds o l v e n te x t r a c t i o na n d q u i c k,e a s y,c h e a p,e f f e c-t i v e,r u g g e da n ds a f em e t h o df o re x t r a c t i o na n dd e t e r m i n a t i o n o f p h a r m a c e u t i c a l s i nv e g e t a b l e s[J].J o u r n a l o fC h r o m a t o g r a-p h y A,2015(1404):1-9[26]王铎.甘草中黄酮类化合物的分离提取及抗氧化活性评价研究[D].长春:长春师范学院,2011:16[27]S A O U S A NC,H O U C I N EB,J A L L O U LB,e t a l.O p t i m i z a t i o no f a c c e l e r a t e ds o l v e n te x t r a c t i o no fb i o a c t i v ec o m p o u n d s f r o mE u c a l y p t u s i n t e r t e x t au s i n g r e s p o n s e s u r f a c em e t h o d o l o g y a n de v a l u a t i o nof i t s p h e n o l i cc o m p o s i t i o na n db i o l og i c a l a c t i v i t i e s[J].J o u r n a l o fA p p l i e dR e s e a r c ho n M e d i c i n a l a n d A r o m a t i c P l a n t s,2023(35):100464[28]唐巧玉,周毅峰.快速溶剂萃取法提取水芹中总黄酮工艺研究[J].食品科学,2010,31(22):190-193[29]吴桐,徐慧春,郑春英,等.快速溶剂萃取法提取刺五加叶中的黄酮类成分[J].中国食品学报,2013,13(7):59-65 [30]刘叶,李华,郑亚蕾,等.快速溶剂萃取仪提取葡萄籽中多酚物质的工艺优化[J].食品工业科技,2015,36(18):244-247 [31]WA N GZR,B I N GY,X UHU I C,e t a l.O p t i m i z a t i o n a n d c o m-p a r i s o no fn o n c o n v e n t i o n a le x t r a c t i o nt e c h n i q u e sf o rs o l u b l e p h e n o l i cc o m p o u n d sf r o m b r o c a d eo r a n g e(C i t r u ss i n e n s i s) p e e l s.[J].J o u r n a l o f f o o d s c i e n c e,2022,87(11):4917-4929[32]T H I B A U L T L,E M I L I E D,E R I C L.S e l e c t i v ee x t r a c t i o no fb i o ac t i v e c o m p o u nd s f r o m p l a n t su s i n g re c e n t e x t r a c t i o nt e c h-n i q u e s:A r e v i e w[J].J o u r n a lo f C h r o m a t o g r a p h y A,2021 (1635):461770[33]S U N H,G EX,L I U Y,e t a l.A p p l i c a t i o n o f a c c e l e r a t e d s o l v e n te x t r a c t i o ni nt h ea n a l y s i so fo r g a n i cc o n t a m i n a n t s,b i o a c t i v ea n dn u t r i t i o n a lc o m p o u n d si nf o o da n df e e d[J].J o u r n a lo fC h r o m a t o g r a p h y A,2012(1237):1-23[34]许英一,王宇,杨伟光.紫花苜蓿叶总黄酮提取及抗氧化性[J].草地学报,2018,26(3):757-763[35]吴静,顾震,谢传奇,等.油茶果壳多糖纯化工艺及其抗氧化活性研究[J].食品工业,2023,44(11):72-76[36]黎侠,童健全,叶立红,等.菊属花茶活性物质含量及体外抗氧化活性的比较研究[J].浙江农业科学,2023,64(10):2521-2524 [37]展锐,库尔班,苟萍,等.火绒草提取物抗氧化活性的研究[J].食品科学,2010,31(3):153-159(责任编辑刘婷婷)449。
基因编辑类英语句子总结
1.In recent years, several endogenous Type I CRISPR–Cas systems, including I-A (18), I-B (19–21), and I-E (22), have been harnessed as an alternative strategy to study prokaryotic engineering in archaea and bacteria. For example, the native Type I-B system of Clostridium pasteurianum facilitated effcient genome editing of around 4 folds more than that of the heterologously expressed Cas9 system (20). Very recently, the Type I-E system of Lactobacillus crispatus has been exploited for genome editing including gene knockout, knockin and point mutation (22), which further highlighted the usefulness of native Type I CRISPR–Cas system for in situ genome modifcation. In addition, the Type I-B of Haloferax volcanii (23) and Type I-E of Escherichia coli (24,25) systems were harnessed for effcient repression of transcription upon Cas3 depletion. (引言TpyeI应用)They were identifed to be Type I effector-associated mature crRNAs produced by Cas6 homologues (42) as both of which possess the typical feature: an intact spacer sequence with an 8-nt repeat-derived handle and a 20-nt repeat sequence (the reminder) located at the 5 and 3 termini, respectively(引言crRNA结构Characterization and repurposing of the endogenous Type I-F CRISPR–Cas system of Zymomonas mobilis for genome engineering)2.Class I systems naturally occur in more than 90% of sequenced genomes of bacteria and archaea. Among them, the Type I systems, containing seven subtypes, i.e. I-A through I-F plus I-U are the most abundant, diverse and widespread in nature These systems encode the Cascade (CRISPR-associated complex for antiviral defense) complex to bind to a bona fde target (protospacer) upon PAM (protospacer adjacent motif) recognition, and subsequently recruit the featuring Cas3 nuclease–helicase to execute DNA cleavage .(引言,I型系统)3.Therefore, more readily useful high-throughput genetic engineering toolkits are needed for performing effective genome editing in Z. mobilis.(引言,基因工具开发)4.Small molecule secondary metabolites produced by plants, bacteria, and fungi have been an abundant source of pharmaceuticals; nearly half of the drugs approved by the U.S. Food and Drug Administration (FDA) from 1994 to 2008 were derived from natural products (Harvey, 2008).(引言,天然产物重要性)5.Effective tools to optimize the biosynthetic performance of target products in microbial fermentation systems are essential to achieve cost-efficient industrial production, and the development of such tools remains a long-standing challenge(讨论,工具重要性)6.The promoter kasOp* was previously demonstrated to xhibit stronger activity than the commonly used ermEp* in multiple treptomyces strains (W.S. Wang et al., 2013).(kasop 启动子)7.It has been widely used as a metabolic chassis for the production of diverse compounds(引言)8.。
- 1、下载文档前请自行甄别文档内容的完整性,平台不提供额外的编辑、内容补充、找答案等附加服务。
- 2、"仅部分预览"的文档,不可在线预览部分如存在完整性等问题,可反馈申请退款(可完整预览的文档不适用该条件!)。
- 3、如文档侵犯您的权益,请联系客服反馈,我们会尽快为您处理(人工客服工作时间:9:00-18:30)。
Extraction of total RNA and DNA from bacterioplankton (Molecular Microbial Ecology Manual - Chapter 1.2.2)S TEFAN E ICHLER, M ARKUS G. W EINBAUER†, K ATJA D OMINIK ANDM ANFRED G. HÖFLE*GBF-German Research Center for Biotechnology, Dept. Environmental Microbiology, Mascheroder Weg 1, D-38124 Braunschweig, Germany*corresponding authorTel.: +49-531-6181-419, Fax: +49-531-6181-411, E-mail: mho@gbf.de†present address:Laboratoire d'Océanographie de Villefranche-sur-mer, Diversity, Biogeochemistry and Microbial Ecology Group, Villefranche-sur-mer, FranceIntroductionRecent advances in microbial ecology have been relying on the utilization of modern tools of molecular biology. Application of molecular techniques to study microorganisms in their natural environments not only led to the identification of new and uncultured species but also advanced our knowledge of interactions in complex microbial communities. The majority of the applications usually relies on analytical methods that circumvent cultivation, addressing the general paradigm that only 1% or less of the cells of a natural microbial population can be cultured on growth media in the laboratory [1]. The modern methods rely on molecular analysis of microbial nucleic acids that are used for the identification of microorganisms and their activities in natural environments. However, a crucial point for applicability, efficiency and precision of these modern technologies, is the reliability of extraction methods to obtain nucleic acids from a given environmental source. Microbial ecologists may have to cope with inefficient extraction methods, resulting in under-representation or underestimation of the role of certain members in a microbial community. Applying RNA-based technologies, researchers have the ability to analyze gene-expression or to assess the active fraction of a microbial community. On the other hand, DNA-based methods give insights into general biodiversity, genetic potential or abundant members of whole communities. As a conclusion, to answer many of the questions arising in microbial ecology, it would be beneficial to perform both RNA- and DNA-based analyses on the same environmental sample, thus making it necessary to utilize methods for the simultaneous extraction of both types of nucleic acids.A variety of nucleic acid based application is available to microbial ecologists for the analysis of community structure: 5S rRNA fingerprinting [13, 14], hybridization of probes to bulk extracted DNA [17] or to individual cells [4, 1], generation of 16S rRNA geneclone libraries [12], and sequence specific separation of 16S rRNA gene fragments by denaturing gradient gel electrophoresis (DGGE) [19], temperature gradient gel electrophoresis (TGGE) [20] or single strand conformation polymorphism (SSCP) [26]. Most of these techniques employ as targets the small sub-unit of ribosomes and their genes. Bacterial RNA in a community may be linked to activity or growth due to synthesis of ribosomal RNA usually constituting about 80% of total cellular RNA [27]. Concentration of DNA on the other hand can serve as an indicator for the total cell number [28] or biomass [22] of the whole community. Investigations on functional relationships and bacterial gene expression in communities are primarily carried out using mRNA probes, Northern blotting and specific (RT)-PCR assays [23, 30]. For many of these methods, nucleic acids have to be extracted from cells before analyses can be performed. An ideal extraction method should fulfill at least the following three requirements: 1) the amount of extracted DNA or RNA should be high, 2) the extraction efficiency should be similar for different species and 3) the extracted nucleic acids should be pure and intact to allow for molecular biology studies. Stable extraction efficiency is essential in order to avoid under- or overrepresentation of DNA and RNA from different populations.In the following, we focus on the simultaneous extraction of RNA and DNA from water samples for molecular analysis. It was necessary to an extraction method that allows good extraction of RNA and DNA from any bacterial biomass. Extraction efficiency is a problem with every technique applied to nucleic acids from the environment containing a mixture of bacteria. The extraction method should be feasible for a wide range of cell numbers, independent from the type of microorganism and guarantee the integrity of the obtained nucleic acids for eventual molecular biological studies.Bacterioplankton represents the bacterial communities of the water column of lakes and oceans. It is, considering the size of the world’s oceans, the largest microbial community and of general importance for the carbon flux in aquatic ecosystems [7]. Therefore, bacterioplankton is a good example of a natural microbial community of high relevance. Although a variety of nucleic acid extraction methods has been described for bacterioplankton [22], most of these methods put emphasis on the quality of obtained nucleic acids for eventual molecular biology applications, whereas their extraction efficiencies have not been tested meticulously. Therefore, we employed the mechanical extraction method of D OMINIK and HÖFLE [5], that has been developed and optimized to extract low-molecular-weight (LMA) RNA, i.e. 5S rRNA and tRNA, and adapted the method utilizing a pH shift for the simultaneous extraction of both RNA and DNA from the same filter. The method presented here, qualifies by its speed and reproducibility. Up to 12 samples can be handled simultaneously. P ICHARD and P AUL [24] showed for Escherichia coli that only 11% of the total RNA was recovered by using GF/F filters, in contrast to Durapore filters with low RNA binding capacity, which enabled the recovery of 70% of total RNA. They also showed in previous studies [23] that the GF/F filters could be used if larger volumes (liters) of water were filtered. We placed a glassfiber filter (GF/F) on top of a 0.2 µm pore size polycarbonate membrane filter. The use of such a sandwich of filters results in an increased filtration time but also a much better defined size fraction than without the membrane filter. By combusting GF/F filters (3 h at 450°C) before use, the retention of extracted nucleic acids to the filter was minimized. Furthermore, we could show that the use of glassfiber filters in combination with combusted glass beads has the advantage that the cells are disrupted not only in a chemical way but also mechanically. This is also advantageous for Gram-positive bacteria or other bacteria with rigid cell walls.Finally, we were able to significantly increase the extraction efficiency by using sodium lauryl sarcosine (SLS) as detergent instead of sodium dodecyl sulfate (SDS).Various studies concerning RNA extraction efficiency deal only with cells of Escherichia coli [23] or Pseudomonas sp. [15]. High extraction efficiencies (64-87%) can be obtained from bacterial isolates and cultures using RNA specific extraction methods [23, 31]. For DNA specific extractions, efficiencies for marine bacterioplankton ranged from 23 to 54% using the method described by F UHRMAN et al. [11]. With the method described here, we were able to repeatedly obtain extraction efficiencies for RNA and DNA between 43 to 61% for Gram-negative bacteria and bacterioplankton from pond water samples or 25-30% for Gram-positive microorganisms [34]. The evaluation of our improved extraction method was performed with 4 representative bacterial species. For the assessment of applicability on environmental water samples, we included pond water as natural bacterioplankton source. The methodology has been rigorously examined by comparing and testing several extraction protocols: replacement of SLS/phenol with DivoLab/phenol, or utilization of two commercially available extraction kits, InstaPur or RNA/DNA isolator. The extraction efficiency for the strains and natural bacterioplankton was assessed after sonication by determining the total RNA or DNA content of the bacteria by using the method described by J EFFREY et al. [16] and SYBRGreen II as dye [32] and by determining the amount of isolated RNA or DNA using fluorescence spectrometer with specific fluorochromes [34].Calibration with pure culturesFor the assessment of RNA extraction efficiency, the following representatives for aquatic bacteria were used: For Betaproteobacteria, Ralstonia eutropha, for Gammaproteobacteria, Escherichia coli, Aeromonas hydrophila, Pseudomonas fluorescens, for Cytophaga-Flavobacterium-group, Flavobacterium johnsoniae, for the high G+C Gram-positive Actinobacteria, Arthrobacter globiformis,and for low G+C Gram-positive strains,Enterococcus faecalis and Bacillus megaterium [5]. Figure 1 shows the extraction efficiency of three different extraction techniques, assuming that the orcinol method [21], which is based on an acid hydrolysis of the RNA, represents 100%. Compared with orcinol digestion, the utilization of the modified protocol resulted in an increase of the extraction efficiencies for RNA for Gram-negative strains from generally less than 10% to more than 40%.For calibration purposes for the simultaneous extraction methodology, the extracted amount of RNA and DNA was compared with extraction independent measurements of the nucleic acid content of the samples using sonication. The strains used were representatives of the Betaproteobacteria (Ralstonia eutropha DSM 531T), the Gammaproteobacteria (Escherichia coli DSM 613), of the Cytophaga-Flavobacterium-group (Flavobacterium johnsoniae DSM 2064T) and the high G+C Gram-positive Actinobacteria bacteria (Arthrobacter globiformis DSM 20124T). All strains were grown on nutrient broth agar (NB; 8 g/liter; Difco Corp.), transferred, re-grown at 30°C in liquid NB medium and collected during exponential growth. Table 1 shows bacterial abundance of reference material and nucleic acid concentrations based on SYBRGreen II staining and RNase digestion of sonicated samples. All four different extraction techniques are independent of cell number and reproducible, each having different efficiencies, assuming that sonication represents 100% (Table 2). The extraction efficiencies for RNA and DNA were considerably higher using SLS/phenol or DivoLab/phenol than for InstaPur or the RNA/DNA isolator. With the modified mechanical extraction technique utilizing SLS/phenol, the efficiency for RNA and DNA was 30% and 25% for A. globiformis and averaged at 57% and 49% for the tested Gram-negative bacteria, respectively. Replacement of SLS by DivoLab resulted in similar extraction efficiencies, for RNA reaching 20% for A. globiformis and about 57% in Gram-negative bacteria, for DNA we obtained 20% and about 52% for Gram-positive and Gram-negative test strains, respectively. The performance of the two tested commercially available kits was considerably less efficientcompared to the mechanical extraction methods utilizing SLS/phenol or DivoLab/phenol. Using the modified mechanical extraction method, the extraction efficiency for Gram-positive bacteria is greatly improved, although still about half of that of Gram-negative strains. Considering environmental studies, we deduce that extraction efficiencies varied only moderately within Gram-negative bacteria and between Gram-positive bacteria. This finding is significant since we demonstrated by transmission electron microscopy of water samples from a eutrophic lake that all cells showed a Gram-negative cell wall. Thus it is possible to conclude that Gram-positive cells in the pelagial seem to be negligible since the majority consists of Gram-negative pelagic bacteria. However, our data also showed that we were able to obtain 25-30% of RNA and DNA from the Gram-positive A. globiformis, suggesting, that this method could also be used in ecosystems with a significant amount of Gram-positive bacteria such as sediments or soil. Comparing both presented calibration experiments, we found disparities in RNA extraction efficiencies. However, it has to be considered that the spectrophotometrical RNA quantification using orcinol is not as specific as the utilization of fluorescent dyes. Orcinol is not specific for RNA, but for pentose sugars and reacts with compounds such as uronic acids, xylose and uronic acids [33]. Bacteria may contain significant amounts of arabinose, xylose and uronic acids [3, 9]. This may result in an overestimation of bacterial RNA content and the lower extraction efficiencies when comparing orcinol method with the utilization of fluorescent dyes.Extraction of total RNA and DNA from aquatic microbial communitiesHarvesting of bacterial biomass from aquatic microbial communities is done by using a sandwich of two filters that consists of a glassfiber filter on top of a membrane filter with a pore size of 0.2 µm. A 1-liter sample of a eutrophic lake is sufficient to get 1 to 10 µg of RNAand 0.01 to 3 µg of DNA. For seawater we recommend to harvest the biomass of 3 to 5 l water on the sandwich. The filter can be stored in a deep freezer until extraction (-70°C).The extraction procedure starts with cutting the filter sandwich into small pieces with a scalpel. After extraction with SLS, phenol and glass beads, cell and filter debris and phenol are separated from the aqueous supernatant by centrifugation. The debris is re-extracted by adding fresh SLS and phenol. After combination of both aqueous fractions they are purified by chloroform extraction. The final aqueous supernatant is precipitated overnight with 1 volume of isopropanol (RNA) or ethanol and sodium acetate (DNA), washed and is then ready for nucleic acid determination using fluorometry (see below) or for molecular studies such as PCR amplification of 16S rRNA genes, reverse transcription amplification of 16S rRNA or functional genes, or for SSCP, DGGE and 5S rRNA fingerprinting. However, it has to be considered, that humic and fulvic substances may inhibit Taq polymerases [36, 37] and are occasionally a reason for problems encountered with PCR amplifications, particularly regarding DNA extracts. Therefore, we suggest to use dilutions of the obtained DNA extract or to include a follow-up purification step utilizing commercially available DNA purification systems (e.g. Wizard DNA Clean-Up System; Promega, Madison, USA) prior to PCR.ProceduresHarvesting the bacterial biomass from water samplesIt is highly recommended to process the water samples after collection as soon as possible, minimizing detrimental storage effects on structure and activity of the natural microbial community. Ideally, filtration should be completed within 1-2 h. Depending on temperature and amount of water sampled, several hours are stilltolerable, in particular at low temperature and large volumes. Samples can be collected by filtration of water using combusted glassfiber filters (Whatman GF/F). Notice, that combustion of filters for 3 h at 450°C prior to filtration is minimizing the retention effects of nucleic acids to the glassfiber during the extraction procedure, resulting in a significant higher yield in both DNA and RNA. Water samples can be collected in clean plastic containers. A prefiltration is recommended to remove protozoa and algae. Therefore, we recommend an initial prefiltration using nylon net (mesh size 10 µm) followed by an additional filtration step using a membrane filter (Nucleopore; pore size 1 µm or 3µm). Filtering the water sample or liquid culture medium through a filter sandwich collects the microorganisms in the fraction smaller than 1 µm or 3 µm. The filter sandwich consists of a glassfiber filter (Whatman GF/F; diameter 90 mm) on top of a membrane filter (Nucleopore; diameter 90 mm, 0.2 µm pore size) that is placed in a glass filter holder with a fritted glass base as support. Filtration is performed by applying a mild vacuum (not more than 200 mbar). After filtration the filter sandwich is removed, folded and wrapped in aluminum foil, and immediately stored in a freezer at –70°C for later extraction of nucleic acids.Supplies• Glassfiber filter (Whatman Corp., Maidstone, England; # 1825090 type GF/F;diameter 90 mm)• Membrane filter (Nucleopore Corp., Pleasanton, USA; # 603, # 601, and # 6002, for the pore sizes 3 µm, 1 µm and 0.2 µm, respectively, diameter 90 mm)• Filter holder (Schott, Hofheim, Germany; filter head # 247209003, filter disc # 2520901)Isolation of total DNA and RNA from microbial communitiesThe protocol (Figure 2) is based on a combined mechanical and chemical extraction method [14, 5] utilizing a pH shift for the simultaneous extraction of both RNA and DNA from an individual filter [34]. Wear gloves while working and take proper laboratory safety measures, i.e. work under a hood. Autoclave all pipette tips, microtubes, extraction cells and solutions (except SLS, phenol and chloroform) before use to avoid contamination with DNases, RNases or contaminant nucleic acids. The used plastic ware is provided sterilized. The glass beads should be combusted for 4 h at 450°C and then siliconized [8]. Make sure to wear safety glasses and protective gloves, since phenol is highly toxic and corrosive.Extraction and phase separation1. Transfer 2 g of 2-mm and 2 g of 3-mm siliconized glass beads in a Teflonextraction cell.2. Cut the frozen filter sandwich in short pieces with a scalpel and add them to theextraction cell.3. Add 5 ml of the Extraction buffer, pH4.2 (see below).4. Add 5 ml of buffer-saturated phenol pH 4.2 and vibrate the mixture for 2 min witha high-speed cell disrupter (amplitude 15 mm).5. Transfer the homogenate to a 50 ml Falcon tube.6. Mix thoroughly by vortexing the capped tube and centrifuge for 20 min at 7200 x gat 4°C.7. During centrifugation, the mixture separates into a lower phenol phase with glassbeads, an interphase, and an upper aqueous phase. RNA remains exclusively in the aqueous phase, whereas DNA is contained in the two lower phases. Transfer the aqueous phase to a fresh tube (Greiner, snap caps, volume 15 ml) andproceed below (8.). For DNA isolation, add 5 ml Tris-base (pH 10.5), mix well and store DNA-containing phenolic and inter-phase at 4°C for at least 40 min but not longer than 3 h (see DNA isolation section).8. Rinse the extraction cell once with 2 ml of Extraction buffer and add it to the 50mlFalcon tube. Also add 2 ml of buffer saturated phenol to the Falcon tube for repeated phenol extraction.9. Mix thoroughly by vortexing the capped tube and centrifuge again for 20 min at7200 x g at 4°C.10. Transfer the upper aqueous phase to the Greiner tube. The volume of thecombined aqueous phase is about 4 to 5 ml.RNA isolation1. Add 0.1 volumes of 3 M sodium acetate to the Greiner tube containing the pooledaqueous phase from the extraction and phase separation procedure.2. Add 5 ml of chloroform to the Greiner tube to remove phenol from the aqueousphase. Mix vigorously by vortexing and centrifuge for 10 min at 11000 x g at 4°C to separate the phases.3. Transfer the aqueous phase to a fresh Greiner tube and repeat the chloroformstep.4. Transfer the aqueous phase to another Greiner tube and add one volume ofisopropanol to precipitate the RNA. Mix the sample by vortexing and incubate samples at -20 °C overnight. The RNA can be stored in that form for a long time and eventually be pelleted for further analysis as detailed below.DNA isolation1. Mix the sample containing the extracted DNA vigorously by vortexing andcentrifuge for 15 min at 2000 x g and 4°C.2. Transfer upper aqueous phase to a fresh Greiner tube. Add 2 ml 1M Tris-base(pH 10.5) to the lower phenolic phase and repeat vortexing and centrifugation for15 min at 2000 x g and 4°C.3. Transfer and pool the upper aqueous phases from each centrifugation. Toremove phenol and proteins, add 5 ml chloroform-isoamyl alcohol (24:1) and centrifuge for 15 min at 2000 x g and 4°C.4. Transfer upper phase to a fresh Greiner tube and repeat the chloroform step untila clear upper phase is obtained.5. Add 90 µl 3 M sodium acetate, pH 4 and 2.5 volumes of ice cold 70% ethanol tothe now clear upper phase and precipitate the DNA over night at –20°C. The DNA precipitate should be processed the next day and eventually be pelleted for further fluorometrical analysis as detailed below.Solutions- Extraction buffer (per liter) (Used for the nucleic acid extraction mixture and the buffer-satured phenol)(50 mM sodium acetate, 10 mM EDTA)4.10 g sodium acetate (Riedel de Häen #32319 Seelze, Germany)3.72 g EDTA (Idranal III, Riedel de Häen #34549 Seelze, Germany)pH 4.2 (adjust with acetic acid)- Extraction mixture0.5 % sodium lauryl sarcosine, (SLS), (Sigma # 5125, Deisenhofen, Germany) inExtraction buffer(75 parts Extraction buffer plus 4 parts 10 % SLS-solution)- buffer saturated phenolMix 400 ml of phenol (Amresco # 0981 Solon, Ohio, USA) with 400 mg of 8-hydroxyquinoline and add 400 ml of Extraction buffer. Stir for 1 h. Allow the solution to form two phases and remove the aqueous phase. Add again 400 ml of fresh Extraction buffer to the phenol phase and repeat the procedure two more times. The final pH of the buffer saturated phenol should be about pH 4.2-4.4.Supplies• High-speed cell disrupter (Microdismembrator II, Braun Corp., Melsungen, Germany; #893162/4, amplitude, 15 mm)• Teflon extraction cell (Braun Corp., Melsungen, Germany; # 854495/6; volume 20 ml)• 2 and 3 mm combusted and siliconized glass beads• Falcon tubes (volume, 50 ml)• Greiner tubes (volume, 15 ml)• Eppendorf tubes (volume, 2 ml)• Eppendorf tubes (volume, 1.5 ml)• Microcentrifuge tube filters (Anapore, Whatman Corp., Maidstone, England; # 68300203, pore size 0.2 µm)Washing and resuspension of RNA and DNA1. Pellet the precipitated nucleic acids from both the isopropanol (for RNA) and thesodium acetate-ethanol precipitation (for DNA) by centrifuging 30 min at 19000 xg and 4°C.2. Wash the pellets twice with 1 ml of ice cold 70 % ethanol. Centrifuge at 19000 x gfor 10 min at 4°C. Prior to the second centrifugation, transfer the pellet to a microtube, centrifuge again at 19000 x g for 10 min at 4°C, and discard the supernatant.3. At the end of the procedure, dry the pellet for about 10 min by centrifugationunder vacuum (speed vac or desiccator). It is important not to let the pellet dry completely as this will greatly decrease its solubility.4. Dissolve the DNA or RNA in 300 µl (or less) of freshly autoclaved molecularbiology grade water (RNase and DNase free) or preferably in Tris-Ca buffer (pH7.5) by passing the solution a few times through a pipette tip. Incubate the samplefor at least 45 min at room temperature to dissolve the nucleic acids completely.The extracts should be stored frozen at –20°C or below.Solutions- Tris-Ca buffer (used for resuspension of nucleic acids)0.1 M NaCl0.1 M Tris pH 7.50.1324 g/l CaCl2•H2OFluorometric determination of RNA and DNA concentration and purityTypically the concentration of total nucleic acids is measured with dyes such as thiazole orange or ethidium homodimer and DNA concentrations are determined with the DNA specific fluorochrome Hoechst dye 33258 (H33258); RNA is determined by subtraction of the amount of DNA from that of the total nucleic acids (double fluorochrome method) [2]. Alternatively, DNA concentrations can be estimated after enzymatic digestion of RNA (RNase digestion method) [6, 18]. RNA concentrations can also be determined after DNA digestion (DNase digestion method). However, the development of novel green-fluorescent dyes is having a significant impact on the determination of RNA and DNA concentrations [32]. These dyes are potent tools for quantifying nucleic acids due to their high fluorescence yield upon binding to nucleic acids and their high specificity for nucleic acids. Prior to fluorescence spectroscopy of the RNA concentration utilizing RiboGreen fluorescent (Molecular Probes) and of the DNA concentration using the dye PicoGreen (Molecular Probes), we recommend to DNase or RNase digest the respective extracts to avoid contaminations with unwanted nucleic acid types.1. To inactivate contaminant DNase, it is necessary to boil the RNase for 15 min at100°C prior to digestion. Perform RNase (25 µg/ml final concentration) digestion in DNA samples at 37°C for 3 h in Tris-Ca buffer. For DNA digestion in RNA samples utilize DNase in a final concentration of 10-1000 units/ml at 37°C for 3 h in Tris-Ca buffer.2. To determine the RNA concentration in the sample, add 100 µl of a 1:200 dilutionof RiboGreen (RNA quantification kit; Molecular Probes) in Tris-Ca buffer to 100 µl samples. For assessment of the DNA concentration add 100 µl of a 1:200dilution of PicoGreen (dsDNA quantification kit; Molecular Probes) in Tris-Ca to 100 µl samples.3. Measure fluorescence using low-fluorescent 96-well microtiter plates (CytoPlate,Millipore) in a microtiter plate reader set at 475 nm excitation and 530 nm emission. Set up calibration curves using E. coli 16S + 23S rRNA provided along with the RiboGreen RNA quantification kit for RNA. As DNA calibration standard we suggest to use E. coli DNA (Sigma). RNA and DNA concentrations in the samples can be calculated by comparing the fluorescence results with the respective calibration standard. Notice, that it might be advantageous to assess the nucleic acid concentrations for the standards spectrophotometrically at 260 nm.4. Purity of RNA and DNA samples can be assessed spectrophotometrically. Theratio of absorbance at 260 nm and 280 nm should be around 2.0 (1.7–2.1). Lower values indicate contamination of the nucleic acids by proteins or polysaccharides.Notes2a. Alternatively, the RNA and DNA concentrations in the samples can be determined spectrophotometrically, by measuring the absorbance or optical density (OD) at 260 nm. An OD of 1.0 equals a concentration of 40 µg/ml RNA or50 µg/ml DNA.4a: It is much safer to run a spectrum (from 230 nm to 320 nm) of RNA and DNA from environmental samples. Even if the ratio of the absorbance at 260 nm to that at 280 nm is about 2.0 the spectrum often shows contaminations at 230-250 nm.The calculated amount of RNA should be considered only as an approximate value.Supplies• Low-fluorescent 96-well microtiter plates (CytoPlate, Millipore, Eschborn, Germany)• Cytofluor 2350 Fluorescence Measurement System (Millipore, Eschborn, Germany) or Fluoroscan II System (Titertek Fluoroscan plate reader; Flow Laboratories, Meckenheim, Germany)• RNA quantification kit (Molecular Probes, #R-11490; Leiden, The Netherlands) • dsDNA quantification kit (Molecular Probes, #P-7581; Leiden, The Netherlands) • Escherichia coli DNA (Sigma, Deisenhofen, Germany; #D-0421)• Ribonuclease A type III-A (Sigma, Deisenhofen, Germany; #R-5125)• DNase I from bovine pancreas, grade II (Boehringer, Mannheim, Germany, #104 159)Application of the methodEmploying the procedure described above, we obtained high quality extracts of nucleic acids from water samples that were collected from a pond [34]. Enumeration of bacterial cells was performed by epifluorescence microscopy [29]. Bacterial cell numbers for the GBF pond were 1.4 x 10¹⁰ cells/l, with 13.7 fg of RNA or 3.9 fg of DNA per cell (giving a ratio of 3.5) (Table 1). Extraction efficiencies for both RNA and DNA using the SLS/phenol method were about 60% for the pond community, a similar value compared with efficiencies obtained for Gram-negative bacteria during calibration experiments (Table 2).Community structure of bacterioplankton of the pond water was analyzed by SSCP fingerprinting of RT-PCR and PCR amplification products of 16S rRNA and of its。