Matlab 图像处理相关函数命令大全
MATLAB数字图像处理中的指令用法
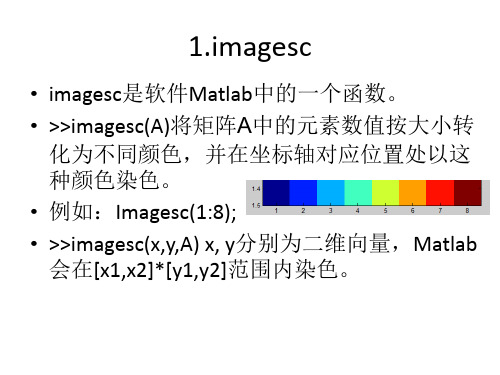
• • • • • •
imshow(BW)显示一张二值图像BW imshow(X,map)用指定的调色板来显示图像 imshow(RGB)显示一张真彩色图像RGB imshow(...,display_option) imshow(x,y,A,...) imshow filename
• • • •
• • • • •
13.meshgrid
• • • • • • • • • • • • • • 函数功能生成绘制3-D图形所需的网格数据。在计算机中进行绘图操作时, 往 往需要一些采样点,然后根据这些采样点来绘制出整个图形。在进行3-D绘图 操作时,涉及到x、y、z三组数据,而x、y这两组数据可以看做是在Oxy平面 内对坐标进行采样得到的坐标对(x, y)。 例如:画一个128*128,截止频率为15的理想滤波器 for u=1:128 for v=1:128 if sqrt((u-64)^2+(v-64)^2)<=15 H(u,v)=1; else H(u,v)=0; end end end imshow(H); [u,v]=freqspace(128,'meshgrid'); figure,mesh(u,v,H)
• matlab中,每个figure都有(而且仅有)一个colormap,翻 译过来就是色图。 • COLORMAP(MAP) 用MAP矩阵映射当前图形的色图。 • COLORMAP('default') 默认的设置是 JET. • MAP = COLORMAP 获得当前色图矩阵. • COLORMAP(AX,...) 应用色图到AX坐标对应的图形,而非当 前图形. • MAP实际上是一个mx3的矩阵,每一行的3个值都为0-1之 间数,分别代表颜色组成的rgb值,[1 0 0] 代表红色,[0 1 0]代表绿色,[0 0 1]代表蓝色。系统自带了一些colormap, 如:winter、autumn等。输入winter,就可以看到它是一 个64x3的矩阵。用户可以自定义自己的colormap,而且不 一定是64维的。
MATLAB操作命令大全
MATLAB操作命令大全1.基本操作:- clear: 清除工作区中的所有变量。
- clc: 清除命令窗口的内容。
- close all: 关闭所有图形窗口。
- help function-name: 显示与函数相关的帮助文档。
- who: 显示当前工作区中的所有变量。
- save file-name: 保存当前工作区中的所有变量到指定的文件。
- load file-name: 从文件中加载变量到当前工作区。
2.变量操作:-=:赋值操作符,将右边的值赋给左边的变量。
-+:加法操作符。
--:减法操作符。
-*:乘法操作符。
-/:除法操作符。
-^:幂运算操作符。
- sqrt(x): 计算 x 的平方根。
- abs(x): 计算 x 的绝对值。
- max(x): 返回 x 中的最大值。
- min(x): 返回 x 中的最小值。
- sum(x): 计算 x 中所有元素的和。
3.数组操作:- zeros(m, n): 创建一个 m 行 n 列的全零数组。
- ones(m, n): 创建一个 m 行 n 列的全一数组。
- eye(n): 创建一个 n 行 n 列的单位矩阵。
- size(x): 返回 x 的维度。
- length(x): 返回 x 的长度。
- reshape(x, m, n): 将 x 重新排列为一个 m 行 n 列矩阵。
- transpose(x): 将 x 的行和列互换。
4.控制流程:- if-else: 条件语句,根据条件执行不同的代码块。
- for loop: 循环语句,执行指定次数的代码块。
- while loop: 循环语句,根据条件反复执行代码块。
- break: 在循环中使用,用来跳出当前循环。
- continue: 在循环中使用,用来跳过当前循环的剩余部分。
5.统计分析:- mean(x): 计算 x 的平均值。
- median(x): 计算 x 的中位数。
- std(x): 计算 x 的标准差。
matlab的常用指令及其含义
matlab的常用指令及其含义1、清除命令窗口clc2、清除变量clear3、清除figureclf4、生成一个图层figure()figure(1)figure('name','实例')gwin=figure('MenuBar','none','NumberTitle','off','Name','菜单创建演示','Position',[(rect(3)-N)/2,(rect(4)-N)/2,N,N],'Resize','off','Color','red');5、打印disp(a)fprintf('the value of pi is%6.2f\n',pi)6、字符串和数字转换str2num(123)num2str('123')7、取整函数floor(2.3)==2 %为向下取整ceil(2.3)==3 %为向上取整round(2.3)==2 %为取最接近的整数fix(-3.5)==-3 %为向0取整8、复数运算temp = complex(1,2) %构造函数,==2+5ireal(temp) == 1 %返回实部imag(temp)==5 %返回虚部abs(temp)==5.3852 %返回模conj(temp)==2-5i %返回共轭复数9、快速生成矩阵A=zeros(5) %5行5列的0矩阵B=ones(5) %5行5列的1矩阵A=zeros(m,n) %m行n列0矩阵B=ones(m,n) %m行n列1矩阵A=eye(5) %5行5列的单位矩阵B=rand(3,5) %3行5列的0~1之间的随机矩阵A=magic(5) %5行5列的魔方矩阵,注意这里行和列必须相同10、生成随机矩阵rand(1,5) %生成一个1行5列的矩阵,即行向量11、求最大值max12、数据库结果转矩阵data_mat = cell2mat(data_cell);data_cell是数据库返回的结果,data_mat是矩阵13、求转置矩阵a=[1; 2; 3];b=a.'; %点+单引号b->{1 2 3}14、打印时间disp(datestr(datetime('now')));15、将矩阵转化为列向量,即列矩阵B=A(:); %A是矩阵16、读取矩阵取前N行或N列A(1:2,:) %读取矩阵A的1~2行A(:,1:3) %读取矩阵A的1~3列17、矩阵运算(加、减、乘、除、点乘、点除等)(1)A+B; 表示矩阵A和矩阵B相加(各个元素对应相加);(2)A-B; 表示矩阵A和矩阵B相减(各个元素对应相减);(3)A*B; 表示矩阵A和矩阵B相乘;(4)A.*B; 表示矩阵A和矩阵B对应元素相乘(点乘);(5)A/B; 表示矩阵A与矩阵B相除法;(6)A./B; 表示矩阵A和矩阵B对应元素相除(点除);(7)A^B; 表示矩阵A的B次幂;(8)A.^B; 表示矩阵A的每个元素的B次幂18、获取数组的行数和列数[rows,colums]=size(cell_data); %cell_data是2行3列的数组,rows==2 colums==319、获取数组的指定行和指定列first = cell_data(1,:); %第一行所有列first = cell_data(:,1); %第一列所有行。
(整理)数字图像处理MATLAB指令
其他常用的图像转换函数有:gray2ind函数,将灰度图像转换成索引图像。
Im2bw函数,将其它图像转化为二值图像。
Ind2gray函数,将索引图像转换成灰度图像。
Rgb2gray函数,将彩色图像转换成灰度图像。
1.利用imread( )函数读取一幅图像,存入一个数组中;2.利用whos 命令提取该读入图像flower.tif的基本信息;3.利用imshow()函数来显示这幅图像;函数执行语句A = imread('saturn.png');whosName Size Bytes Class AttributesA 1500x1200x3 5400000 uint8imshow(A)4.利用imfinfo函数来获取图像文件的压缩,颜色等等其他的详细信息;imfinfo('saturn.png')5.利用imwrite()函数来压缩这幅图象,将其保存为一幅压缩了像素的jpg 文件,设为flower.jpg;语法:imwrite(原图像,新图像,‘quality’,q), q取0-100。
imwrite(A,'xingxing.jpg','quality',25)B = imread('xingxing.jpg');6.同样利用imwrite()函数将最初读入的tif图象另存为一幅bmp图像,设为flower.bmp。
imwrite(A , 'xingxing.bmp')C = imread('xingxing.bmp');7.用im2bw将一幅灰度图像转化为二值图像,并且用imshow显示出来观察图像的特征。
F = imread('circbw.tif');im2bw(F)imshow(F)实验二图像直方图与灰度变换下面给出灰度变化的MATLAB程序f=imread('medicine_pic.jpg');g=imhist(f,256); %显示其直方图g1=imadjust(f,[0 1],[1 0]);%灰度转换,实现明暗转换(负片图像) figure,imshow(g1)g2=imadjust(f,[0.5 0.75],[0 1]);%将0.5到0.75的灰度级扩展到范围[0 1] figure,imshow(g2)g=imread('point.jpg');h=log(1+double(g));%对输入图像对数映射变换h=mat2gray(h); %将矩阵h转换为灰度图片h=im2uint8(h); %将灰度图转换为8位图figure,imshow(h)下面给出直方图均衡化增强图像对比度的MATLAB程序:I=imread(‘pollen.jpg); % 读入原图像J=histeq(I); %对原图像进行直方图均衡化处理Imshow(I); %显示原图像Title(‘原图像’); %给原图像加标题名Figure;imshow(J); %显示直方图均衡化后的图像Title(‘直方图均衡化后的图像’) ; %给直方图均衡化后的图像加标题名Figure; subplot(1,2,1) ;%对直方图均衡化后的图像进行屏幕控制;作一幅子图作为并排两幅图的第1幅图Imhist(I,64); %将原图像直方图显示为64级灰度Title(‘原图像直方图’) ; %给原图像直方图加标题名Subplot(1,2,2); %作第2幅子图Imhist(J,64) ; %将均衡化后图像的直方图显示为64级灰度Title(‘均衡变换后的直方图’) ; %给均衡化后图像直方图加标题名1、利用自己编写的灰度直方图计算程序计算rice.tif图像的直方图,并与系统自带的计算程序进行对比。
MATLAB 图像处理命令使用
MATLAB 图像处理命令使用1.MATLAB中图像处理的一些简单函数A、imreadimread函数用于读入各种图像文件,其一般的用法为[X,MAP]=imread(‘filename’,‘fmt’)其中,X,MAP分别为读出的图像数据和颜色表数据,fmt为图像的格式,filename为读取的图像文件(可以加上文件的路径)。
例:[X,MAP]=imread(’flowers.tif’,’tif’);比较读取二值图像,灰度图像,索引图像,彩色图像的X和MAP的特点,可以利用size 函数用来显示数组的维数,了解数据的特点。
B=size(a) 返回数组a 的维数。
B、imwriteimwrite函数用于输出图像,其语法格式为:imwrite(X,map,filename,fmt)imwrite(X,map,filename,fmt)按照fmt指定的格式将图像数据矩阵X和调色板map写入文件filename。
C、imfinfoimfinfo函数用于读取图像文件的有关信息,其语法格式为imfinfo(filename,fmt)imfinfo函数返回一个结构info,它反映了该图像的各方面信息,其主要数据包括:文件名(路径)、文件格式、文件格式版本号、文件的修改时间、文件的大小、文件的长度、文件的宽度、每个像素的位数、图像的类型等。
2.MATLAB中图像文件的显示imshowimshow函数是最常用的显示各种图像的函数,其语法如下:imshow(X,map)其中X是图像数据矩阵,map是其对应的颜色矩阵,若进行图像处理后不知道图像数据的值域可以用[]代替map。
(1)二进制(二值)图像显示方法,在MATLAB中一幅二值图像是uint8或双精度的,该矩阵仅包含0和1。
如果希望工具箱中的函数能将图像理解为二进制的,那么所有数据都要是逻辑数据,必须对其进行设置(将所有数据标志均设置on).可以对数据利用“~”取反操作实现图像逆转即黑白反色。
Matlab中图像处理常用函数的用法
Matlab中常见函数的用法1 size()函数1)s=size(A),当只有一个输出参数时,返回一个行向量,该行向量的第一个元素时矩阵的行数,第二个元素是矩阵的列数。
2)[r,c]=size(A),当有两个输出参数时,size函数将矩阵的行数返回到第一个输出变量r,将矩阵的列数返回到第二个输出变量c。
3)size(A,n)如果在size函数的输入参数中再添加一项n,并用1、2或者3为n赋值,则 size将返回矩阵的行数或列数。
其中r=size(A,1)该语句返回的时矩阵A的行数, c=size(A,2) 该语句返回的时矩阵A的列数。
如果A为一个二维数组,则可以将其看成一个第三维为1的数组,即size(A,3)的返回值为1。
2 padarray()函数B = padarray(A,padsize,padval,direction)A为输入图像,B为填充后的图像,padsize给出了给出了填充的行数和列数,通常用[r c]来表示。
padval和direction分别表示填充方法和方向。
它们的具体值和描述如下:Padval选项:'symmetric'表示图像大小通过围绕边界进行镜像反射来扩展;'replicate'表示图像大小通过复制外边界中的值来扩展;'circular'图像大小通过将图像看成是一个二维周期函数的一个周期来进行扩展。
Direction选项:'pre'表示在每一维的第一个元素前填充;'post'表示在每一维的最后一个元素后填充;'both'表示在每一维的第一个元素前和最后一个元素后填充,此项为默认值。
若参量中不包括direction,则默认值为'both';若参量中不包含padval,则默认用0来填充。
若参量中不包括任何参数,则默认填充为零且方向为'both'。
MATLAB图像处理函数大全
Matlab图像处理函数大全(一)图像增强1. 直方图均衡化的Matlab 实现1.1 imhist 函数功能:计算和显示图像的色彩直方图格式:imhist(I,n)imhist(X,map)说明:imhist(I,n) 其中,n 为指定的灰度级数目,缺省值为256;imhist(X,map) 就算和显示索引色图像X 的直方图,map 为调色板。
用stem(x,counts) 同样可以显示直方图。
1.2 imcontour 函数功能:显示图像的等灰度值图格式:imcontour(I,n),imcontour(I,v)说明:n 为灰度级的个数,v 是有用户指定所选的等灰度级向量。
1.3 imadjust 函数功能:通过直方图变换调整对比度格式:J=imadjust(I,[low high],[bottom top],gamma)newmap=imadjust(map,[low high],[bottom top],gamma)说明:J=imadjust(I,[low high],[bottom top],gamma) 其中,gamma 为校正量r,[low high] 为原图像中要变换的灰度范围,[bottom top] 指定了变换后的灰度范围;newmap=imadjust(map,[low high],[bottom top],gamma) 调整索引色图像的调色板map 。
此时若[low high] 和[bottom top] 都为2×3的矩阵,则分别调整R、G、B 3个分量。
1.4 histeq 函数功能:直方图均衡化格式:J=histeq(I,hgram)J=histeq(I,n)[J,T]=histeq(I,...)newmap=histeq(X,map,hgram)newmap=histeq(X,map)[new,T]=histeq(X,...)说明:J=histeq(I,hgram) 实现了所谓“直方图规定化”,即将原是图象I 的直方图变换成用户指定的向量hgram 。
matlab图像处理命令汇总
matlab图像处理命令汇总1.applylut (5)2.bestblk (5)3.blkproc (5)4.brighten (5)5.bwarea (5)6.bweuler. (6)7.bwfill (6)8.bwlabel (6)9.bwmorph (6)10.bwperim (7)11.bwselect (7)12.cmpermute (7)13.cmunique (8)14.col2im (8)15.colfilt (8)16.colorbar (8)17.conv2二维卷积操作. (9)18.convmtx2 (9)19.convn (9)20.corr2 (9)21.dct2 (9)22.dctmtx (10)23.dilate (10)24.dither (10)25.double (10)26.edge (11)27.erode (11)28.fft2 (12)29.fftn (12)30.fftshift (12)31.filter2 (13)32.freqspace (13)33.freqz2 (13)34.fsamp2 (13)35.fspecial (14)36.ftrans2 (14)37.fwind1 (14)38.fwind2 (15)39.getimage (15)40.gray2ind (15)41.grayslice (16)42.histeq (16)44.idct2 (17)45.ifft2 (17)46.ifftn (17)47.sim2bw (17)48.im2col (18)49.im2double (18)50.im2uint8 (18)51.im2uint16 (18)52.imadjust (19)53.imapprox (19)55.imcrop (20)56.imfeature (20)57.imfinfo (20)58.imhist (20)59.immovie (21)60.imnoise (21)61.impixel (21)63.imread (22)64.imresize (23)65.imrotate (23)66.imshow (23)67.imwrite (24)68.ind2gray (24)69.ind2rgb (24)70.iptgetpref (25)71.iptsetpref (25)72.iradon (25)73.isbw (25)74.isgray (26)75.isind (26)76.isrgb (26)77.makelut (26)78.mat2gray (26)79.mean2 (27)80.medfilt2 (27)81.montage (27)82.nlfilter (28)83.ntsc2rgb (28)84.ordfilt2 (28)85.phantom (28)86.pixval (29)87.qtdecomp (29)88.qtgetblk (29)90.radon (30)91.rgb2gray (30)92.rgb2hsv (30)93.rgb2ind (30)94.rgb2ntsc (31)95.rgb2ycbcr (31)96.rgbplot (31)97.roicolor (31)98.roifill (32)99.roifilt2 (32)100.roipoly (32)101.std2 (33)102.subimage (33)103.truesize (33)104.uint8 (34)105.uint16 (34)106.warp (34)107.wiener2 (34)108.ycbcr2rgb (35)109.zoom (35)110. fft2: (35)111.ifft2: (35)112. imnoise: (36)113. fspecial: (36)114.imhist (36)115.histeq (36)116.imadjust (36)117.log (36)118.filter2 (36)119. conv2 (37)120.medfilt2 (37)121. Sobel算子锐化图像 (37)122.利用拉氏算子锐化图像 (37)123. sobel算子图像边缘检测 (37)124.prewitt算子图像边缘检测 (37)125.roberts算子图像边缘检测 (38)126.log算子图像边缘检测 (38)127.canny算子图像边缘检测 (38)128.Zero-Cross算子图像边缘检测 (38)129. imdilate膨胀: (38)130.imerode执行腐蚀 (38)131. imopen开运算 (38)132. imclose闭运算 (38)133. imhist :计算和显示图像的色彩直方图 (39)134. imcontour :显示图像的等灰度值图 (39)135. imadjust :通过直方图变换调整对比度 (39)136. histeq :直方图均衡化 (39)137. imnoise 函数 (39)138.conv2 函数:计算二维卷积 (40)139. conv :计算多维卷积 (40)140.filter2:计算二维线型数字滤波,它与函数fspecial 连用 (40)141.fspecial :产生预定义滤波器 (40)142. imfilter:真彩色增强 (41)143. 离散傅立叶变换的Matlab 实现fft、fft2 和fftn (41)144.离散余弦变换的Matlab 实现dCT2 dict2 dctmtx (41)145. 图像小波变换的Matlab 实现dwt idwt wcodemat dwt2 wavedec2 idwt2 (42)146.图像处理工具箱 (44)147.MATLAB图像类型转换 (46)148.图像文件的读写和查询 (46)149. 图像文件的显示 (47)1.applylut功能: 在二进制图像中利用lookup表进行边沿操作. 语法: A = applylut(BW,lut)举例lut = makelut('sum(x(:)) == 4',2);BW1 = imread('text.tif');BW2 = applylut(BW1,lut);imshow(BW1)figure, imshow(BW2)2.bestblk功能: 确定进行块操作的块大小.语法: siz = bestblk([m n],k)[mb,nb] = bestblk([m n],k)3.blkproc功能: 实现图像的显式块操作.语法: B = blkproc(A,[m n],fun)B = blkproc(A,[m n],fun,P1,P2,...)B = blkproc(A,[m n],[mborder nborder],fun,...)B = blkproc(A,'indexed',...)举例I = imread('alumgrns.tif');I2 = blkproc(I,[8 8],'std2(x)*ones(size(x))');imshow(I)figure, imshow(I2,[]);相关命令:colfilt, nlfilter,inline4.brighten功能: 增加或降低颜色映像表的亮度.语法: brighten(beta)newmap = brighten(beta)newmap = brighten(map,beta)brighten(fig,beta)相关命令:imadjust, rgbplot5.bwarea功能: 计算二进制图像对象的面积.语法: total = bwarea(BW)举例BW = imread('circles.tif'); imshow(BW);bwarea(BW)ans =15799相关命令:bweuler, bwperim6.bweuler.功能: 计算二进制图像的欧拉数.语法: eul = bweuler(BW,n)相关命令:bwmorph, bwperim7.bwfill功能: 填充二进制图像的背景色.语法: BW2 = bwfill(BW1,c,r,n)BW2 = bwfill(BW1,n)[BW2,idx] = bwfill(...)BW2 = bwfill(x,y,BW1,xi,yi,n)[x,y,BW2,idx,xi,yi] = bwfill(...)BW2 = bwfill(BW1,'holes',n)[BW2,idx] = bwfill(BW1,'holes',n)8.bwlabel功能: 标注二进制图像中已连接的部分. 语法: L = bwlabel(BW,n)[L,num] = bwlabel(BW,n)相关命令:bweuler, bwselect9.bwmorph功能: 提取二进制图像的轮廓.语法: BW2 = bwmorph(BW1,operation) BW2 = bwmorph(BW1,operation,n)举例BW1 = imread('circles.tif');imshow(BW1);BW2 = bwmorph(BW1,'remove');BW3 = bwmorph(BW1,'skel',Inf);imshow(BW2)figure, imshow(BW3)相关命令:bweuler, bwperim, dilate, erode10.bwperim功能: 计算二进制图像中对象的周长. 语法: BW2 = bwperim(BW1,n)举例BW1 = imread('circbw.tif');BW2 = bwperim(BW1,8);imshow(BW1)figure, imshow(BW2)附录MATLAB图像处理命令325相关命令:bwarea, bweuler, bwfill11.bwselect功能: 在二进制图像中选择对象.语法: BW2 = bwselect(BW1,c,r,n)BW2 = bwselect(BW1,n)[BW2,idx] = bwselect(...)举例BW1 = imread('text.tif');c = [16 90 144];r = [85 197 247];BW2 = bwselect(BW1,c,r,4);imshow(BW1)figure, imshow(BW2)相关命令:bwfill, bwlabel, impixel, roipoly, roifill 12.cmpermute功能: 调整颜色映像表中的颜色.语法: [Y,newmap] = cmpermute(X,map) [Y,newmap] = cmpermute(X,map,index) 举例To order a colormap by luminance, use: ntsc = rgb2ntsc(map);[dum,index] = sort(ntsc(:,1));[Y,newmap] = cmpermute(X,map,index);相关命令:randperm13.cmunique功能: 查找颜色映像表中特定的颜色及相应的图像. 语法: [Y,newmap] = cmunique(X,map)[Y,newmap] = cmunique(RGB)[Y,newmap] = cmunique(I)相关命令:gray2ind, rgb2ind14.col2im功能: 将矩阵的列重新组织到块中.语法: A = col2im(B,[m n],[mm nn],block_type)A = col2im(B,[m n],[mm nn])相关命令:blkproc, colfilt, im2col, nlfilter15.colfilt功能: 利用列相关函数进行边沿操作.语法: B = colfilt(A,[m n],block_type,fun)B = colfilt(A,[m n],block_type,fun,P1,P2,...)B = colfilt(A,[m n],[mblock nblock],block_type,fun,...)B = colfilt(A,'indexed',...)相关命令:blkproc, col2im, im2col, nlfilter16.colorbar功能: 显示颜色条.语法: colorbar('vert')colorbar('horiz')colorbar(h)colorbarh = colorbar(...)举例I = imread('blood1.tif');h = fspecial('log');I2 = filter2(h,I);imshow(I2,[]), colormap(jet(64)), colorbar17.conv2二维卷积操作.功能: 进行二维卷积操作.语法: C = conv2(A,B)C = conv2(hcol,hrow,A)C = conv2(...,shape)相关命令:filter218.convmtx2功能: 计算二维卷积矩阵.语法: T = convmtx2(H,m,n)T = convmtx2(H,[m n])相关命令:conv219.convn功能: 计算n维卷积.语法: C = convn(A,B)C = convn(A,B,shape)相关命令:conv220.corr2功能: 计算两个矩阵的二维相关系数.附录MATLAB图像处理命令329语法: r = corr2(A,B)相关命令:std221.dct2功能: 进行二维离散余弦变换.语法: B = dct2(A)B = dct2(A,m,n)B = dct2(A,[m n])举例RGB = imread('autumn.tif');I = rgb2gray(RGB);J = dct2(I);imshow(log(abs(J)),[]), colormap(jet(64)), colorbarJ(abs(J) < 10) = 0;K = idct2(J)/255;imshow(K)相关命令:fft2, idct2, ifft222.dctmtx功能: 计算离散余弦变换矩阵.语法: D = dctmtx(n)相关命令:dct223.dilate功能: 放大二进制图像.语法: BW2 = dilate(BW1,SE)BW2 = dilate(BW1,SE,alg)BW2 = dilate(BW1,SE,...,n)举例BW1 = imread('text.tif');SE = ones(6,2);BW2 = dilate(BW1,SE);imshow(BW1)figure, imshow(BW2)相关命令:bwmorph, erode24.dither功能: 通过抖动增加外观颜色分辨率,转换图像. 语法: X = dither(RGB,map)BW = dither(I)相关命令:rgb2ind25.double功能: 转换数据为双精度型.语法:B = double(A)举例A = imread('saturn.tif');B = sqrt(double(A));相关命令:im2double, im2uint, uint826.edge功能: 识别强度图像中的边界.语法: BW = edge(I,'sobel')BW = edge(I,'sobel',thresh)BW = edge(I,'sobel',thresh,direction)[BW,thresh] = edge(I,'sobel',...)BW = edge(I,'prewitt')BW = edge(I,'prewitt',thresh)BW = edge(I,'prewitt',thresh,direction) [BW,thresh] = edge(I,'prewitt',...)BW = edge(I,'roberts')BW = edge(I,'roberts',thresh)[BW,thresh] = edge(I,'roberts',...)BW = edge(I,'log')BW = edge(I,'log',thresh)BW = edge(I,'log',thresh,sigma)[BW,threshold] = edge(I,'log',...)BW = edge(I,'zerocross',thresh,h)[BW,thresh] = edge(I,'zerocross',...)BW = edge(I,'canny')BW = edge(I,'canny',thresh)BW = edge(I,'canny',thresh,sigma)MATLAB高级应用——图形及影像处理332 [BW,threshold] = edge(I,'canny',...)举例I = imread('rice.tif');BW1 = edge(I,'prewitt');BW2 = edge(I,'canny');imshow(BW1);figure, imshow(BW2)27.erode功能: 弱化二进制图像的边界.语法:BW2 = erode(BW1,SE)BW2 = erode(BW1,SE,alg)BW2 = erode(BW1,SE,...,n)举例BW1 = imread('text.tif');SE = ones(3,1);BW2 = erode(BW1,SE);imshow(BW1)figure, imshow(BW2)相关命令:bwmorph, dilate附录MATLAB图像处理命令33328.fft2功能: 进行二维快速傅里叶变换.语法:B = fft2(A)B = fft2(A,m,n)举例load imdemos saturn2imshow(saturn2)B = fftshift(fft2(saturn2));imshow(log(abs(B)),[]), colormap(jet(64)), colorbar相关命令:dct2, fftshift, idct2, ifft229.fftn功能: 进行n维快速傅里叶变换.语法: B = fftn(A)B = fftn(A,siz)相关命令:fft2, ifftn30.fftshift功能: 把快速傅里叶变换的DC组件移到光谱中心. 语法:B = fftshift(A)举例B = fftn(A);C = fftshift(B);相关命令:fft2, fftn, ifftshift31.filter2功能: 进行二维线性过滤操作.语法: B = filter2(h,A)B = filter2(h,A,shape)相关命令:conv2, roifilt232.freqspace功能: 确定二维频率响应的频率空间.语法: [f1,f2] = freqspace(n)[f1,f2] = freqspace([m n])[x1,y1] = freqspace(...,'meshgrid')f = freqspace(N)f = freqspace(N,'whole')相关命令:fsamp2, fwind1, fwind233.freqz2功能: 计算二维频率响应.语法: [H,f1,f2] = freqz2(h,n1,n2)[H,f1,f2] = freqz2(h,[n2 n1])[H,f1,f2] = freqz2(h,f1,f2)[H,f1,f2] = freqz2(h)[...] = freqz2(h,...,[dx dy])[...] = freqz2(h,...,dx)freqz2(...)举例Hd = zeros(16,16);Hd(5:12,5:12) = 1;Hd(7:10,7:10) = 0;h = fwind1(Hd,bartlett(16));colormap(jet(64))freqz2(h,[32 32]); axis ([-1 1 -1 1 0 1]) 34.fsamp2功能: 用频率采样法设计二维FIR过滤器. 语法:h = fsamp2(Hd)h = fsamp2(f1,f2,Hd,[m n])举例[f1,f2] = freqspace(21,'meshgrid');Hd = ones(21);r = sqrt(f1.^2 + f2.^2);Hd((r0.5)) = 0;colormap(jet(64))mesh(f1,f2,Hd)相关命令:conv2, filter2, freqspace, ftrans2, fwind1, fwind2 35.fspecial功能: 创建预定义过滤器.语法:h = fspecial(type)h = fspecial(type,parameters)举例I = imread('saturn.tif');h = fspecial('unsharp',0.5);I2 = filter2(h,I)/255;imshow(I)figure, imshow(I2)相关命令:conv2, edge, filter2, fsamp2, fwind1, fwind236.ftrans2功能: 通过频率转换设计二维FIR过滤器.语法:h = ftrans2(b,t)h = ftrans2(b)举例colormap(jet(64))b = remez(10,[0 0.05 0.15 0.55 0.65 1],[0 0 1 1 0 0]); [H,w] = freqz(b,1,128,'whole');plot(w/pi-1,fftshift(abs(H)))相关命令:conv2, filter2, fsamp2, fwind1, fwind237.fwind1功能: 用一维窗口方法设计二维FIR过滤器.语法:h = fwind1(Hd,win)h = fwind1(Hd,win1,win2)h = fwind1(f1,f2,Hd,...)举例[f1,f2] = freqspace(21,'meshgrid');Hd = ones(21);r = sqrt(f1.^2 + f2.^2);Hd((r0.5)) = 0;colormap(jet(64))mesh(f1,f2,Hd)相关命令:conv2, filter2, fsamp2, freqspace, ftrans2, fwind2 38.fwind2功能: 用二维窗口方法设计二维FIR过滤器. 语法:h = fwind2(Hd,win)h = fwind2(f1,f2,Hd,win)举例[f1,f2] = freqspace(21,'meshgrid');Hd = ones(21);r = sqrt(f1.^2 + f2.^2);Hd((r0.5)) = 0;colormap(jet(64))mesh(f1,f2,Hd)相关命令:conv2, filter2, fsamp2, freqspace, ftrans2, fwind1 39.getimage功能: 从坐标轴取得图像数据.语法:A = getimage(h)[x,y,A] = getimage(h)[...,A,flag] = getimage(h)[...] = getimage举例imshow rice.tifI = getimage;40.gray2ind功能: 转换灰度图像为索引图像.语法:[X,map] = gray2ind(I,n)相关命令:ind2gray41.grayslice功能: 从灰度图像创建索引图像.语法:X = grayslice(I,n)X = grayslice(I,v)举例I = imread('ngc4024m.tif');X = grayslice(I,16);imshow(I)figure, imshow(X,jet(16))相关命令:gray2ind42.histeq功能: 用柱状图均等化增强对比.语法:J = histeq(I,hgram)J = histeq(I,n)[J,T] = histeq(I,...)举例I = imread('tire.tif');J = histeq(I);imshow(I)figure, imshow(J)imhist(I,64)figure; imhist(J,64)相关命令:brighten, imadjust, imhist43.hsv2rgb功能: 转换HSV值为RGB颜色空间.语法:rgbmap = hsv2rgb(hsvmap)RGB = hsv2rgb(HSV)相关命令:MATLAB高级应用——图形及影像处理340 rgb2hsv, rgbplot功能: 计算二维离散反余弦变换. 语法:B = idct2(A)B = idct2(A,m,n)B = idct2(A,[m n])相关命令:dct2, dctmtx, fft2, ifft245.ifft2功能: 计算二维快速傅里叶反变换. 语法:B = ifft2(A)B = ifft2(A,m,n)相关命令:fft2, fftshift, idct246.ifftn功能: 计算n维快速傅里叶反变换. 语法:B = ifftn(A)B = ifftn(A,siz)相关命令:fft2, fftn, ifft247.sim2bw功能: 转换图像为二进制图像.语法:BW = im2bw(I,level)BW = im2bw(X,map,level)BW = im2bw(RGB,level)举例load treesBW = im2bw(X,map,0.4);imshow(X,map)figure, imshow(BW)相关命令:ind2gray, rgb2gray功能: 重调图像,块为列.语法:B = im2col(A,[m n],block_type)B = im2col(A,[m n])B = im2col(A,'indexed',...)相关命令:blkproc, col2im, colfilt, nlfilter49.im2double功能: 转换图像矩阵为双精度型.语法:I2 = im2double(I1)RGB2 = im2double(RGB1)BW2 = im2double(BW1)X2 = im2double(X1,'indexed')相关命令:double, im2uint8, uint850.im2uint8功能: 转换图像阵列为8位无符号整型.语法:I2 = im2uint8(I1)RGB2 = im2uint8(RGB1)BW2 = im2uint8(BW1)X2 = im2uint8(X1,'indexed')MATLAB高级应用——图形及影像处理342相关命令:im2uint16, double, im2double, uint8, imapprox, uint16 51.im2uint16功能: 转换图像阵列为16位无符号整型.语法:I2 = im2uint16(I1)RGB2 = im2uint16(RGB1)X2 = im2uint16(X1,'indexed')相关命令:im2uint8, double, im2double, uint8, uint16, imapprox功能: 调整图像灰度值或颜色映像表.语法:J = imadjust(I,[low high],[bottom top],gamma) newmap = imadjust(map,[low high],[bottom top],gamma) RGB2 = imadjust(RGB1,...)举例I = imread('pout.tif');J = imadjust(I,[0.3 0.7],[]);imshow(I)figure, imshow(J)相关命令:brighten, histeq53.imapprox功能: 对索引图像进行近似处理.语法:[Y,newmap] = imapprox(X,map,n)附录MATLAB图像处理命令343[Y,newmap] = imapprox(X,map,tol)Y = imapprox(X,map,newmap)[...] = imapprox(...,dither_option)相关命令:cmunique, dither, rgb2ind54.imcontour功能: 创建图像数据的轮廓图.语法:imcontour(I,n)imcontour(I,v)imcontour(x,y,...)imcontour(...,LineSpec)[C,h] = imcontour(...)举例I = imread('ic.tif');imcontour(I,3)相关命令:clabel, contour, LineSpec55.imcrop功能: 剪切图像.语法: I2 = imcrop(I)X2 = imcrop(X,map)RGB2 = imcrop(RGB)I2 = imcrop(I,rect)X2 = imcrop(X,map,rect)RGB2 = imcrop(RGB,rect)MATLAB高级应用——图形及影像处理344 [...] = imcrop(x,y,...)[A,rect] = imcrop(...)[x,y,A,rect] = imcrop(...)举例I = imread('ic.tif');I2 = imcrop(I,[60 40 100 90]);imshow(I)figure, imshow(I2)相关命令:zoom56.imfeature功能: 计算图像区域的特征尺寸.语法:stats = imfeature(L,measurements)stats = imfeature(L,measu rements,n)相关命令:bwlabel57.imfinfo功能: 返回图形文件信息.语法:info = imfinfo(filename,fmt)info = imfinfo(filename)相关命令:imread, imwrite58.imhist功能: 显示图像数据的柱状图.语法: imhist(I,n)imhist(X,map)[counts,x] = imhist(...)举例I = imread('pout.tif');imhist(I)相关命令:histeq59.immovie功能: 创建多帧索引图的电影动画.语法: mov = immovie(X,map)举例load mrimov = immovie(D,map);相关命令:montage60.imnoise功能: 增加图像的渲染效果.语法: J = imnoise(I,type)J = imnoise(I,type,parameters)举例I = imread('eight.tif');J = imnoise(I,'salt & pepper',0.02);imshow(I)figure, imshow(J)相关命令:rand61.impixel功能: 确定像素颜色值.语法:MATLAB高级应用——图形及影像处理348 P = impixel(I)P = impixel(X,map)P = impixel(RGB)P = impixel(I,c,r)P = impixel(X,map,c,r)P = impixel(RGB,c,r)[c,r,P] = impixel(...)P = impixel(x,y,I,xi,yi)P = impixel(x,y,X,map,xi,yi)P = impixel(x,y,RGB,xi,yi)[xi,yi,P] = impixel(x,y,...)举例RGB = imread('flowers.tif');c = [12 146 410];r = [104 156 129];pixels = impixel(RGB,c,r)pixels =61 59 101253 240 0237 37 44相关命令:improfile, pixval62.improfile功能: 沿线段计算剖面图的像素值.语法:c = improfilec = improfile(n)c = improfile(I,xi,yi)c = improfile(I,xi,yi,n)[cx,cy,c] = improfile(...)[cx,cy,c,xi,yi] = improfile(...)[...] = improfile(x,y,I,xi,yi)[...] = improfile(x,y,I,xi,yi,n)[...] = improfile(...,method)举例I = imread('alumgrns.tif');x = [35 338 346 103];y = [253 250 17 148];improfile(I,x,y), grid on相关命令:impixel, pixval63.imread功能: 从图形文件中读取图像.语法:A = imread(filename,fmt)[X,map] = imread(filename,fmt)[...] = imread(filename)[...] = imread(...,idx) (TIFF only)[...] = imread(...,ref) (HDF only)[...] = imread(...,'BackgroundColor',BG) (PNG only)[A,map,alpha] = imread(...) (PNG only)举例[X,map] = imread('flowers.tif',6);info = imfinfo('skull.hdf');[X,map] = imread('skull.hdf',info(4).Reference); bg = [255 0 0];A = imread('image.png','BackgroundColor',bg); MATLAB高级应用——图形及影像处理350 [A,map,alpha] = imread('image.png');相关命令:imfinfo, imwrite,fread,double,uint8,uint16 64.imresize功能: 改变图像大小.语法:B = imresize(A,m,method)B = imresize(A,[mrows ncols],method)B = imresize(...,method,n)B = imresize(...,method,h)65.imrotate功能: 旋转图像.语法:B = imrotate(A,angle,method)B = imrotate(A,angle,method,'crop')举例I = imread('ic.tif');J = imrotate(I,-4,'bilinear' 'crop');imshow(I)figure, imshow(J)相关命令:imcrop, imresize66.imshow功能: 显示图像.语法:附录MATLAB图像处理命令351imshow(I,n)imshow(I,[low high])imshow(BW)imshow(X,map)imshow(RGB)imshow(...,display_option)imshow(x,y,A,...)imshow filenameh = imshow(...)相关命令:getimage, imread, iptgetpref, iptsetpref, subimage, truesize, warp 67.imwrite功能: 把图像写入图形文件中.语法:imwrite(A,filename,fmt)imwrite(X,map,filename,fmt)imwrite(...,filename)imwrite(...,Param1,Val1,Param2,Val2...)举例imwrite(X,map,'flowers.hdf','Compression','none',...'WriteMode','append')相关命令:imfinfo, imread68.ind2gray功能: 把检索图像转化为灰度图像.语法:I = ind2gray(X,map)举例load treesI = ind2gray(X,map);imshow(X,map)figure,imshow(I)MATLAB高级应用——图形及影像处理352相关命令:gray2ind, imshow, rgb2ntsc69.ind2rgb功能: 转化索引图像为RGB真彩图像.语法:RGB = ind2rgb(X,map)相关命令:ind2gray, rgb2ind70.iptgetpref功能: 获取图像处理工具箱参数设置. 语法:value = iptgetpref(prefname)举例value = iptgetpref('ImshowAxesVisible') value =off相关命令:imshow, iptsetpref71.iptsetpref功能: 设置图像处理工具箱参数.语法:iptsetpref(prefname,value)举例iptsetpref('ImshowBorder','tight')相关命令:imshow, iptgetpref, truesize72.iradon功能: 进行反Radon变换.语法:I = iradon(P,theta)I = iradon(P,theta,interp,filter,d,n)[I,h] = iradon(...)举例P = phantom(128);R = radon(P,0:179);I = iradon(R,0:179,'nearest','Hann'); imshow(P)figure, imshow(I)相关命令:radon, phantom73.isbw功能: 判断是否为二进制图像.语法:flag = isbw(A)相关命令:isind, isgray, isrgb74.isgray功能: 判断是否为灰度图像.语法:flag = isgray(A)相关命令:isbw, isind, isrgb75.isind功能: 判断是否为索引图像.语法:flag = isind(A)相关命令:isbw, isgray, isrgb76.isrgb功能: 判读是否为RGB真彩图像.语法:flag = isrgb(A)相关命令:isbw, isgray, isind77.makelut功能: 创建一个用于applylut函数的lookup表. 语法:lut = makelut(fun,n)lut = makelut(fun,n,P1,P2,...)相关命令:applylut78.mat2gray功能: 转化矩阵为灰度图像.语法:I = mat2gray(A,[amin amax])I = mat2gray(A)举例I = imread('rice.tif');J = filter2(fspecial('sobel'),I);K = mat2gray(J);imshow(I)figure, imshow(K)相关命令:gray2ind79.mean2功能: 计算矩阵元素的平均值.语法:b = mean2(A)相关命令:std2, mean, std80.medfilt2功能: 进行二维中值过滤.语法:MATLAB高级应用——图形及影像处理356 B = medfilt2(A,[m n])B = medfilt2(A)B = medfilt2(A,'indexed',...)举例I = imread('eight.tif');J = imnoise(I,'salt & pepper',0.02);K = medfilt2(J);imshow(J)figure, imshow(K)相关命令:filter2, ordfilt2, wiener281.montage功能: 在矩形框中同时显示多幅图像.语法:montage(I)montage(BW)montage(X,map)montage(RGB)h = montage(...)举例load mrimontage(D,map)相关命令:82.nlfilter功能: 进行边沿操作.语法:B = nlfilter(A,[m n],fun)B = nlfilter(A,[m n],fun,P1,P2,...)B = nlfilter(A,'indexed',...)举例B = nlfilter(A,[3 3],'median(x(:))');相关命令:blkproc, colfilt83.ntsc2rgb功能: 转换NTSC的值为RGB颜色空间.语法:rgbmap = ntsc2rgb(yiqmap)RGB = ntsc2rgb(YIQ)相关命令:rgb2ntsc, rgb2ind, ind2rgb, ind2gray84.ordfilt2功能: 进行二维统计顺序过滤.语法:B = ordfilt2(A,order,domain)B = ordfilt2(A,order,domain,S)MATLAB高级应用——图形及影像处理358 B = ordfilt2(...,padopt)相关命令:medfilt285.phantom功能: 产生一个头部幻影图像.语法:P = phantom(def,n)P = phantom(E,n)[P,E] = phantom(...)举例P = phantom('Modified Shepp-Logan',200); imshow(P)radon, iradon86.pixval功能: 显示图像像素信息.语法:pixval onpixval offpixvalpixval(fig,option)相关命令:impixel, improfile87.qtdecomp功能: 进行四叉树分解.语法:S = qtdecomp(I)S = qtdecomp(I,threshold)S = qtdecomp(I,threshold,mindim)S = qtdecomp(I,threshold,[mindim maxdim])S = qtdecomp(I,fun)S = qtdecomp(I,fun,P1,P2,...)88.qtgetblk功能: 获取四叉树分解中的块值.语法:[vals,r,c] = qtgetblk(I,S,dim)MATLAB高级应用——图形及影像处理360 [vals,idx] = qtgetblk(I,S,dim)相关命令:qtdecomp, qtsetblk89.qtsetblk功能: 设置四叉树分解中的块值.语法:J = qtsetblk(I,S,dim,vals)相关命令:qtdecomp, qtgetblk功能: 计算Radon变换.语法:R = radon(I,theta)R = radon(I,theta,n)[R,xp] = radon(...)举例iptsetpref('ImshowAxesVisible','on')I = zeros(100,100);I(25:75,25:75) = 1;theta = 0:180;[R,xp] = radon(I,theta);imshow(theta,xp,R,[]), colormap(hot), colorbar相关命令:iradon, phantom91.rgb2gray功能: 转换RGB图像或颜色映像表为灰度图像. 语法:I = rgb2gray(RGB)newmap = rgb2gray(map)相关命令:MATLAB高级应用——图形及影像处理362 ind2gray, ntsc2rgb, rgb2ind, rgb2ntsc92.rgb2hsv功能: 转化RGB值为HSV颜色空间.语法:hsvmap = rgb2hsv(rgbmap)HSV = rgb2hsv(RGB)相关命令:hsv2rgb, rgbplot93.rgb2ind功能: 转化RGB图像为索引图像.语法:[X,map] = rgb2ind(RGB,tol)[X,map] = rgb2ind(RGB,n)X = rgb2ind(RGB,map)[...] = rgb2ind(...,dither_option)举例RGB = imread('flowers.tif');[X,map] = rgb2ind(RGB,128);imshow(X,map)相关命令:cmunique, dither, imapprox, ind2rgb, rgb2gray 94.rgb2ntsc功能: 转化RGB的值为NTSC颜色空间. 语法:yiqmap = rgb2ntsc(rgbmap)YIQ = rgb2ntsc(RGB)相关命令:ntsc2rgb, rgb2ind, ind2rgb, ind2gray95.rgb2ycbcr功能: 转化RGB的值为YcbCr颜色空间. 语法:ycbcrmap = rgb2ycbcr(rgbmap)YCBCR = rgb2ycbcr(RGB)相关命令:ntsc2rgb, rgb2ntsc, ycbcr2rgb96.rgbplot功能: 划分颜色映像表.语法:rgbplot(map)举例rgbplot(jet)相关命令:colormap97.roicolor功能: 选择感兴趣的颜色区.语法:BW = roicolor(A,low,high)BW = roicolor(A,v)举例I = imread('rice.tif');BW = roicolor(I,128,255);imshow(I);figure, imshow(BW)相关命令:roifilt2, roipoly98.roifill功能: 在图像的任意区域中进行平滑插补. 语法:J = roifill(I,c,r)J = roifill(I)J = roifill(I,BW)[J,BW] = roifill(...)J = roifill(x,y,I,xi,yi)[x,y,J,BW,xi,yi] = roifill(...)举例I = imread('eight.tif');c = [222 272 300 270 221 194];r = [21 21 75 121 121 75];J = roifill(I,c,r);imshow(I)figure, imshow(J)相关命令:roifilt2, roipoly99.roifilt2功能: 过滤敏感区域.语法:J = roifilt2(h,I,BW)J = roifilt2(I,BW,fun)J = roifilt2(I,BW,fun,P1,P2,...)举例h = fspecial('unsharp');J = roifilt2(h,I,BW);imshow(J)相关命令:filter2, roipoly100.roipoly功能: 选择一个敏感的多边形区域.语法:BW = roipoly(I,c,r)BW = roipoly(I)BW = roipoly(x,y,I,xi,yi)[BW,xi,yi] = roipoly(...)[x,y,BW,xi,yi] = roipoly(...)举例I = imread('eight.tif');c = [222 272 300 270 221 194];r = [21 21 75 121 121 75];BW = roipoly(I,c,r);imshow(I)figure, imshow(BW)相关命令:roifilt2, roicolor, roifill101.std2功能: 计算矩阵元素的标准偏移. 语法:b = std2(A)相关命令:corr2, mean2102.subimage功能: 在一幅图中显示多个图像. 语法:subimage(X,map)subimage(I)subimage(BW)subimage(RGB)subimage(x,y,...)h = subimage(...)举例load trees[X2,map2] = imread('forest.tif'); subplot(1,2,1), subimage(X,map) subplot(1,2,2), subimage(X2,map2) 相关命令:附录MATLAB图像处理命令367 103.truesize功能: 调整图像显示尺寸.语法: truesize(fig,[mrows mcols])truesize(fig)相关命令:imshow, iptsetpref, iptgetpref104.uint8功能: 转换数据为8位无符号整型.语法:B = uint8(A)相关命令:double, im2double, im2uint8105.uint16功能: 转换数据为16位无符号整型.语法: I = uint16(X)相关命令:double, datatypes, uint8, uint32, int8, int16, int32. 106.warp功能: 将图像显示到纹理映射表面.语法:warp(X,map)warp(I,n)warp(BW)warp(RGB)warp(z,...)warp(x,y,z,...)h = warp(...)举例[x,y,z] = cylinder;I = imread('testpat1.tif');warp(x,y,z,I);相关命令:imshow107.wiener2功能: 进行二维适应性去噪过滤处理.语法:J = wiener2(I,[m n],noise)[J,noise] = wiener2(I,[m n])举例I = imread('saturn.tif');J = imnoise(I,'gaussian',0,0.005);K = wiener2(J,[5 5]);imshow(J)figure, imshow(K)相关命令:filter2, medfilt2108.ycbcr2rgb功能: 转化YcbCr值为RGB颜色空间.语法:rgbmap = ycbcr2rgb(ycbcrmap)RGB = ycbcr2rgb(YCBCR)相关命令:ntsc2rgb, rgb2ntsc, rgb2ycbcr109.zoom功能: 缩放图像.语法:zoom onzoom offzoom outzoom resetzoomzoom xonzoom yonzoom(factor)zoom(fig,option)相关命令:Imcrop110. fft2:fft2函数用于数字图像的二维傅立叶变换,如:i=imread('104_8.tif'); j=fft2(i);111.ifft2:ifft2函数用于数字图像的二维傅立叶反变换,如:i=imread('104_8.tif');j=fft2(i);k=ifft2(j);112. imnoise:用于对图像生成模拟噪声,如:i=imread('104_8.tif');j=imnoise(i,'gaussian',0,0.02);%模拟高斯噪声113. fspecial:用于产生预定义滤波器,如:h=fspecial('sobel');%sobel水平边缘增强滤波器h=fspecial('gaussian');%高斯低通滤波器h=fspecial('laplacian');%拉普拉斯滤波器h=fspecial('log');%高斯拉普拉斯(LoG)滤波器h=fspecial('average');%均值滤波器114.imhist函数用于数字图像的直方图显示,如:i=imread('104_8.tif');imhist(i);115.histeq函数用于数字图像的直方图均化,如:i=imread('104_8.tif');j=histeq(i);116.imadjust函数用于数字图像的对比度调整,如:i=imread('104_8.tif');j=imadjust(i,[0.3,0.7],[]);117.log函数用于数字图像的对数变换,如:i=imread('104_8.tif');j=double(i);k=log(j);118.filter2函数用于图像滤波,如:i=imread('104_8.tif');h=[1,2,1;0,0,0;-1,-2,-1];j=filter2(h,i);119. conv2线性滤波:利用二维卷积conv2滤波, 如: i=imread('104_8.tif');h=[1,1,1;1,1,1;1,1,1];h=h/9;j=conv2(i,h);120.medfilt2函数用于图像的中值滤波,如:i=imread('104_8.tif');j=medfilt2(i);121. Sobel算子锐化图像Sobel算子锐化图像, 如:i=imread('104_8.tif');h=[1,2,1;0,0,0;-1,-2,-1];%Sobel算子j=filter2(h,i);122.利用拉氏算子锐化图像i=imread('104_8.tif');j=double(i);h=[0,1,0;1,-4,0;0,1,0];%拉氏算子k=conv2(j,h,'same');m=j-k;123. sobel算子图像边缘检测i=imread('104_8.tif');j = edge(i,'sobel',thresh)124.prewitt算子图像边缘检测i=imread('104_8.tif');j = edge(i,'prewitt',thresh)。
matlab图像处理函数大全
matlab图像处理函数大全Matlab是一种强大的科学计算软件,广泛应用于各个领域,包括图像处理。
在Matlab中,有许多内置的图像处理函数,可以帮助我们实现各种图像处理任务。
本文将介绍一些常用的Matlab图像处理函数,帮助您更好地理解和运用这些函数。
1. imread函数imread函数用于读取图像文件,并将其存储为Matlab的图像矩阵。
它可以读取多种图像格式,如JPEG、PNG、BMP等。
例如,可以使用以下代码读取名为"image.jpg"的图像文件:```matlabimage = imread('image.jpg');```2. imshow函数imshow函数用于显示图像。
它可以接受一个图像矩阵作为输入,并将其显示在Matlab的图像窗口中。
例如,可以使用以下代码显示之前读取的图像:```matlabimshow(image);```3. imresize函数imresize函数用于调整图像的大小。
它可以接受一个图像矩阵和目标大小作为输入,并返回调整大小后的图像矩阵。
例如,可以使用以下代码将图像调整为200x200的大小:```matlabresized_image = imresize(image, [200, 200]);```4. rgb2gray函数rgb2gray函数用于将彩色图像转换为灰度图像。
它可以接受一个彩色图像矩阵作为输入,并返回一个灰度图像矩阵。
例如,可以使用以下代码将彩色图像转换为灰度图像:```matlabgray_image = rgb2gray(image);```5. imadjust函数imadjust函数用于调整图像的对比度和亮度。
它可以接受一个灰度图像矩阵和目标对比度和亮度范围作为输入,并返回调整后的图像矩阵。
例如,可以使用以下代码增加图像的对比度和亮度:```matlabadjusted_image = imadjust(gray_image, [0.2, 0.8], [0, 1]);```6. imfilter函数imfilter函数用于对图像进行滤波操作。
图像卷积、相关以及在MATLAB中的操作
图像卷积、相关以及在MATLAB中的操作图像卷积、相关以及在MATLAB中的操作2016年7⽉11⽇ 20:34:35, By ChrisZZ区分卷积和相关图像处理中常常需要⽤⼀个滤波器做空间滤波操作。
空间滤波操作有时候也被叫做卷积滤波,或者⼲脆叫卷积(离散的卷积,不是微积分⾥连续的卷积);滤波器也有很多名字:卷积模版、卷积核、掩模、窗⼝等。
空间滤波可以分为线性滤波和⾮线性滤波。
⾮线性滤波常见的有中值滤波、最⼤值滤波等,相当于⾃定义⼀个函数,在数学上由于不满⾜线性变换因此叫做⾮线性滤波。
这⾥不细研究它。
线性滤波则通常是:将模版覆盖区域内的元素,以模版中对应位置元素为权值,进⾏累加。
看起来挺简单的,但是要区分相关(cross-correlation)和卷积(convolution)两种模式。
为什么呢?因为在MATLAB⾥是有所区分的,⽽且不少中⽂书⾥⾯把它们混淆了。
我们最容易的理解是:将模版中元素从左到右、从上到下,作为使⽤顺序,那么卷积操作的结果,就是模版第⼀个元素乘以它覆盖的元素,加上模版第⼆个元素乘以它覆盖的元素,再加上模版第三个元素乘以它覆盖的元素,...,⼀直加到模版最后⼀个元素乘以它覆盖的元素。
好吧,其实就是:模版覆盖区域内,元素逐⼀相乘然后累加,此时的对应位置就是上下投影后被覆盖的位置。
上⾯这个理解确实是看起来最容易理解的,因⽽很多中⽂书把它叫做"卷积"。
然⽽这个概念其实叫做相关,⽽卷积则相当于:将同样的模版旋转180°后,再做"相关"操作。
当然,如果模版是180°对称的那么卷积和相关是相同的。
但是并不是所有的模版都对称。
因此,我建议,在滑窗操作、计算图像梯度等场合,不要使⽤“卷积”,⽽要使⽤“滤波”或者“相关”。
因为,我们通常讲的卷积,其实是相关,那就不要⽤卷积这个词以免引起混淆。
MATLAB下的操作在MATLAB中⽤imfilter来实现线性空间滤波:imfilter(f, w, filtering_mode, boundary_options, size_options)f:图像w:滤波模版filtering_mode:滤波模式'corr':相关滤波。
- 1、下载文档前请自行甄别文档内容的完整性,平台不提供额外的编辑、内容补充、找答案等附加服务。
- 2、"仅部分预览"的文档,不可在线预览部分如存在完整性等问题,可反馈申请退款(可完整预览的文档不适用该条件!)。
- 3、如文档侵犯您的权益,请联系客服反馈,我们会尽快为您处理(人工客服工作时间:9:00-18:30)。
Matlab 图像处理相关函数命令大全一、通用函数:colorbar 显示彩色条语法:colorbar \ colorbar('vert') \ colorbar('horiz') \ colorbar(h) \ h=colorbar(...) \colorbar(...,'peer',axes_handle)getimage 从坐标轴取得图像数据语法:A=getimage(h) \ [x,y,A]=getimage(h) \ [...,A,flag]=getimage(h) \ [...]=getimageimshow 显示图像语法:imshow(I,n) \ imshow(I,[low high]) \ imshow(BW) \ imshow(X,map) \ imshow(RGB)\ imshow(...,display_option) \ imshow(x,y,A,...) \ imshow filename \ h=imshow(...)montage 在矩形框中同时显示多幅图像语法:montage(I) \ montage(BW) \ montage(X,map) \ montage(RGB) \ h=montage(...)immovie 创建多帧索引图的电影动画语法:mov=immovie(X,map) \ mov=immovie(RGB)subimage 在一副图中显示多个图像语法:subimage(X,map) \ subimage(I) \ subimage(BW) \ subimage(RGB) \subimage(x,y,...) \ subimage(...)truesize 调整图像显示尺寸语法:truesize(fig,[mrows mcols]) \ truesize(fig)warp 将图像显示到纹理映射表面语法:warp(X,map) \ warp(I ,n) \ warp(z,...) warp(x,y,z,...) \ h=warp(...)zoom 缩放图像语法:zoom on \ zoom off \ zoom out \ zoom reset \ zoom \ zoom xon \ zoom yon\ zoom(factor) \ zoom(fig,option)二、图像文件I/O函数命令imfinfo 返回图形图像文件信息语法:info=imfinfo(filename,fmt) \ info=imfinfo(filename)imread 从图像文件中读取(载入)图像语法:A=imread(filename,fmt) \ [X,map]=imread(filename,fmt) \ [...]=imread(filename) \ [...]=imread(URL,...) \ [...]=imread(...,idx) (CUR,ICO,and TIFF only) \[...]=imread(...,'frames',idx) (GIF only) \ [...]=imread(...,ref) (HDF only) \[...]=imread(...,'BackgroundColor',BG) (PNG only) \ [A,map,alpha] =imread(...) (ICO,CUR,PNG only)imwrite 把图像写入(保存)图像文件中语法:imwrite(A,filename,fmt) \ imwrite(X,map,filename,fmt) \ imwrite(...,filename) \ imwite(...,Param1,Val1,Param2,Val2...)imcrop 剪切图像语法:I2=imcrop(I) \ X2=imcrop(X,map) \ RGB2=imcrop(RGB) \ I2=imcrop(I,rect) \X2=imcrop(RGB,rect) \ [...]=imcrop(x,y,...) \ [A,rect]=imcrop(...) \ [x,y,A,rect]=imcrop(...)imresize 改变图像大小语法:B=imresize(A,m,method)imrotate 旋转图像语法:B=imrotate(A,angle,method) \ B=imrotate(A,angle,method,'crop')三、像素和统计处理函数corr2 计算两个矩形的二维相关系数语法:r=corr2(A,B)imcontour 创建图像数据的轮廓图语法:imcontour(I,n) \ imcontour(I,v) \ imcontour(x,y,...) \ imcontour(...,LineSpec) \ [C,h] =imcontour(...)imfeature 计算图像区域的特征尺寸语法:stats=imfeature(L,measurements) \ stats=imfeature(L,measurements,n)imbist 显示图像数据的柱状图impixel 确定像素颜色值语法:P=impixel(I) \ P=impixel(X,map) \ P=impixel(RGB) \ P=impixel(I,c,r) \P=impixel(X,map,c,r) \ P=impixel(RGB,c,r) \ [c,r,P]=impixel(...) \ P=impixel(x,y,I,xi,yi) \ P=impixel(x,y,RGB,xi,yi) \ P=impixel(x,y,X,map,xi,yi) \[xi,yi,P]=impixel(x,y,...)improfile 沿线段计算剖面图的像素值语法:c=improfile \ c=improfile(n) \ c=improfile(I,xi,yi) \ c=improfile(I,xi,yi,n)\ [cx,cy,c]=improfile(...) \ [cx,cy,c,xi,yi]=improfile(...) \ [...]=improfile(x,y,I,xi,yi)\ [...]=improfile(x,y,I,xi,yi,n) \ [...]=improfile(...,method)mean2 计算矩阵元素的平均值语法:B=mean2(A)pixval 显示图像像素信息语法:pixval onstd2 计算矩阵元素的标准偏移语法:b=std2(A)四、图像分析函数:edge 图像边缘检测语法:BW=edge(I,'sobel') \ BW=edge(I,'sobel',thresh) \ BW=edge(I,'sobel',thresh,direction) \ [BW,thresh]=edge(I,'sobel',...) \ BW=edge(I,'prewitt') \ BW=edge(I,'prewitt',thresh) \BW=edge(I,'prewitt',thresh,direction) \[BW,thresh]=edge(I,'prewitt',...) \ BW=edge(I,'roberts') \ BW=edge(I,'roberts',thresh) \ [BW,thresh]=edge(I,'roberts',...) \ BW=edge(I,'log') \ BW=edge(I,'log',thresh) \BW=edge(I,'log',thresh,sigma) \ [BW,threshold]=edge(I,'log',...) \BW=edge(I,'zerocross',thresh,h) \ [BW,thresh]=edge(I,'zerocross',...) \BW=edge(I,'canny') \ BW=edge(I,'canny',thresh) \ BW=edge(I,'canny',thresh,sigma) \ [BW,threshold]=edge(I,'canny',...)qtgetblk 获取四叉树分解的块值语法:[vals,r,c]=qtgetblk(I,S,dim) \ [vals,idx]=qtgetblk(I,S,dim)qtsetblk 设置四叉树分解中的块值语法:J=qtsetblk(I,S,dim,vals)五、图像增强函数histeq 用柱状图均等化增强对比语法:J=histeq(I,hgram) \ J=histeq(I,n) \ [J,T]=histeq(I,...) \ newmap=histeq(X,map,hgram) \ newmap=histeq(X,map)imadjust 调整图像灰度值或颜色映像表语法:J=imadjust(I,[low_in ,high_in]),[low_out ,high_out],gamma) \newmap=imadjust(map,[low_in ,high_in]),[low_out ,high_out],gamma) \RGB2=imadjust(RGB1,...)imnoise 增强图像的渲染效果语法:J=imnoise(I,type) \ J=imnoise(I,type,parameters)medfilt2 进行二维中值过滤语法:B=medfilt2(A,[m n]) \ B=medfilt2(A) \ B=medfilt2(A,'indexed',...)ordfilt2 进行二维统计顺序过滤语法:B=ordfilt2(A,order,domain) \ B=ordfilt2(A,order,domain,S) \ B=ordfilt2(...,padopt)wiener2 进行二维适应性去噪过滤处理语法:J=wiener2(I,[m n],noise) \ [J,noise]=wiener2(I,[m n])六、线性滤波函数conv2 进行二维卷积操作语法:C=conv2(A,B) \ C=conv2(hcol,hrow,A) \ C=conv2(...,'shape')convmtx2 计算二维卷积矩阵语法:T=convmtx2(H,m,n) \ T=convmtx2(H,[m n])convn 计算n维卷积语法:C=convn(A,B) \ C=convn(A,B,'shape')filter2 进行二维线性过滤操作语法:Y=filter2(h,X) \ Y=filter2(h,X,shape)fspecial 创建预定义过滤器语法:h=fspecial(type) \ h=fspecial(type,parameters)七、线性二维滤波设计函数freqspace 确定二维频率响应的频率空间语法:[f1,f2]=freqspace(n) \ [f1,f2]=freqspace([m n]) \ [x1 ,y1]=freqspace(...,'meshgrid') \ f=freqspace(N) \ f=freqspace(N,'whole')freqz2 计算二维频率响应语法:[H,f1,f2]=freqz2(h,n1,n2) \ [H,fi,f2]]=freqz2(h,[n2,n1]) \ [H,fi,f2]]=freqz2(h,f1,f2]) \ [H,fi,f2]]=freqz2(h) \[...]=freqz2(h,...,[dx dy]) \ [...]=freqz2(h,...,dx) \ freqz2(...)fsamp2 用频率采样法设计二维FIR过滤器语法:h=fsamp2(Hd) \ h=fsamp2(f1,f2,Hd,[m n])ftrans2 通过频率转换设计二维FIR过滤器语法:h=ftrans2(b,t) \ h=ftrans2(b)fwind1 用一维窗口方法设计二维FIR过滤器语法:h=fwind1(Hd,win) \ h=fwind1(Hd,win1,win2) \ h=fwind1(f1,f2,Hd,...)fwind2 用二维窗口方法设计二维FIR过滤器语法:h=fwind2(Hd,win) \ h=fwind2(f1,f2,Hd,win)八、图像变换函数dct2 进行二维离散余弦变换(反余弦变换用idct2)语法:B=dct2(A) \ B=dct2(A,m.n) \ B=dct2(A,[m n])dctmtx 计算离散余弦傅立叶变换语法:D=dctmtx(n)fft2 进行二维快速傅立叶变换(反变换用ifft2)语法:Y=fft2(X) \ Y=fft2(X,m,n)fftn 进行n维快速傅立叶变换(反变换用ifftn)语法:Y=ffn(X) \ Y=fftn(X,siz)fftshift 快速傅立叶变换的DC组件移到光谱中心语法:Y=fftshift(X) \ Y=fftshift(X,dim)iradon 进行反radon变换语法:I=iradon(P,theta) \ I=iradon(P,theta,interp,filter,d,n) \ [I,h]=iradon(...)phantom 产生一个头部幻影图像语法:P=phantom(def,n) \ P=phantom(E,n) \ [P,E]=phantom(...)radon 计算radon变换语法:R=radon(I,theta) \ [R,xp]=radon(...)九、边沿和块处理函数bestblk 确定进行块操作的块大小语法:siz=bestblk([m n],k) \ [mb,nb]=bestblk([m n],k)blkproc 实现图像的显示块操作语法:B=blkproc(A,[m n]),fun) \ B=blkproc(A,[m n],fun,P1,P2,...) \ B=blkproc(A,[m n],[mborder nborder],fun,...)col2im 将矩阵的列重新组织到块中语法:A=col2im(B,[m n],[mm nn],block_type) \ A=col2im(B,[m n],[mm nn])colfilt 利用列相关函数进行边沿操作语法:B=colfilt(A,[m n],block_type,fun) \ B=colfilt(A,[m n],block_type,fun,P1,P2,...) \B=colfilt(A,[m n],[mblock nblock],...) \ B=colfilt(A,'indexed',...)im2col 重调图像块为列语法:B=im2col(A,[m n],block_type) \ B=im2col(A,[m n]) \ B=im2col(A,'indexed',...) nlfilter 进行边沿操作语法:B=nlfilter(A,[m n],fun) \ B=nlfilter(A,[m n],fun,P1,P2,...) \ B=nlfilter(A,'indexed',...)十、二进制图像操作函数applylut 在二进制图像中利用lookup表进行行边沿操作语法:A=applylut(BW,LUT)bwarea 计算二进制图像对象的面积语法:total=bwarea(BW)bweuler 计算二进制图像的欧拉数语法:eul=bweuler(BW)bwfill 填充二进制图像的背景色语法:BW2=bwfill(BW1,c,r,n) \ BW2=bwfill(BW1,n) \ [BW2,idx]=bwfill(...) \BW2=bwfill(x,y,BW1,xi,yi,n) \ [x,y,BW2,idx,xi,yi]=bwfill(...)\ [BW2,idx]=bwfill(BW1,'holes',n)bwlabel 标注二进制图像中已连接的部分语法:L=bwlabel(BW,n) \ [L,num]=bwlabel(BW,n)bwmorph 提取二进制图像的轮廓语法:BW2=bwmorph(BW1,operation) \ BW2=bwmorph(BW1,operation,n)bwperim 计算二进制图像中对象的周长语法:BW2=bwperim(BW1) \ BW2=bwperim(BW1,CONN)bwselect 在二进制图像中选择对象语法:BW2=bwselect(BW1,c,r,n) \ BW2=bwselect(BW1,n) \ [BW2,idx]=bwselect(...) \ BW2=bwselect(x,y,BW1,xi,yi,n) \ [x,y,BW2,idx,xi,yi]=bwselect(...)dilate 放大二进制图像语法:BW2=dilate(BW1,SE) \ BW2=dilate(BW1,SE,alg) \ BW2=dilate(BW1,SE,...,n)erode 弱化二进制图像的边界语法:BW2=erode(BW1,SE) \BW2=erode(BW1,SE,alg) \ BW2=erode(BW1,SE,...,n)makelut 创建一个用于applylut函数的lookup表语法:lut=makelut(fun,n) \ lut=makelut(fun,n,P1,P2,...)十一、区域处理函数roicolor 选择感兴趣的颜色区语法:BW=roicolor(A,low,high) \ BW=rocicolor(A,v)roifill 在图像的任意区域中进行平滑插补语法:J=roifill(I,c,r) \ J=roifill(I) \ J=roifill(I,BW) \ [J,BW]=roifill(...) \ J=roifill(x,y,I,xi,yi) \ [x,y,J,BW,xi,yi]=roifill(...)roifilt2 过滤敏感区域语法:J=roifilt2(h,I,BW) \ J=roifilt2(I,BW,fun) \ J=roifilt2(I,BW,fun,P1,P2,...)roipoly 选择一个敏感的多边形区域语法:BW=roipoly(I,c,r) \ BW=roipoly(I) \ BW=roipoly(x,y,I,xi,yi) \ [BW,xi,yi]=roipoly(...) \ [x,y,BW,xi,yi]=roipoly(...)十二、颜色映像处理函数brighten 增加或降低颜色映像表的亮度语法:brighten(beta) \ brighten(h,beta) \ newmap=brighten(beta) \newmap=brighten(cmap,beta)cmpermute 调整颜色映像表中的颜色语法:[Y,newmap]=cmpermute(X,map) \ [Y,newmap]=cmpermute(X,map,index) cmunigue 查找颜色映像表中特定的颜色及相应的图像语法:[Y,newmap]=cmunigue(X,map) \ [Y,newmap]=cmunigue(RGB) \[Y,newmap]=cmunique(I)imapprox 对索引图像进行近似处理语法:[Y,newmap]=imapprox(X,map,n) \ [Y,newmap]=imapprox(X,map,tol) \Y=imapprox(X,map,newmap) \[...]=imapprox(...,dither_option)rgbplot 划分颜色映像表语法:rgbplot(cmap)十三、颜色空间转换函数hsv2rgb 转换HSV值为RGB颜色空间:M=hsv2rgb(H)ntsc2rgb 转换NTSC值为RGB颜色空间:rgbmap=ntsc2rgb(yiqmap) \ RGB=ntsc2rgb(YIQ)rgb2hsv 转换RGB值为HSV颜色空间:cmap=rgb2hsv(M)rgb2ntsc 转换RGB值为NTSC颜色空间:yiqmap=rgb2ntsc(rgbmap) \YIQ=rgb2ntsc(RGB)rgb2ycbcr 转换RGB值为YCbCr颜色空间:ycbcrmap=rgb2ycbcr(rgbmap) \ YCBCR=rgb2ycbcr(RGB)ycbcr2rgb 转化YCbCr值为RGB颜色空间:rgbmap=ycbcr2rgb(ycbcrmap) \ RGB=ycbcr2rgb(YCBCR)十四、图像类型和类型转换函数dither 通过抖动增加外观颜色分辨率转换图像语法:X=dither(RGB,map) \ BW=dither(I)gray2ind 转换灰度图像为索引图像语法:[X,map]=gray2ind(I,n) \ [X,map]=gray2ind(BW,n)grayslice 从灰度图像为索引图像语法:X=grayslice(I,n) \ X=grayslice(I,v)im2bw 转换图像为二进制图像语法:BW=im2bw(I,level) \ BW=im2bw(X,map,level) \ BW=im2bw(RGB,level) im2double 转换图像矩阵为双精度型语法:I2=im2double(I1) \ RGB2=im2double(RGB1) \ I=im2double(BW) \X2=im2double(X1,'indexed')double 转换数据为双精度型语法:double(X)unit8 、unit16转换数据为8位、16位无符号整型:i=unit8(x) \ i=unit16(x) im2unit8 转换图像阵列为8位无符号整型语法:I2=im2unit8(I1) \ RGB2=im2unit8(RGB1) \ I=im2unit8(BW) \X2=im2unit8(X1,'indexed')im2unit16 转换图像阵列为16位无符号整型语法:I2=im2unit16(I1) \ RGB2=im2unit16(RGB1) \ I=im2unit16(BW) \X2=im2unit16(X1,'indexed')ind2gray 把检索图像转化为灰度图像语法:I=ind2gray(X,map)ind2rgb 转化索引图像为RGB真彩图像语法:RGB=ind2rgb(X,map)isbw 判断是否为二进制图像语法:flag=isbw(A)isgray 判断是否为灰度图像语法:flag=isgray(A)isind 判断是否为索引图像语法:flag=isind(A)isrgb 判断是否为RGB真彩色图像语法:flag=isrgb(A)mat2gray 转换矩阵为灰度图像语法:I=mat2gray(A,[amin amax]) \ I=mat2gray(A)rgb2gray 转换RGB图像或颜色映像表为灰度图像语法:I=rgb2gray(RGB) \ newmap=rgb2gray(map)rgb2ind 转换RGB图像为索引图像语法:[X,map]=rgb2ind(RGB,tol) \ [X,map]=rgb2ind(RGB,n) \ X=rgb2ind(RGB,map) \ [...]=rgb2ind(...,dither_option)十五、新增图像处理工具箱函数adapthisteq 限制对比度直方图均衡化: J=adapthisteq(I) \J=adapthisteq(I,param1,val1,param2,val2...)applycform 用于颜色空间变换out=applyform(I,C)bwboundaries 描绘二进制图像边界语法: B=bwboundaries(BW) \ B=bwboundaries(BW,CONN) \B=bwboundaries(BW,CONN,options) [BW,CONN,options] \ [BL]=bwboundaries(...) \ [BLNA]=bwboundaries()bwtraceboundary 描述二进制图像中的物体B=bwtraceboundary(BW,P,fstep) \ B=bwtraceboundary(BW,P,fstep,CONN) \B=bwtraceboundary(...N,dir)decorrstrech 对多通道图像进行去相关处理语法:S=decorrstretch(I) \ S=decorrstretch(I,TOL)dicomdict 获取或读取DICOM文件语法:dicomdict('set',dictionary) \ dictionary=dicomdict('get')getline 用鼠标选择ployline语法:[x,y]=getline(fig) \ [x,y]=getline(ax) \ [x,y]=getline \ [x,y]=getline(...,'closed')getpts 用鼠标选择像素点语法:[x,y]=getpts(fig) \ [x,y]=getpts(ax) \ [x,y]=getptsgetrect 用鼠标选择矩阵语法:rect=getrect(fig) \ rect=getrect(ax) \ rect=getrect(fig)iccread 读取ICC剖面语法:P=iccread(filename)im2java2d 将图像转换为Java缓冲图像语法:jimage=im2java2d(I) \ jimage=im2java2d(X,MAP)imview 在图像与蓝旗中显示图像语法:imview(I) \ imview(RGB) \ imview(X,map) \imview(I,range) \ imview(filename) \ imview(....'InitialMagnification',initial_mag) \ h=imview(...) \ imview close allippl 检查IPPL的存在语法:TF=ippl \ [TF B]=ippliptdemos 显示图像处理工具箱中的索引图像lab2double、lab2unit16、lab2unit8 将L*a*b数据分别转换为双精度、16位数据、8位数据makecform 创造一个色彩转换结构poly2mask 把多边形区域转换成mask区域语法:BW=poly2mask(x,y,m,n)unitlut 查找表中A像素值语法:B=unitlut(A,LUT)xyz2double、xyz2unit16 将颜色数据从XYZ转换到双精度、16进制。