Capillary Desaturation Curve (CDC) for Pore Doublet:毛细管去饱和曲线对孔隙对 30页PPT文档
Bradley Curve布兰德力安全文化曲线

Drive to high performance business
7
Pigments Division
ZERO Harm Toolbox
Drive to high performance business
8
Pigments Division
The Journey So Far
2011 Vision : ZERO Harm Conference 2012 Engage Workforce 2013 Gear Up Leadership Leading Indicators Pro Active Learning Life Saving Rules Leader Standard Work
Leading Indicator Group Statistics
119,501 245
• 60 Second Checks • Safety Crosses • Audits • Inspections (Audits & Workplace) • Safety Interactions (Leadership & Rest of Site) • Life Saving Rules Violations
Drive to high perforDivision
DuPont Bradley Curve – continuum of safety culture
Drive to high performance business
3
Pigments Division
DuPont Bradley Curve – continuum of safety culture
Drive to high performance business
中国药典2015版无菌检查法与美、欧、日药典的差异分析与讨论_潘友文
中国药典2015版无菌检查法与美、欧、日药典的差异分析与讨论潘友文(罗氏/基因泰克,美国南旧金山,94080)2016年07月29日摘要目的:分析中国药典2015版无菌检查法与美、欧、日药典无菌检查法的之间的差异性,为评价不同药典中无菌检查法的等效性提供参考。
方法:对无菌检查法的主要实验步骤和参数进行一对一比较,对有差异的步骤和参数进行科学论证和评价。
结果:中国药典2015版无菌检查法与美、欧、日药典无菌检查法的主要参数和步骤是一致的,但中国药典无菌检查法还需要做阳性对照和厌氧需氧菌的额外培养。
并且,中国药典用大肠埃希菌代替美、欧、日药典中的铜绿假单胞菌参与无菌检查法的适用性试验。
结论:各药典的无菌检查法是等效的。
在不影响方法等效性的前提下,中国药典2015版无菌检查法在阳性对照和培养方法上还可以进一步简化。
关键词:无菌检查法;中国药典;美国药典;欧洲药典;日本药典Gap Assessment and Discussion on Sterility Tests in Chinese Pharmacopoeia 2015, United States Pharmacopoeia, European Pharmacopoeia, and Japanese PharmacopoeiaYouwen Pan (Genentech, a Member of Roche, South San Francisco, USA 94080)Abstract Objective:Gap assessment and discussion on the sterility test methods in Chinese Pharmacopoeia 2015 edition (CP2015), United States Pharmacopoeia (USP), European Pharmacopoeia (EP), and Japanese Pharmacopoeia (JP). Method:The test procedures and key parameters in the sterility test methods in different pharmacopoeia were compared step by step and the differences were identified. The identified differences are scientifically evaluated for their impact to the equivalence of the methods. Result:The sterility test method in CP2015 is largely harmonized with that in USP, EP and JP except for a few differences. Positive control and extra incubation bacteria are required in CP2015 only, and Escherichia coli is used in method suitability test in CP2015 while Pseudomonas aeruginosa is used in USP/EP/JP. Conclusion:The Sterility Test Methods in CP2015, USP, EP, and JP are equivalent. The method in CP2015 could be simplified more without compromising the validity, accuracy and reliability of the method.Key words:sterility test;Chinese Pharmacopoeia 2015;United States Pharmacopoeia;European Pharmacopoeia; Japanese Pharmacopoeia无菌检查法是用于检查药典规定的无菌物品是否被微生物污染的检测方法。
银柴胡多糖超声辅助提取工艺优化及抗氧化活性分析

王红,彭励,宋乐,等. 银柴胡多糖超声辅助提取工艺优化及抗氧化活性分析[J]. 食品工业科技,2024,45(1):185−191. doi:10.13386/j.issn1002-0306.2023030025WANG Hong, PENG Li, SONG Le, et al. Optimization of Ultrasonic-assisted Extraction Process and Analysis of Antioxidant Activity of Polysaccharide from Stellariae Radix[J]. Science and Technology of Food Industry, 2024, 45(1): 185−191. (in Chinese with English abstract). doi: 10.13386/j.issn1002-0306.2023030025· 工艺技术 ·银柴胡多糖超声辅助提取工艺优化及抗氧化活性分析王 红1,彭 励1,2, *,宋 乐1,冯 璐1,李振凯1,李彦青1,高 跳1(1.宁夏大学生命科学学院,宁夏银川 750021;2.宁夏天然药物工程技术研究中心,宁夏银川 750021)摘 要:目的:为了提高银柴胡多糖得率,对银柴胡多糖提取工艺参数进行优化,并评价其体外抗氧化活性。
方法:采用超声辅助提取银柴胡多糖,在单因素实验基础上结合响应面法(Box–Behnken Response Surface )对提取工艺参数进行优化,并采用Sevag 法除蛋白得银柴胡粗多糖,进一步对其抗氧化活性进行分析。
结果:优化后银柴胡多糖最佳提取工艺参数为超声温度50 ℃、时间3.20 h 、提取次数2 次,在此条件下多糖得率最高,为28.24%±0.10%,多糖含量为59.13%;体外抗氧化测定结果显示,银柴胡粗多糖清除DPPH 自由基、OH 自由基、ABTS +自由基的IC 50分别是5.47、2.40和1.44 mg/mL ,表明其具有一定的抗氧化能力。
高钾法与冠状动脉堵塞法致家猪心脏骤停模型的对比研究

△基金项目:广东省科技计划(项目编号:2011A030300001)。
作者简介:王宗涛(1988-),男,住院医师,研究方向为冠心病及左心辅助装置。
通信作者:靳立军,E-mail ,lijun-jin@高钾法与冠状动脉堵塞法致家猪心脏骤停模型的对比研究△王宗涛1,靳立军2,雷达1,严红2,于汇民2,戴奕宁2[1.广东药科大学附属第一医院,广州510008;2.广东省心血管病研究所广东省人民医院(广东省医学科学院),广州510080]摘要:目的探讨家猪心脏骤停模型建立的方法。
方法10头成年家猪被按随机数字表法随机分为高钾法与冠状动脉(冠脉)堵塞法两组,分别通过静脉注射高钾与球囊堵塞冠脉两种方法建立心脏骤停模型,对比两种方法心室颤动模型的成功率、成功建立模型的时间及抢救成功率。
结果两组实验动物体质量、血压、心率等基线资料比较,差异无统计学意义(P >0.05)。
高钾法成功建立心室颤动模型5例,成功率100%,建立模型时间为(15.0±2.91)min ,抢救成功0例,成功率0;冠脉堵塞法成功建立心脏骤停模型5例,成功率100%,建立模型时间(18.2±1.92)min ,抢救成功3例,成功率60%。
两种方法建模的成功率比较,差异无统计学意义(P >0.05);建立模型时间比较,差异无统计学意义(P =0.576>0.05);两组抢救成功率比较,差异有统计学意义(P =0.038<0.05)。
结论冠脉堵塞法是更为有效和可靠的家猪心脏骤停模型建立方法。
关键词:心肌梗死;心脏骤停;家猪;高钾中图分类号:R 542.2+2文献标志码:A文章编号:1007-9688(2018)02-0217-04Comparison of hyperkalemic solution vein injection and blocking coronary artery for establishing a cardiac arrest animal model of pig WANG Zong-tao 1,JIN Li-jun 2,LEI Da 1,YAN Hong 2,YU Hui-min 2,DAI Yi-ning 2(1.Department of Cardiology ,The first Affiliated Hospital of Guangdong Pharmaceutical University ,Guangzhou 510008,China ;2.Guangdong Cardiovascular Institute ,Guangdong General Hospital ,Guangdong Academy of Medical Science ,Guangzhou 510008,China )Abstract :ObjectivesTo explore the method of establishing cardiac arrest animal model of pig.MethodsTotally10adult pigs were randomly arranged for the hyperkalemic solution vein injection group and blocking coronary artery group.We established the cardiac arrest models of pigs by injecting hyperkalemic solution and blocking coronary artery with balloon.Successful rate of ventricular fibrillation model ,duration of successful model building and rescue successful rate between the two groups were compared.ResultsThe baseline data of the two groups had no significantdifferences (P >0.05).Hyperkalemic solution vein injection group successfully established model of ventricularfibrillation in 5cases ,successful rate was 100%,duaration of successful model building was (15.0±2.91)min ,and there were no cases which had been rescued successfully with rescue successful rate was 0.Blocking coronary artery group successfully established model of ventricular fibrillation in 5cases with successful rate of 100%,duration of successful model building of (18.2±1.92)min ,and 3cases had been rescued successfully with successful rate of 60%.There were no significant differences between the two groups of successfully establishing model rate and duration of successful model building (P >0.05;P =0.576>0.05).Rescue successful rate had a significant difference between the two groups(P =0.038<0.05).ConclusionsThe method of acute myocardial infarction by blocking coronary artery block methodis more effective and reliable for pig cardiac arrest model-establishment.Key words :myocardial infarction ;cardiac arrest ;pig ;hyperkalemicdoi :10.3969/j.issn.1007-9688.2018.02.23·实验研究·随着医学的发展进步,目前临床对心源性猝死的研究不断深入,对心源性猝死的抢救取得了许多成功,但是整体成功率仍然较低[1]。
普赖斯曲线

普赖斯曲线
普赖斯曲线(Price’s curve)是指揭示科学文献增长规律的曲线。
是美国科技史学家普赖斯综合、分析了大量的统计资料,以科学文献量为纵轴,以历史年代为横轴,把各不同年代的科学文献量在坐标系中逐点描绘出来,通过平滑方法所得出的一条曲线。
它近似地表征了科学文献随时间增长的规律,即科学文献量的增长与时间成指数函数关系(在普通直角坐标中呈指数曲线,在单对数坐标系中呈一直线),其数学公式表示为:F(t)=aebt[F (t)表示 t 时刻的文献量,a 为统计初始时刻的文献量,b 是时间常数。
SPSS术语中英文对照

SPSS术语中英文对照【常用软件】SPSS术语中英文对照Absolute deviation, 绝对离差Absolute number, 绝对数Absolute residuals, 绝对残差Acceleration array, 加速度立体阵Acceleration in an arbitrary direction, 任意方向上的加速度Acceleration normal, 法向加速度Acceleration space dimension, 加速度空间的维数Acceleration tangential, 切向加速度Acceleration vector, 加速度向量Acceptable hypothesis, 可接受假设Accumulation, 累积Accuracy, 准确度Actual frequency, 实际频数Adaptive estimator, 自适应估计量Addition, 相加Addition theorem, 加法定理Additivity, 可加性Adjusted rate, 调整率Adjusted value, 校正值Admissible error, 容许误差Aggregation, 聚集性Alternative hypothesis, 备择假设Among groups, 组间Amounts, 总量Analysis of correlation, 相关分析Analysis of covariance, 协方差分析Analysis of regression, 回归分析Analysis of time series, 时间序列分析Analysis of variance, 方差分析Angular transformation, 角转换ANOVA (analysis of variance), 方差分析ANOVA Models, 方差分析模型Arcing, 弧/弧旋Arcsine transformation, 反正弦变换Area under the curve, 曲线面积AREG , 评估从一个时间点到下一个时间点回归相关时的误差ARIMA, 季节和非季节性单变量模型的极大似然估计Arithmetic grid paper, 算术格纸Arithmetic mean, 算术平均数Arrhenius relation, 艾恩尼斯关系Assessing fit, 拟合的评估Associative laws, 结合律Asymmetric distribution, 非对称分布Asymptotic bias, 渐近偏倚Asymptotic efficiency, 渐近效率Asymptotic variance, 渐近方差Attributable risk, 归因危险度Attribute data, 属性资料Attribution, 属性Autocorrelation, 自相关Autocorrelation of residuals, 残差的自相关Average, 平均数Average confidence interval length, 平均置信区间长度Average growth rate, 平均增长率Bar chart, 条形图Bar graph, 条形图Base period, 基期Bayes' theorem , Bayes定理Bell-shaped curve, 钟形曲线Bernoulli distribution, 伯努力分布Best-trim estimator, 最好切尾估计量Bias, 偏性Binary logistic regression, 二元逻辑斯蒂回归Binomial distribution, 二项分布Bisquare, 双平方Bivariate Correlate, 二变量相关Bivariate normal distribution, 双变量正态分布Bivariate normal population, 双变量正态总体Biweight interval, 双权区间Biweight M-estimator, 双权M估计量Block, 区组/配伍组BMDP(Biomedical computer programs), BMDP统计软件包Boxplots, 箱线图/箱尾图Breakdown bound, 崩溃界/崩溃点Canonical correlation, 典型相关Caption, 纵标目Case-control study, 病例对照研究Categorical variable, 分类变量Catenary, 悬链线Cauchy distribution, 柯西分布Cause-and-effect relationship, 因果关系Cell, 单元Censoring, 终检Center of symmetry, 对称中心Centering and scaling, 中心化和定标Central tendency, 集中趋势Central value, 中心值CHAID -χ2 Automatic Interac tion Detector, 卡方自动交互检测Chance, 机遇Chance error, 随机误差Chance variable, 随机变量Characteristic equation, 特征方程Characteristic root, 特征根Characteristic vector, 特征向量Chebshev criterion of fit, 拟合的切比雪夫准则Chernoff faces, 切尔诺夫脸谱图Chi-square test, 卡方检验/χ2检验Choleskey decomposition, 乔洛斯基分解Circle chart, 圆图Class interval, 组距Class mid-value, 组中值Class upper limit, 组上限Classified variable, 分类变量Cluster analysis, 聚类分析Cluster sampling, 整群抽样Code, 代码Coded data, 编码数据Coding, 编码Coefficient of contingency, 列联系数Coefficient of determination, 决定系数Coefficient of multiple correlation, 多重相关系数Coefficient of partial correlation, 偏相关系数Coefficient of production-moment correlation, 积差相关系数Coefficient of rank correlation, 等级相关系数Coefficient of regression, 回归系数Coefficient of skewness, 偏度系数Coefficient of variation, 变异系数Cohort study, 队列研究Column, 列Column effect, 列效应Column factor, 列因素Combination pool, 合并Combinative table, 组合表Common factor, 共性因子Common regression coefficient, 公共回归系数Common value, 共同值Common variance, 公共方差Common variation, 公共变异Communality variance, 共性方差Comparability, 可比性Comparison of bathes, 批比较Comparison value, 比较值Compartment model, 分部模型Compassion, 伸缩Complement of an event, 补事件Complete association, 完全正相关Complete dissociation, 完全不相关Complete statistics, 完备统计量Completely randomized design, 完全随机化设计Composite event, 联合事件Composite events, 复合事件Concavity, 凹性Conditional expectation, 条件期望Conditional likelihood, 条件似然Conditional probability, 条件概率Conditionally linear, 依条件线性Confidence interval, 置信区间Confidence limit, 置信限Confidence lower limit, 置信下限Confidence upper limit, 置信上限Confirmatory Factor Analysis , 验证性因子分析Confirmatory research, 证实性实验研究Confounding factor, 混杂因素Conjoint, 联合分析Consistency, 相合性Consistency check, 一致性检验Consistent asymptotically normal estimate, 相合渐近正态估计Consistent estimate, 相合估计Constrained nonlinear regression, 受约束非线性回归Constraint, 约束Contaminated distribution, 污染分布Contaminated Gausssian, 污染高斯分布Contaminated normal distribution, 污染正态分布Contamination, 污染Contamination model, 污染模型Contingency table, 列联表Contour, 边界线Contribution rate, 贡献率Control, 对照Controlled experiments, 对照实验Conventional depth, 常规深度Convolution, 卷积Corrected factor, 校正因子Corrected mean, 校正均值Correction coefficient, 校正系数Correctness, 正确性Correlation coefficient, 相关系数Correlation index, 相关指数Correspondence, 对应Counting, 计数Counts, 计数/频数Covariance, 协方差Covariant, 共变Cox Regression, Cox回归Criteria for fitting, 拟合准则Criteria of least squares, 最小二乘准则Critical ratio, 临界比Critical region, 拒绝域Critical value, 临界值Cross-over design, 交叉设计Cross-section analysis, 横断面分析Cross-section survey, 横断面调查Crosstabs , 交叉表Cross-tabulation table, 复合表Cube root, 立方根Cumulative distribution function, 分布函数Cumulative probability, 累计概率Curvature, 曲率/弯曲Curvature, 曲率Curve fit , 曲线拟和Curve fitting, 曲线拟合Curvilinear regression, 曲线回归Curvilinear relation, 曲线关系Cut-and-try method, 尝试法Cycle, 周期Cyclist, 周期性D test, D检验Data acquisition, 资料收集Data bank, 数据库Data capacity, 数据容量Data deficiencies, 数据缺乏Data handling, 数据处理Data manipulation, 数据处理Data processing, 数据处理Data reduction, 数据缩减Data set, 数据集Data sources, 数据来源Data transformation, 数据变换Data validity, 数据有效性Data-in, 数据输入Data-out, 数据输出Dead time, 停滞期Degree of freedom, 自由度Degree of precision, 精密度Degree of reliability, 可靠性程度Degression, 递减Density function, 密度函数Density of data points, 数据点的密度Dependent variable, 应变量/依变量/因变量Dependent variable, 因变量Depth, 深度Derivative matrix, 导数矩阵Derivative-free methods, 无导数方法Design, 设计Determinacy, 确定性Determinant, 行列式Determinant, 决定因素Deviation, 离差Deviation from average, 离均差Diagnostic plot, 诊断图Dichotomous variable, 二分变量Differential equation, 微分方程Direct standardization, 直接标准化法Discrete variable, 离散型变量DISCRIMINANT, 判断Discriminant analysis, 判别分析Discriminant coefficient, 判别系数Discriminant function, 判别值Dispersion, 散布/分散度Disproportional, 不成比例的Disproportionate sub-class numbers, 不成比例次级组含量Distribution free, 分布无关性/免分布Distribution shape, 分布形状Distribution-free method, 任意分布法Distributive laws, 分配律Disturbance, 随机扰动项Dose response curve, 剂量反应曲线Double blind method, 双盲法Double blind trial, 双盲试验Double exponential distribution, 双指数分布Double logarithmic, 双对数Downward rank, 降秩Dual-space plot, 对偶空间图DUD, 无导数方法Duncan's new multiple range method, 新复极差法/Duncan新法Effect, 实验效应Eigenvalue, 特征值Eigenvector, 特征向量Ellipse, 椭圆Empirical distribution, 经验分布Empirical probability, 经验概率单位Enumeration data, 计数资料Equal sun-class number, 相等次级组含量Equally likely, 等可能Equivariance, 同变性Error, 误差/错误Error of estimate, 估计误差Error type I, 第一类错误Error type II, 第二类错误Estimand, 被估量Estimated error mean squares, 估计误差均方Estimated error sum of squares, 估计误差平方和Euclidean distance, 欧式距离Event, 事件Event, 事件Exceptional data point, 异常数据点Expectation plane, 期望平面Expectation surface, 期望曲面Expected values, 期望值Experiment, 实验Experimental sampling, 试验抽样Experimental unit, 试验单位Explanatory variable, 说明变量Exploratory data analysis, 探索性数据分析Explore Summarize, 探索-摘要Exponential curve, 指数曲线Exponential growth, 指数式增长EXSMOOTH, 指数平滑方法Extended fit, 扩充拟合Extra parameter, 附加参数Extrapolation, 外推法Extreme observation, 末端观测值Extremes, 极端值/极值F distribution, F分布F test, F检验Factor, 因素/因子Factor analysis, 因子分析Factor Analysis, 因子分析Factor score, 因子得分Factorial, 阶乘Factorial design, 析因试验设计False negative, 假阴性False negative error, 假阴性错误Family of distributions, 分布族Family of estimators, 估计量族Fanning, 扇面Fatality rate, 病死率Field investigation, 现场调查Field survey, 现场调查Finite population, 有限总体Finite-sample, 有限样本First derivative, 一阶导数First principal component, 第一主成分First quartile, 第一四分位数Fisher information, 费雪信息量Fitted value, 拟合值Fitting a curve, 曲线拟合Fixed base, 定基Fluctuation, 随机起伏Forecast, 预测Four fold table, 四格表Fourth, 四分点Fraction blow, 左侧比率Fractional error, 相对误差Frequency, 频率Frequency polygon, 频数多边图Frontier point, 界限点Function relationship, 泛函关系Gamma distribution, 伽玛分布Gauss increment, 高斯增量Gaussian distribution, 高斯分布/正态分布Gauss-Newton increment, 高斯-牛顿增量General census, 全面普查GENLOG (Generalized liner models), 广义线性模型Geometric mean, 几何平均数Gini's mean difference, 基尼均差GLM (General liner models), 一般线性模型Goodness of fit, 拟和优度/配合度Gradient of determinant, 行列式的梯度Graeco-Latin square, 希腊拉丁方Grand mean, 总均值Gross errors, 重大错误Gross-error sensitivity, 大错敏感度Group averages, 分组平均Grouped data, 分组资料Guessed mean, 假定平均数Half-life, 半衰期Hampel M-estimators, 汉佩尔M估计量Happenstance, 偶然事件Harmonic mean, 调和均数Hazard function, 风险均数Hazard rate, 风险率Heading, 标目Heavy-tailed distribution, 重尾分布Hessian array, 海森立体阵Heterogeneity, 不同质Heterogeneity of variance, 方差不齐Hierarchical classification, 组内分组Hierarchical clustering method, 系统聚类法High-leverage point, 高杠杆率点HILOGLINEAR, 多维列联表的层次对数线性模型Hinge, 折叶点Histogram, 直方图Historical cohort study, 历史性队列研究Holes, 空洞HOMALS, 多重响应分析Homogeneity of variance, 方差齐性Homogeneity test, 齐性检验Huber M-estimators, 休伯M估计量Hyperbola, 双曲线Hypothesis testing, 假设检验Hypothetical universe, 假设总体Impossible event, 不可能事件Independence, 独立性Independent variable, 自变量Index, 指标/指数Indirect standardization, 间接标准化法Individual, 个体Inference band, 推断带Infinite population, 无限总体Infinitely great, 无穷大Infinitely small, 无穷小Influence curve, 影响曲线Information capacity, 信息容量Initial condition, 初始条件Initial estimate, 初始估计值Initial level, 最初水平Interaction, 交互作用Interaction terms, 交互作用项Intercept, 截距Interpolation, 内插法Interquartile range, 四分位距Interval estimation, 区间估计Intervals of equal probability, 等概率区间Intrinsic curvature, 固有曲率Invariance, 不变性Inverse matrix, 逆矩阵Inverse probability, 逆概率Inverse sine transformation, 反正弦变换Iteration, 迭代Jacobian determinant, 雅可比行列式Joint distribution function, 分布函数Joint probability, 联合概率Joint probability distribution, 联合概率分布K means method, 逐步聚类法Kaplan-Meier, 评估事件的时间长度Kaplan-Merier chart, Kaplan-Merier图Kendall's rank correlation, Kendall等级相关Kinetic, 动力学Kolmogorov-Smirnove test, 柯尔莫哥洛夫-斯米尔诺夫检验Kruskal and Wallis test, Kruskal及Wallis检验/多样本的秩和检验/H检验Kurtosis, 峰度Lack of fit, 失拟Ladder of powers, 幂阶梯Lag, 滞后Large sample, 大样本Large sample test, 大样本检验Latin square, 拉丁方Latin square design, 拉丁方设计Leakage, 泄漏Least favorable configuration, 最不利构形Least favorable distribution, 最不利分布Least significant difference, 最小显著差法Least square method, 最小二乘法Least-absolute-residuals estimates, 最小绝对残差估计Least-absolute-residuals fit, 最小绝对残差拟合Least-absolute-residuals line, 最小绝对残差线Legend, 图例L-estimator, L估计量L-estimator of location, 位置L估计量L-estimator of scale, 尺度L估计量Level, 水平Life expectance, 预期期望寿命Life table, 寿命表Life table method, 生命表法Light-tailed distribution, 轻尾分布Likelihood function, 似然函数Likelihood ratio, 似然比line graph, 线图Linear correlation, 直线相关Linear equation, 线性方程Linear programming, 线性规划Linear regression, 直线回归Linear Regression, 线性回归Linear trend, 线性趋势Loading, 载荷Location and scale equivariance, 位置尺度同变性Location equivariance, 位置同变性Location invariance, 位置不变性Location scale family, 位置尺度族Log rank test, 时序检验Logarithmic curve, 对数曲线Logarithmic normal distribution, 对数正态分布Logarithmic scale, 对数尺度Logarithmic transformation, 对数变换Logic check, 逻辑检查Logistic distribution, 逻辑斯特分布Logit transformation, Logit转换LOGLINEAR, 多维列联表通用模型Lognormal distribution, 对数正态分布Lost function, 损失函数Low correlation, 低度相关Lower limit, 下限Lowest-attained variance, 最小可达方差LSD, 最小显著差法的简称Lurking variable, 潜在变量Main effect, 主效应Major heading, 主辞标目Marginal density function, 边缘密度函数Marginal probability, 边缘概率Marginal probability distribution, 边缘概率分布Matched data, 配对资料Matched distribution, 匹配过分布Matching of distribution, 分布的匹配Matching of transformation, 变换的匹配Mathematical expectation, 数学期望Mathematical model, 数学模型Maximum L-estimator, 极大极小L 估计量Maximum likelihood method, 最大似然法Mean, 均数Mean squares between groups, 组间均方Mean squares within group, 组内均方Means (Compare means), 均值-均值比较Median, 中位数Median effective dose, 半数效量Median lethal dose, 半数致死量Median polish, 中位数平滑Median test, 中位数检验Minimal sufficient statistic, 最小充分统计量Minimum distance estimation, 最小距离估计Minimum effective dose, 最小有效量Minimum lethal dose, 最小致死量Minimum variance estimator, 最小方差估计量MINITAB, 统计软件包Minor heading, 宾词标目Missing data, 缺失值Model specification, 模型的确定Modeling Statistics , 模型统计Models for outliers, 离群值模型Modifying the model, 模型的修正Modulus of continuity, 连续性模Morbidity, 发病率Most favorable configuration, 最有利构形Multidimensional Scaling (ASCAL), 多维尺度/多维标度Multinomial Logistic Regression , 多项逻辑斯蒂回归Multiple comparison, 多重比较Multiple correlation , 复相关Multiple covariance, 多元协方差Multiple linear regression, 多元线性回归Multiple response , 多重选项Multiple solutions, 多解Multiplication theorem, 乘法定理Multiresponse, 多元响应Multi-stage sampling, 多阶段抽样Multivariate T distribution, 多元T分布Mutual exclusive, 互不相容Mutual independence, 互相独立Natural boundary, 自然边界Natural dead, 自然死亡Natural zero, 自然零Negative correlation, 负相关Negative linear correlation, 负线性相关Negatively skewed, 负偏Newman-Keuls method, q检验NK method, q检验No statistical significance, 无统计意义Nominal variable, 名义变量Nonconstancy of variability, 变异的非定常性Nonlinear regression, 非线性相关Nonparametric statistics, 非参数统计Nonparametric test, 非参数检验Nonparametric tests, 非参数检验Normal deviate, 正态离差Normal distribution, 正态分布Normal equation, 正规方程组Normal ranges, 正常范围Normal value, 正常值Nuisance parameter, 多余参数/讨厌参数Null hypothesis, 无效假设Numerical variable, 数值变量Objective function, 目标函数Observation unit, 观察单位Observed value, 观察值One sided test, 单侧检验One-way analysis of variance, 单因素方差分析Oneway ANOVA , 单因素方差分析Open sequential trial, 开放型序贯设计Optrim, 优切尾Optrim efficiency, 优切尾效率Order statistics, 顺序统计量Ordered categories, 有序分类Ordinal logistic regression , 序数逻辑斯蒂回归Ordinal variable, 有序变量Orthogonal basis, 正交基Orthogonal design, 正交试验设计Orthogonality conditions, 正交条件ORTHOPLAN, 正交设计Outlier cutoffs, 离群值截断点Outliers, 极端值OVERALS , 多组变量的非线性正规相关Overshoot, 迭代过度Paired design, 配对设计Paired sample, 配对样本Pairwise slopes, 成对斜率Parabola, 抛物线Parallel tests, 平行试验Parameter, 参数Parametric statistics, 参数统计Parametric test, 参数检验Partial correlation, 偏相关Partial regression, 偏回归Partial sorting, 偏排序Partials residuals, 偏残差Pattern, 模式Pearson curves, 皮尔逊曲线Peeling, 退层Percent bar graph, 百分条形图Percentage, 百分比Percentile, 百分位数Percentile curves, 百分位曲线Periodicity, 周期性Permutation, 排列P-estimator, P估计量Pie graph, 饼图Pitman estimator, 皮特曼估计量Pivot, 枢轴量Planar, 平坦Planar assumption, 平面的假设PLANCARDS, 生成试验的计划卡Point estimation, 点估计Poisson distribution, 泊松分布Polishing, 平滑Polled standard deviation, 合并标准差Polled variance, 合并方差Polygon, 多边图Polynomial, 多项式Polynomial curve, 多项式曲线Population, 总体Population attributable risk, 人群归因危险度Positive correlation, 正相关Positively skewed, 正偏Posterior distribution, 后验分布Power of a test, 检验效能Precision, 精密度Predicted value, 预测值Preliminary analysis, 预备性分析Principal component analysis, 主成分分析Prior distribution, 先验分布Prior probability, 先验概率Probabilistic model, 概率模型probability, 概率Probability density, 概率密度Product moment, 乘积矩/协方差Profile trace, 截面迹图Proportion, 比/构成比Proportion allocation in stratified random sampling, 按比例分层随机抽样Proportionate, 成比例Proportionate sub-class numbers, 成比例次级组含量Prospective study, 前瞻性调查Proximities, 亲近性Pseudo F test, 近似F检验Pseudo model, 近似模型Pseudosigma, 伪标准差Purposive sampling, 有目的抽样QR decomposition, QR分解Quadratic approximation, 二次近似Qualitative classification, 属性分类Qualitative method, 定性方法Quantile-quantile plot, 分位数-分位数图/Q-Q图Quantitative analysis, 定量分析Quartile, 四分位数Quick Cluster, 快速聚类Radix sort, 基数排序Random allocation, 随机化分组Random blocks design, 随机区组设计Random event, 随机事件Randomization, 随机化Range, 极差/全距Rank correlation, 等级相关Rank sum test, 秩和检验Rank test, 秩检验Ranked data, 等级资料Rate, 比率Ratio, 比例Raw data, 原始资料Raw residual, 原始残差Rayleigh's test, 雷氏检验Rayleigh's Z, 雷氏Z值Reciprocal, 倒数Reciprocal transformation, 倒数变换Recording, 记录Redescending estimators, 回降估计量Reducing dimensions, 降维Re-expression, 重新表达Reference set, 标准组Region of acceptance, 接受域Regression coefficient, 回归系数Regression sum of square, 回归平方和Rejection point, 拒绝点Relative dispersion, 相对离散度Relative number, 相对数Reliability, 可靠性Reparametrization, 重新设置参数Replication, 重复Report Summaries, 报告摘要Residual sum of square, 剩余平方和Resistance, 耐抗性Resistant line, 耐抗线Resistant technique, 耐抗技术R-estimator of location, 位置R估计量R-estimator of scale, 尺度R估计量Retrospective study, 回顾性调查Ridge trace, 岭迹Ridit analysis, Ridit分析Rotation, 旋转Rounding, 舍入Row, 行Row effects, 行效应Row factor, 行因素RXC table, RXC表Sample, 样本Sample regression coefficient, 样本回归系数Sample size, 样本量Sample standard deviation, 样本标准差Sampling error, 抽样误差SAS(Statistical analysis system ), SAS统计软件包Scale, 尺度/量表Scatter diagram, 散点图Schematic plot, 示意图/简图Score test, 计分检验Screening, 筛检SEASON, 季节分析Second derivative, 二阶导数Second principal component, 第二主成分SEM (Structural equation modeling), 结构化方程模型Semi-logarithmic graph, 半对数图Semi-logarithmic paper, 半对数格纸Sensitivity curve, 敏感度曲线Sequential analysis, 贯序分析Sequential data set, 顺序数据集Sequential design, 贯序设计Sequential method, 贯序法Sequential test, 贯序检验法Serial tests, 系列试验Short-cut method, 简捷法Sigmoid curve, S形曲线Sign function, 正负号函数Sign test, 符号检验Signed rank, 符号秩Significance test, 显著性检验Significant figure, 有效数字Simple cluster sampling, 简单整群抽样Simple correlation, 简单相关Simple random sampling, 简单随机抽样Simple regression, 简单回归simple table, 简单表Sine estimator, 正弦估计量Single-valued estimate, 单值估计Singular matrix, 奇异矩阵Skewed distribution, 偏斜分布Skewness, 偏度Slash distribution, 斜线分布Slope, 斜率Smirnov test, 斯米尔诺夫检验Source of variation, 变异来源Spearman rank correlation, 斯皮尔曼等级相关Specific factor, 特殊因子Specific factor variance, 特殊因子方差Spectra , 频谱Spherical distribution, 球型正态分布Spread, 展布SPSS(Statistical package for the social science), SPSS统计软件包Spurious correlation, 假性相关Square root transformation, 平方根变换Stabilizing variance, 稳定方差Standard deviation, 标准差Standard error, 标准误Standard error of difference, 差别的标准误Standard error of estimate, 标准估计误差Standard error of rate, 率的标准误Standard normal distribution, 标准正态分布Standardization, 标准化Starting value, 起始值Statistic, 统计量Statistical control, 统计控制Statistical graph, 统计图Statistical inference, 统计推断Statistical table, 统计表Steepest descent, 最速下降法Stem and leaf display, 茎叶图Step factor, 步长因子Stepwise regression, 逐步回归Storage, 存Strata, 层(复数)Stratified sampling, 分层抽样Stratified sampling, 分层抽样Strength, 强度Stringency, 严密性Structural relationship, 结构关系Studentized residual, 学生化残差/t化残差Sub-class numbers, 次级组含量Subdividing, 分割Sufficient statistic, 充分统计量Sum of products, 积和Sum of squares, 离差平方和Sum of squares about regression, 回归平方和Sum of squares between groups, 组间平方和Sum of squares of partial regression, 偏回归平方和Sure event, 必然事件Survey, 调查Survival, 生存分析Survival rate, 生存率Suspended root gram, 悬吊根图Symmetry, 对称Systematic error, 系统误差Systematic sampling, 系统抽样Tags, 标签Tail area, 尾部面积Tail length, 尾长Tail weight, 尾重Tangent line, 切线Target distribution, 目标分布Taylor series, 泰勒级数Tendency of dispersion, 离散趋势Testing of hypotheses, 假设检验Theoretical frequency, 理论频数Time series, 时间序列Tolerance interval, 容忍区间Tolerance lower limit, 容忍下限Tolerance upper limit, 容忍上限Torsion, 扰率Total sum of square, 总平方和Total variation, 总变异Transformation, 转换Treatment, 处理Trend, 趋势Trend of percentage, 百分比趋势Trial, 试验Trial and error method, 试错法Tuning constant, 细调常数Two sided test, 双向检验Two-stage least squares, 二阶最小平方Two-stage sampling, 二阶段抽样Two-tailed test, 双侧检验Two-way analysis of variance, 双因素方差分析Two-way table, 双向表Type I error, 一类错误/α错误Type II error, 二类错误/β错误UMVU, 方差一致最小无偏估计简称Unbiased estimate, 无偏估计Unconstrained nonlinear regression , 无约束非线性回归Unequal subclass number, 不等次级组含量Ungrouped data, 不分组资料Uniform coordinate, 均匀坐标Uniform distribution, 均匀分布Uniformly minimum variance unbiased estimate, 方差一致最小无偏估计Unit, 单元Unordered categories, 无序分类Upper limit, 上限Upward rank, 升秩Vague concept, 模糊概念Validity, 有效性VARCOMP (Variance component estimation), 方差元素估计Variability, 变异性Variable, 变量Variance, 方差Variation, 变异Varimax orthogonal rotation, 方差最大正交旋转Volume of distribution, 容积W test, W检验Weibull distribution, 威布尔分布Weight, 权数Weighted Chi-square test, 加权卡方检验/Cochran检验Weighted linear regression method, 加权直线回归Weighted mean, 加权平均数Weighted mean square, 加权平均方差Weighted sum of square, 加权平方和Weighting coefficient, 权重系数Weighting method, 加权法W-estimation, W估计量W-estimation of location, 位置W估计量Width, 宽度Wilcoxon paired test, 威斯康星配对法/配对符号秩和检验Wild point, 野点/狂点Wild value, 野值/狂值Winsorized mean, 缩尾均值Withdraw, 失访Youden's index, 尤登指数Z test, Z检验Zero correlation, 零相关Z-transformation, Z变换。
calibration_curve参数

calibration_curve参数概述在机器学习中,模型校准是一个重要的概念。
校准是指将模型的输出概率转化为可靠的置信度度量。
模型的校准程度对许多应用来说都至关重要,如分类、风险预测等。
校准曲线在进行模型校准时,常用的评估方法之一就是绘制校准曲线。
校准曲线是一种可视化工具,用来评估分类模型的校准程度。
它可以帮助我们了解模型的预测概率与真实概率之间的偏差。
calib ration_curv e函数`s kl ea rn.c al ib rat i on.c al ib ra ti on_c ur ve`是sc ik it-l e ar n库中的一个函数,用于计算校准曲线的数据点。
它可以根据输入的分类模型和数据集,计算出在不同置信度水平下,模型的平均预测概率以及真实概率。
使用方法`c al ib ra ti on_c urv e`函数的使用方法如下:f r om sk le ar n.ca lib r at io ni mp or tc ali b ra ti on_c ur ve真实标签预测的概率f r ac ti on_o f_po sit i ve s,me an_p re dic t ed_v al u e=c al ibr a ti on_ c u rv e(y_tr ue,y_pr e d,n_bi ns=10)其中,`y_tr ue`代表真实标签,可以是二进制标签或多类标签。
`y_p re d`是模型预测的概率。
`n_bi ns`是用于划分置信度水平的箱子个数,默认为10。
输出结果`c al ib ra ti on_c urv e`函数会返回两个数组:`f ra ct io n_of_p osi t iv es`和`m ea n_pr e di ct ed_v al ue`。
`f ra ct io n_of_p osi t iv es`是每个置信度水平下的真实概率的平均值。
`m ea n_pr ed ic te d_v a lu e`是模型对应置信度水平下的预测概率的平均值。
拉雷尔电子有限公司产品说明书
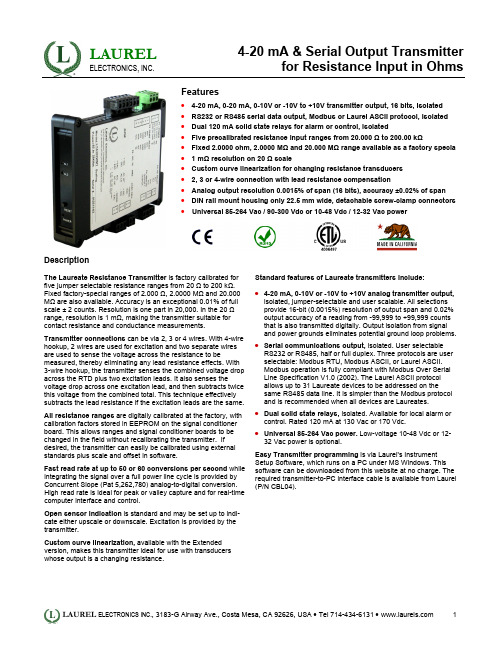
LAUREL ELECTRONICS, INC.4-20 mA & Serial Output Transmitter for Resistance Input in OhmsFeatures•4-20 mA, 0-20 mA, 0-10V or -10V to +10V transmitter output, 16 bits, isolated•RS232 or RS485 serial data output, Modbus or Laurel ASCII protocol, isolated•Dual 120 mA solid state relays for alarm or control, isolated•Five precalibrated resistance input ranges from 20.000 Ω to 200.00 kΩ•Fixed 2.0000 ohm, 2.0000 MΩ and 20.000 MΩ range available as a factory specia• 1 mΩ resolution on 20 Ω scale•Custom curve linearization for changing resistance transducers•2, 3 or 4-wire connection with lead resistance compensation•Analog output resolution 0.0015% of span (16 bits), accuracy ±0.02% of span•DIN rail mount housing only 22.5 mm wide, detachable screw-clamp connectors•Universal 85-264 Vac / 90-300 Vdc or 10-48 Vdc / 12-32 Vac powerDescriptionThe Laureate Resistance Transmitter is factory calibrated forfive jumper selectable resistance ranges from 20 Ω to 200 kΩ.Fixed factory-special ranges of 2.000 Ω, 2.0000 MΩ and 20.000MΩ are also available. Accuracy is an exceptional 0.01% of fullscale ± 2 counts. Resolution is one part in 20,000. In the 20 Ωrange, resolution is 1 mΩ, making the transmitter suitable forcontact resistance and conductance measurements.Transmitter connections can be via 2, 3 or 4 wires. With 4-wirehookup, 2 wires are used for excitation and two separate wiresare used to sense the voltage across the resistance to bemeasured, thereby eliminating any lead resistance effects. With3-wire hookup, the transmitter senses the combined voltage dropacross the RTD plus two excitation leads. It also senses thevoltage drop across one excitation lead, and then subtracts twicethis voltage from the combined total. This technique effectivelysubtracts the lead resistance if the excitation leads are the same.All resistance ranges are digitally calibrated at the factory, withcalibration factors stored in EEPROM on the signal conditionerboard. This allows ranges and signal conditioner boards to bechanged in the field without recalibrating the transmitter. Ifdesired, the transmitter can easily be calibrated using externalstandards plus scale and offset in software.Fast read rate at up to 50 or 60 conversions per second whileintegrating the signal over a full power line cycle is provided byConcurrent Slope (Pat 5,262,780) analog-to-digital conversion.High read rate is ideal for peak or valley capture and for real-timecomputer interface and control.Open sensor indication is standard and may be set up to indi-cate either upscale or downscale. Excitation is provided by thetransmitter.Custom curve linearization, available with the Extendedversion, makes this transmitter ideal for use with transducerswhose output is a changing resistance.Standard features of Laureate transmitters include:•4-20 mA, 0-10V or -10V to +10V analog transmitter output,isolated, jumper-selectable and user scalable. All selectionsprovide 16-bit (0.0015%) resolution of output span and 0.02%output accuracy of a reading from -99,999 to +99,999 countsthat is also transmitted digitally. Output isolation from signaland power grounds eliminates potential ground loop problems.•Serial communications output, isolated. User selectableRS232 or RS485, half or full duplex. Three protocols are userselectable: Modbus RTU, Modbus ASCII, or Laurel ASCII.Modbus operation is fully compliant with Modbus Over SerialLine Specification V1.0 (2002). The Laurel ASCII protocolallows up to 31 Laureate devices to be addressed on thesame RS485 data line. It is simpler than the Modbus protocoland is recommended when all devices are Laureates.•Dual solid state relays, isolated. Available for local alarm orcontrol. Rated 120 mA at 130 Vac or 170 Vdc.•Universal 85-264 Vac power. Low-voltage 10-48 Vdc or 12-32 Vac power is optional.Easy Transmitter programming is via Laurel's InstrumentSetup Software, which runs on a PC under MS Windows. Thissoftware can be downloaded from this website at no charge. Therequired transmitter-to-PC interface cable is available from Laurel(P/N CBL04).SpecificationsRange Resolution Accuracy Excitation Current0-2.0000 Ω 0-20.000 Ω 0-200.00 Ω 0-2000.0 Ω 0-20000 Ω 0-200.00 kΩ 0-2.0000 MΩ 0-20.000 MΩ 0.1 mΩ1 mΩ10 mΩ100 mΩ1 Ω10 Ω100 Ω1 kΩ±0.01% of range± 2 counts5 mA5 mA500 µA50 µA5 µA500 nA500 nA75 nASignal InputInput Resolution Input Accuracy Update Rate, Max 16 bits (65,536 steps)±0.01% of full scale ± 2 counts 50/sec at 50 Hz, 60/sec at 60 HzAnalog Output (standard)Output Levels Compliance at 20 mA Compliance at 10V Output Resolution Output Accuracy Output Isolation 4-20 mA, 0-20 mA, 0-10 Vdc, -10 to +10Vdc (user selectable) 10V (0-500Ω load)2 mA (5 kΩ load or higher)16 bits (65,536 steps)0.02% of output span plus conversion accuracy250V rms working, 2.3 kV rms per 1 minute testSerial Communications (standard)Signal TypesData RatesOutput Isolation Serial Protocols Modbus Modes Modbus Compliance Digital Addressing RS232 or RS485 (half or full duplex)300, 600, 1200, 2400, 4800, 9600, 19200 baud250V rms working, 2.3 kV rms per 1 min testModbus RTU, Modbus ASCII, Laurel ASCIIRTU or ASCIIModbus over Serial Line Specification V1.0 (2002)247 Modbus addresses. Up to 32 devices on an RS485 line w/o a repeater.Dual Relay Output (standard)Relay Type Load Rating Two solid state relays, SPST, normally open, Form A 120 mA at 140 Vac or 180 VdcPower InputStandard Power Low Power Option Power Frequency Power Isolation Power Consumption 85-264 Vac or 90-300 Vdc10-48 Vdc or 12-32 VacDC or 47-63 Hz250V rms working, 2.3 kV rms per 1 min test 2W typical, 3W with max excitation outputMechanicalDimensions MountingElectrical Connections 129 x 104 x 22.5 mm case35 mm rail per DIN EN 50022 Plug-in screw-clamp connectorsEnvironmentalOperating Temperature Storage Temperature Relative Humidity Cooling Required 0°C to 55°C-40°C to 85°C95% at 40°C, non-condensingMount transmitters with ventilation holes at top and bottom. Leave 6 mm (1/4") between transmitters, or force air with a fan.PinoutMechanicalQA Application with Relays in Passband ModeA deviation limit (50 mΩ in this example) is set uparound both sides of a setpoint. The relay closes (oropens) when the reading falls within the deviationband, and opens (or closes) when the reading fallsoutside of this band. This mode sets up a passbandaround the setpoint and can be used for contactresistance testing in a production environment.RTD HookupIn 4-wire hookup, different pairs of leads are used to apply the excitation current and sense the voltage drop across the unknown resistance, so that the IR drop across the excitation leads is not a factor.In 3-wire hookup, the transmitter senses the combined voltage drop across the unknown resistance plus two excitation leads. It also senses the voltage drop across one excitation lead, and then subtracts twice this voltage from the combined total. This technique effectively subtracts all lead resistance and compen-sates for ambient temperature changes if the two excitation leads are identical.In 2-wire hookup, the transmitter senses the combined voltage drop across the unknown resistance and both lead wires. The voltage drop across the lead wires can be measured by shorting out the resistance during transmitter setup, and this voltage is then automatically subtracted from the combined total. However, changing resistance of the lead wires due to ambient tempera-ture changes will not be compensated.Ordering GuideCreate a model a model number in this format: LT20R1Transmitter Type LT Laureate 4-20 mA & RS232/RS485 output transmitter Main Board 2 Standard Main BoardPower0 Isolated 85-264 Vac or 90-300 Vdc 1 Isolated 10-48 Vdc or 12-32 VacResistance RangeR0 0-20 ohms (factory special fixed range) R1 0-20 ohms R2 0-200 ohms R3 0-2 kohms R4 0-20 kohms R5 0-200 kohmsR6 0-2 Mohms (factory special fixed range) R7 0-20 Mohms (factory special fixed range)Note: The same signal conditioner board can be used for resistance and RTD temperature measurement.AccessoriesCBL04 RS232 cable, 7ft. Connects RS232 screw terminals of LT transmitter to DB9port of PC.CBL02 USB to RS232 adapter cable. Combination of CBL02 and CBL04 connectstransmitter RS232 terminals to PC USB port.。
- 1、下载文档前请自行甄别文档内容的完整性,平台不提供额外的编辑、内容补充、找答案等附加服务。
- 2、"仅部分预览"的文档,不可在线预览部分如存在完整性等问题,可反馈申请退款(可完整预览的文档不适用该条件!)。
- 3、如文档侵犯您的权益,请联系客服反馈,我们会尽快为您处理(人工客服工作时间:9:00-18:30)。
China National Petroleum Corporation have bought shares in major oil sands companies
• India invested $1 billion in the Athabasca Oil Sands in 2019. Four
conducts in-situ oil shale experiments at Logan, WA. Shell researches Piceance Creek in-situ steam injection process for oil shale. Oil drops $ 20/bbl
• The second mine, operated by Syncrude, began operating in
1978. As the price of oil subsided after the Arab oil embargo, the plug was again pulled on new developments.
History of US Shale Oil 1964-1980 On-Again, Off Again
• 1964 Colony oil shale project of Tosco, Sohio and Cleveland Cliffs • 1972 Colony oil shale project halted after 270,000 bbls were produced. Occidental Petroleum
Fuels from Oil Shale and Tar Sands
• Nature of resource • Size • What’s required to produce/process • Issues
Atomic H/C Ratios
Arrow in direction of… •Solid-liquid-gas •Ease of transport •Less solids pollution •Less air contamination •Smaller viscosity
History of US Shale Oil 1981-2000
1981 Exxon begins to build Battlement Mesa company town for oil shale workers; Second Rio Blanco in-situ retort demonstration produces 24,400 bbls of shale oil 1982 Oil demand falls and crude oil prices collapse; Exxon closes Colony II due to cost and poor demand; Shell continues in-situ experiments at Red Pinnacle and labs through 1983 1985 Congress abolishes Synthetic Liquid Fuels Program 1987 Shell purchases Ertl-Mahogany and Pacific tracts in Colorado; Exxon sells Battlement Mesa for retirement community 1991 Occidental closes C-b tract project before first retort begins operation; Unocal closes Long Ridge after 5 MM bbls and 10 years for operational issues and losses. 2019 Shell tests in-situ heating on Mahogany property; defers further work on economic basis. 2000 Shell returns to Mahogany with expanded in-situ heating technology research plan (ongoing)
Economic History of the Canadian Oil Sands
• Commercial production of oil from the Athabasca oil sands
began in 1967, when Suncor opened its first mine. Development was soon inhibited by declining world oil prices.
contain ~2 x 10¹¹ bbl oil, recoverable at current price, matching the recoverable reserves of Saudi Arabia
• The 2019 Albertan tar oil production was 4 x 10⁸ bbl
investment is economical
• 1977 Oil prices drop. Superior Oil abandons plan for Meeker oil shale plant planned since 1972 • 1979 Shell, Ashland, Cleveland Cliffs and Sohio sell interests in Colony to ARCO and Tosco; Shell
Venezuela
• Conventional mining/processing • In situ injection of steam • Issues….
- Energy intensive - Several commercial processes - Cogeneration helps - Low quality crude oil
Classification Based Non-organic Sediment….
4
Nat. Gas
3
H/C Ratio
2
1
Coal
0 0
Crude Tar Sands Oil Shale
80
% Non-Organic Sediment
The Canadian Oil Sands
• The US consumes annually 7 x 10⁹ bbl oil • The Alberta Canada (Athabascan) oil (tar) sands
Indian companies are involved
The Oil Sand Crude: Bitumen
Tar Sands….
• Nature: Highly viscous hydrocarbon found with
80-90%non-organic material
• Size: large deposits in California, Alberta,
• 1974 Unocal develops new “Union B” retort process; Shell and Ashland join Colony Project. Oil
prices increase, at $41/bbl
• 1976 Unocal begins planning commercial scale plant at Parachute Creek to be built when
Shale Oil
• Oil shales are rocks rich in organic matter (kerogen) • The oil is derived through retorting, i.e. pyrolysis in the absence of
air, at 445-500 °C
Oil ….
• Nature: Semi-solid hydrocarbon (kerogen) found
with 80-90%non-organic material
• Size: enormous….130 billion bbl of oil equivalent
in Green River shale (Rocky Mountains) has 62% of world supply
• The worldwide reserves of oil shale are estimated at 2.6 trillion
barrels of recoverable oil. 1.0-1.2 trillion barrels are in the US
• Oil shale is can be burned as is, but it is a low-grade fuel • Oil shale is currently mined in Estonia, Brazil and China
Note: scale is a continuum
Oil from shale, tar sand
From Wiser, 2000
Classification Based on Viscosity….
• Roughly…. At room temperature m < 10 cp is a light oil - m < 10,000 is a heavy oil m < 106 is a tar sand oil m > 106 is bitumen