Dynamic behavior of concrete at high strain rates and pressures I experimental characterization
高强混凝土层裂数值仿真

高强混凝土层裂数值仿真焦楚杰;权长青;张国强;吕卫国;胡蝶【摘要】为军事防护工程的安全合理设计提供关键的材料特性参数,研究高强混凝土(HSC)在冲击作用下的动态性能响应,采用软件LS-DYNA对C80级HSC在霍普金森压杆(HPB)装置上的冲击层裂过程进行数值仿真分析.仿真表明:应力波在混凝土试块的传播过程中,波形基本保持不变,且峰值震荡不明显;随着冲击速度的增大,混凝土试块的破坏越来越严重;横截面内层裂裂缝由试块表面向内部扩展.数值仿真结果与试验结果有较好的相似性,基本能够反映出HSC试块在HPB冲击层裂试验过程中的受力与破坏特征,由试验结果修正后的HJC本构参数可为后续HSC层裂性能的进一步研究提供参考.【期刊名称】《中国测试》【年(卷),期】2016(042)010【总页数】6页(P34-39)【关键词】高强混凝土(HSC);层裂;数值仿真;应力波【作者】焦楚杰;权长青;张国强;吕卫国;胡蝶【作者单位】广州大学土木工程学院,广东广州510006;广东石油化工学院,广东茂名525000;广州大学土木工程学院,广东广州510006;广州大学土木工程学院,广东广州510006;广州大学土木工程学院,广东广州510006【正文语种】中文武器与防护是矛与盾的博奕关系,常规高新技术武器的更新换代,促进了防护工程材料的快速发展。
高强混凝土(high strength concrete,HSC)是指强度等级C60或以上的混凝土,21世纪以来,在军事防护工程中得到了推广应用[1]。
防护工程首要考虑的荷载是爆炸冲击,其最基本的受力模式是动态压缩与拉伸。
人们对混凝土的冲击压缩研究众多[2-4],冲击劈裂拉伸亦不少[5-6],但层裂拉伸相对较少[7]。
Ross和Tedesco等[8]利用φ75mm的SHPB装置对混凝土进行冲击压缩试验,获得了较为理想的应力-应变曲线;Y Hao和H Hao[9]对钢纤维混凝土进行冲击压缩试验,发现钢纤维对动态抗压强度的增强效应显著;李为民和许金余等[10]对玄武岩纤维混凝土进行冲击压缩试验,发现纤维体积率越大,混凝土的抗冲击性能越差;Cadoni E[11]通过试验分析了应变率对混凝土断裂特性的影响,发现试块的抗拉强度、破坏应变、断裂能都随应变率的增加而显著提高;Ožbolt J和Sharma A等[12]通过SHPB试验发现超过临界应变率后混凝土试块的抗拉强度随应变率的增加大幅提高;Brara A和Klepaczko J R等[13]采用霍普金森压杆对C35级混凝土进行层裂试验,获得了层裂强度和断裂能;赖建中和孙伟[14]对活性粉末混凝土进行冲击层裂试验,发现随冲击次数和应变率的提高,材料的损伤程度、压缩波和拉伸波衰减增加;王志亮和李洋等[15]对C75级混凝土进行层裂试验,发现应变率为9~24s-1内,随应变率的增大,混凝土层裂强度线性提高。
中高应变率下沥青混凝土动力增长系数研究
中高应变率下沥青混凝土动力增长系数研究吴俊;杜修力;李亮【摘要】为研究沥青混凝土材料在强动载条件下的动态性能,采用液压伺服试验机和霍普金森压杆(SHPB)对沥青混凝土进行了不同应变率下的压缩试验,得出了中高应变率下沥青混凝土材料的动力增长系数(DIF)和材料的动态应力-应变关系曲线.运用考虑应变率效应的弹塑性损伤模型对沥青混凝土的SHPB试验进行模拟,并通过室内试验确定本构模型中的关键参数,如强度面曲线和损伤因子等.结果表明:采用液压伺服仪和SHPB可以有效地得出沥青混凝土在中高应变率下的动力增长系数,沥青混凝土抗压强度随着应变率的提高而增加;采用室内试验可以快速准确地确定弹塑性本构模型中的相关参数,用以表述沥青混凝土的应力-应变关系;当数值模拟中采用SHPB试验中获取的动力增长系数时,将导致惯性效应的重复,故对沥青混凝土材料进行高应变率下数值模拟时,应不考虑SHPB试验中由于环向惯性效应所引起的那部分动力增长系数,即需要对SHPB试验所得的动力增长系数做修正.%To explore the dynamic properties of asphalt concrete under severe dynamic loading,the apparatus of servo hydraulic machine and split Hopkinson pressure bar (SHPB) were employed to conduct the dynamic compres-sion test for asphalt concrete material. The dynamic increase factor (DIF) and dynamic stress-strain curve were then obtained for asphalt concrete under middle to high strain rates. At same time,the advanced elasto-plastic damaged model strain rate effect was used to simulate the dynamic behavior of asphalt concrete in SHPB test. The key parame-ters for the selected material models,i.e. parameters of strength surfaces and the damage factor,were calibrated and quantified through laboratory tests.The results obtained are stated as follows: the apparatus of hydraulic servo ma-chine and SHPB can be effectively used to obtain the DIF curve for asphalt concrete under middle to high strain rates. The compressive strength of asphalt concrete increased with the enhancement of strain rates. Laboratory tests can be used to quickly determine the key parameters of advanced elasto-plastic damaged model in order to represent the dy-namic stress strain behavior of asphalt concrete. It was also found that the compressive DIFs of asphalt concrete ob-tained from SHPB test should consider contribution from two factors,one was the moisture effect at lower stain rates which was related to the first branch of DIFs curve obtained from SHPB test,and another was the lateral inertial con-finement effect at higher stain rates which was related to the second branch of DIFs curve obtained from SHPB test. However,for the numerical model of asphalt concrete under dynamic loading,adopting the DIFs curve obtained from SHPB test would duplicate the inertial effects. Hence,when the numerical simulation of asphalt concrete under high strain rate loading was conducted,the second phase of compressive DIF obtained from SHPB test should not be considered,that is,the compressive DIFs obtained from SHPB test should be modified.【期刊名称】《天津大学学报》【年(卷),期】2017(050)009【总页数】10页(P921-930)【关键词】沥青混凝土;动力增长系数;霍普金森压杆试验;损伤模型【作者】吴俊;杜修力;李亮【作者单位】北京工业大学城市与工程安全减灾教育部重点实验室,北京 100124;上海工程技术大学城市轨道交通学院,上海 201620;北京工业大学城市与工程安全减灾教育部重点实验室,北京 100124;北京工业大学城市与工程安全减灾教育部重点实验室,北京 100124【正文语种】中文【中图分类】TU502沥青混凝土由粗集料和胶结材料构成,通常用作高速公路、机场跑道等柔性道面的面层,所承受由动荷载引起的应变率为10-1 ~100,s-1左右.文献[1-3]对沥青混凝土进行了应变率为10-6~2.8×10⁻¹,s-1的单轴及三轴压缩试验.结果表明,随着应变率的增加,沥青混凝土的力学性能也发生了变化,出现屈服滞后和断裂滞后的现象,黏滞性也有所下降.必须注意的是,上述研究主要针对沥青混凝土在常规交通荷载或普通飞机起降荷载下的材料性能,当道面层承受更大的冲击荷载时,如重型飞机起降,其相应的应变率约为100,s-1.文献[4]对沥青混凝土进行了分离式霍普金森压杆(split Hopkinson pressure bar,SHPB)试验,试验中SHPB产生的应变率分别为35,s-1、75,s-1以及100,s-1.试验结果表明,当应变率为100,s-1时,其动力增长系数(dynamic increase factor,DIF)为17.文献[5]通过单轴压缩和拉伸试验研究了含30%,再生沥青材料的沥青混凝土在高应变率下的力学特性,试验发现与相应的静态值相比,沥青混凝土的抗压强度、抗拉强度和断裂能分别提高了5倍、1.5倍和15倍.然而,上述试验并未具体给出由SHPB提供的应变率.显然,现有研究均表明沥青混凝土的抗压强度将随应变率的增大而提高,且高应变率下表现出明显的塑性特性.但现有研究成果仍缺乏详细的应变率与动态增长系数关系的研究,研究不同应变率下沥青混凝土的拉、压动力增长系数有利于未来大飞机起降条件下道面结构的设计,可为确保机场跑道的功能性和安全性提供理论基础.因此,本文采用液压伺服试验机和SHPB得到不同应变率下沥青混凝土的动态抗压强度,其中液压伺服试验机产生的应变率约为10-5~1,s-1,更高的应变率由SHPB试验确定.通过静态和动态压缩试验,得出沥青混凝土的抗压DIF曲线及应力-应变曲线.同时,随着高速计算机的发展,可以对沥青混凝土在高应变率下动态特性进行数值模拟,用以进一步探究材料或结构体系在不同参数变化下动态性能演化趋势.而进行数值模拟的前提是能够建立反映材料应力-应变特性的本构模型.本次研究中,将采用考虑应变率效应的弹塑性损伤模型[6](MAT72,R3)描述沥青混凝土动态特性.通过对MAT72,R3模型用于描述沥青混凝土动态特性的适用性进行探讨,继而提出一套确定模型中各关键参数的方法.最后,基于沥青混凝土SHPB试验,采用MAT72 R3模型模拟该试验过程.通过将计算结果与试验结果进行对比,分析了DIF在数值模拟中的适用性及其对模拟结果的影响.SHPB试验技术始于19世纪,主要用于研究材料在高应变率下的动态现象,其试验装置如图1所示.SHPB系统由发射装置、子弹(短杆)、入射杆、透射杆、阻尼器和数据采集系统构成,试样夹在入射杆和透射杆之间,子弹受高压气体推动,从发射装置中以一定速度射出,撞击入射杆,在入射杆中形成一个弹性压缩波,即入射波εi(t),入射波可由位于入射杆中点的应变片A测得,当入射波传至入射杆与试样界面时,部分被反射形成反射波εr(t)、另一部分透过试样进入透射杆形成透射波εt(t),反射波属于拉伸波,同样可由应变片A测得,透射波由透射杆中点处的应变片B测得.根据一维应力波理论[7],试样的应变率与反射波的振幅成正比,而试样的应力与透射波的振幅成正比.因此,通过分析所测的反射波与透射波数据,即可得到试样在压缩波下的应力-应变数据.试样所承受的应变率取决于子弹的速度,而子弹速度的改变可通过调整子弹长度与改变气体压力相结合的方法实现,结合应变片A与应变片B测得的数据即可确定材料动态应力-应变曲线.其中应变率是指单位长度材料的变形速率,其计算公式为式中:ls为试样的初始长度;c0为杆内的纵波声速,,其中ρ为材料的密度.试样的应变可由应变率历程对时间的积分进行计算试样的应力为式中:、分别为作用在入射杆/试样界面、试样/透射杆界面的力;As为试样的初始横截面积;P1(t)和P2(t)可表示为式中:E为杆的弹性模量;A0为杆的横截面积;假定当试样产生均匀变形时,入射杆/试样界面的应力等于试样/透射杆界面的力,即P1(t)=P2(t),由此可得将式(6)分别带入式(1)~式(3)可得试样的应变率、应变和应力,即由上式可知,试样应变与应变率的计算只用到反射波εr(t),应力的计算则只用到透射波εt(t),因此,通过SHPB试验可快速确定试样的应力-应变关系.不同应变率下沥青混凝土动态抗压强度可通过液压伺服试验机和SHPB试验测得,其中液压伺服试验机产生的应变率约为10-5~1,s-1,更高的应变率由SHPB试验确定.本项研究中的沥青混凝土集料级配与沥青用量见表1.液压伺服试验中,根据ASTM 1,074制作试样并确定其参数,试样如图2所示.SHPB试验中,入射杆与透射杆直径均为80,mm,长度均为5,000,mm;试样直径75,mm,长度35,mm,长径比L/D约为0.5.由于惯性效应和试样端面摩擦效应等影响将导致试样中的应力状态偏离一维应力假定[7],因此,试样两侧均作润滑处理以减少摩擦,如图3所示.试验中采用DL750数据采集系统采集应变片A和应变片B测得的应变-时间历程曲线.图4所示为沥青混凝土SHPB试验中一组典型的入射波、反射波与透射波集合,由图可见入射波随时间变化得非常平滑,这是由于入射杆的撞击面贴有直径25,mm、厚1,mm的铝片作为脉冲形成器.与方波脉冲不同,脉冲形成器能够吸收波的高频分量,形成波形上升时间较长的入射波[8],从而使试样均匀变形并保证试样内的应力平衡.根据式(1)~(9)对试验数据进行应力重构处理,得到沥青混凝土在高应变率下的动态应力-应变曲线,如图5所示.由图可知,随着应变率增加,沥青混凝土的抗压强度有较大的提高.本文在35,℃条件下测得沥青混凝土的静态抗压强度为4.6,MPa.图6所示为不同应变率下沥青混凝土的抗压DIF曲线,图中蓝色菱形块为由液压伺服试验机测得的动力增长因数,红色菱形块为SHPB试验测得的DIF.试验中测得的最大应变率约为200,s-1,此后沥青混凝土试样的应变率不再随冲击杆速度的提高而增大,因此本次研究中沥青混凝土有效应变率范围是10-5~200,s-1.由图6可知沥青混凝土的抗压强度随应变率的增大而增大.DIF值在某一应变率处急剧增加,这种现象与混凝土材料的动态性能相似.对试验数据进行归纳综合后得到材料的DIF曲线.因此,压应力作用下沥青混凝土的DIF值可表示为3.1 数值模型试验中入射杆与透射杆的直径均为80,mm,长度均为5,000,mm,材质均为优质碳钢,假定在SHPB试验中,二者均处于弹性状态.同时在数值模型中对试样受力进行了适当的简化:在入射杆一段施加应力脉冲以代替子弹对入射杆的冲击,应力脉冲由SHPB试验中应变片A的测值确定,为梯形脉冲,本次研究中共选取两组脉冲,其具体参数详见表2.数值模型中,入射杆、透射杆以及沥青混凝土试样均采用8结点三维实体单元,混凝土试样为直径75,mm、长33,mm的圆柱体,由于结构的对称性,模型取其1/4进行计算;根据收敛性研究结果,混凝土试样网格尺寸采用1,mm×1,mm,入射杆及透射杆网格尺寸为2,mm×2,mm.图7所示即为SHPB试验模型,由图可知,试样采用细网格,为保证应力波的平稳传播,入射杆与透射杆的网格之比为常数,采用面对面接触算法(AUTOMATIC_SURFACE_TO_SUR-FACE)模拟试样与入射杆和透射杆之间的相互作用,其中摩擦系数设置为0.35[9].3.2 材料模型3.2.1 混凝土类材料模型沥青混凝土由粗集料和胶结料构成,在荷载作用下具有黏弹塑特性,其抗拉和抗压强度随温度的升高而减小,在达到破坏荷载之前,其力学行为可用Drucker-Prager屈服函数描述[1].文献[2-3]采用 Drucker-Prager屈服函数研究沥青混凝土在高应变率(0.000,1~0.070,1,s-1)下的应变率敏感特性.但上述模型未采用损伤因子描述沥青混凝土的峰后行为.文献[10]提出一种基于微观结构的黏塑性连续介质模型,该模型考虑了温度和损伤因子对沥青混凝土的影响,其计算结果与静载试验结果相吻合,但使用该模型需确定20项参数,实际应用较困难.文献[4]采用Holmquist-Johnson-Cook(HJC)模型模拟高应变率(35~100,s-1)下的沥青混凝土动态性能,但HJC模型无法模拟材料的拉伸软化特性,将显著高估材料的抗拉强度[11].目前研究中,MAT72,R3模型[6]能够有效捕捉混凝土类材料在不同加载条件下的力学行为,尤其是当材料承受强动载情况时(如爆炸荷载和高强冲击荷载),该模型能够模拟混凝土类材料的非线性行为,但不能模拟材料的温度效应.考虑到本文主要研究沥青混凝土材料在高应变率下的动态响应,暂未考虑温度的影响,因此可采用MAT72,R3模型,本文将对模型的主要特点作简要介绍.MAT72,R3模型有3个独立强度面:峰值强度面、屈服面以及残余强度面.随着静水压力p的增大,偏应力Δσ首先保持线性增大,达到屈服面后,偏应力进一步增大,直到峰值强度面后材料失效破坏,逐渐丧失载荷能力,最后达到残余强度面.各个强度面的压缩子午线可表示为式中:a0、a1、a2、a1f、a2f、a0y、a1y、a2y为拟合参数,可由三轴压缩试验数据获得,屈服面与峰值强度面之间的偏应力采用线性插值得到同样地,峰值强度面与残余强度面之间的偏应力为式中η为损伤缩放因子,其取值范围为(0,1),具体由累积有效塑性应变参数λ确定.式中:ft为混凝土静态抗拉强度;为有效塑性应变增量,,为塑性应变增量.由式(16)可知,材料受压(p0)与受拉(p<0)时的伤损不同,压缩损伤因子b1决定混凝土类材料的压缩应力-应变曲线的下降阶段,b1可由单轴压缩试验中的压缩能Gc(应力-应变曲线下的面积)确定:建立单个单元的数值模型进行单轴压缩试验,改变b1取值直至数值模拟中单轴应力-应变曲线下的面积与Gc/h相等,其中h为单元长度.拉伸损伤因子b2与材料的拉伸软化特性有关,同样由试验结果确定. b2可由单轴拉伸试验或缺口梁3点弯曲试验(three points single-edge notched beam test,SNB)中的断裂能Gf确定:建立单个单元的数值模型进行单轴拉伸试验,改变参数b2的取值,直至数值模拟中应力-应变曲线下的面积与Gf/wc相等,其中wc为裂缝宽度,通常取骨料最大粒径的1~6倍[6].除了强度屈服面,静水压力与材料体积变化之间的关系需由状态方程(equation of state,EOS)描述,本文模型采用如图8所示的分段状态方程[11]表示混凝土静水压力与体积应变的关系,其中,体积应变可表示为式中ρ0为材料的初始密度.第1阶段(ppcrush)为线弹性阶段,静水压力和体积应变满足线性关系式中:Kelastic为材料弹性状态下的体积模量;pcrush为弹性状态下极限静水压力;mcrush为弹性状态下极限弹性体积应变.第2阶段(pcrush<pplock)为过渡阶段,混凝土内的孔隙逐渐被压缩而产生塑性变形,该阶段任一点卸载的弹性体积模量可由极限弹性体积模量Kelastic和压实体积模量K1插值计算得到,K1由损伤指标Dc确定.式中:ΔDc为损伤指标的变化量;Δμp为塑性体积应变增量.故颗粒材料完全压实时塑性体积应变为式中ρgrain为颗粒密度.第3阶段(p>plock)为完全密实阶段,即混凝土内的孔隙被完全压实,p-m关系不再呈线性,引入修正的体积应变静水压力与体积应变的关系可用三次多项式表示,即式中K1、K2和K3为常数.3.2.2 沥青混凝土材料参数的确定第3.2.1节中已提到,MAT72,R3模型有3个独立强度面:屈服面、峰值强度面以及残余强度面.对沥青混凝土进行单轴及三轴压缩试验,并进行数据拟合后可确定a0、a1、a2、a1f、a2f、a0y、a1y、a2y等参数.本次研究中,当温度为35,℃时,沥青混凝土的单轴抗压强度与抗拉强度分别为4.6,MPa和0.7,MPa.通过三轴压缩试验确定其强度参数[9],如表3所示.式(14)中的η是与损伤指标λ相关的缩放因子,缩放因子在由屈服面向最大强度面过渡时,由0逐渐变为1;而由最大强度面向残余强度面过渡时,由1变为0.但现有研究表明,MAT72,R3模型中的损伤因子对(η,l)仅适用于普通混凝土而不是沥青混凝土.根据单轴压缩试验结果,沥青混凝土峰值应力对应的应变约为0.023,最终的破坏应变为0.100,而普通混凝土峰值应力对应的应变约为0.002,2,因此,应对l值进行合理地修正以描述沥青混凝土破坏时具有更高的塑性应变这一特性.多次试验后发现,将l调整至原来的10倍时,数值结果与沥青混凝土单轴抗压试验结果相吻合,修正前后的损伤因子对比如图9 所示.根据单轴压缩试验确定压缩损伤因子b1,所得应力-应变曲线如图10所示,峰值应力对应的应变约为0.023,破坏应变为0.100,高于普通混凝土,可知沥青混凝土具有较大的延性.沥青混凝土平均抗压强度为4.6,MPa,弹性模量为598,MPa.根据试验得到沥青混凝土材料在单轴压缩下的应力-应变曲线,即可确定压缩能Gc,进而通过单个单元数值模拟确定b1.本项研究中的沥青混凝土,其压缩能Gc为15.1,MPa·mm,数值模拟中单元尺寸为1,mm,故b1可确定为10.根据单轴拉伸试验或缺口梁3点弯曲试验断裂能Gf可确定拉伸损伤因子b2.本文采用缺口梁3点弯曲试验[6],其中沥青混凝土试件长宽高尺寸为400,mm×100,mm×100,mm,切口深度a为20,mm,切口深度与试件高度比值(a/W)为0.2.缺口梁试验温度为35℃,支撑形式为跨度为340,mm的简支梁.从缺口梁试验中的荷载位移曲线获得断裂硬度KIC,然后根据式(24)[12]计算获得弯曲断裂能Gf,进而可确定b2.表4给出了沥青混凝土缺口梁试验与单个单元抗拉数值试验的参数.式中E和v分别为材料的弹性模型与泊松比.状态方程参数通常由三轴压缩试验[13]和飞片撞击试验[14]确定.由于沥青混凝土状态方程的相关研究较少,已有的状态方程为沥青混凝土抗压强度fc=3.8,MPa[4],其状态方程参数[11]如表5所示.本项研究中,沥青混凝土的抗压强度fc=4.6,MPa,故可按比例法(scaling law)计算相应的压力-体积应变曲线[6],则新材料的静水压力pnew可表示为相应的卸载体积模量Ku,,new为式中:pold为已知材料的静水压力;为已知材料的卸载体积模量;r为新材料的抗压强度与已有材料抗压强度的比值.故当沥青混凝土抗压强度为fc=4.6,MPa 时,根据式(25)~(26)计算所得的状态方程参数如表6所示.3.3 塑性随动模型本文采用塑性随动(plastic-kinematic)模型[15]模拟钢材.其材料服从von Mises屈服准则,假定屈服面的大小保持不变而仅在屈服的方向上移动,当某个方向的屈服应力增大时,其相反方向的屈服应力减小.von Mises屈服准则假定初始屈服面的位置与静水压力和偏应力第2不变量有关,在偏平面内形成一个椭圆形,大小保持不变,沿屈服方向平移,屈服拉应力与屈服压应力相同.本项研究采用的钢筋材料参数见表7.在动态数值模拟计算中,对于沥青混凝土材料模型需输入DIF曲线用以模拟材料在不同应变率下的动态特性.然而对于混凝土类材料,现有研究[16-20]表明,由SHPB试验所得的DIF曲线包含两个因素的影响,即低应变率时孔隙水的影响以及高应变率时横向惯性约束的影响.本文采用的本构模型并未考虑孔隙的影响,因此数值模拟时应包含此部分曲线;而数值模型中的试件在强动载条件下将会产生惯性效应,如果数值模拟采用SHPB试验中获取的DIF曲线,将导致惯性效应的重复[9,,19-20].文献[17-18]对混凝土进行过SHPB三维数值模拟,研究表明当应变率达到200,s-1后,环向惯性效应对混凝土类材料的影响显著增加.为验证此惯性效应影响是否存在于沥青混凝土的SHPB试验中,本文拟采用3种DIF 曲线用于研究数值模拟中DIF曲线对沥青混凝土动态抗压强度的影响.数值模拟中输入的DIF曲线共有3条:①曲线1,与应变率无关的独立DIF曲线;②曲线2,由SHPB试验所获得的DIF曲线,其分段表达式为式(10);③曲线3,修正后的DIF 曲线,即应变率达到200,s-1之前的部分为DIF曲线的第1阶段,此后DIF曲线为一条水平线,修正的DIF曲线为式(27).数值模拟中采用的3条DIF曲线如图11所示.本次模拟中,考虑2组不同强度的应力波,其作用时间与大小见表2.根据SHPB 试验原理,试件动态应力将由透射杆量测的应变通过两波法获得(如式(9)所示),为了直观比较不同DIF曲线对数值模拟结果的影响,本文中仅给出数值模拟和SHPB 试验中由透射杆应变所建立的应力波变化,试件的应变参数变化可由反射杆的应变通过式(8)构建,在此不加赘述.沥青混凝土数值模拟和SHPB试验中透射杆中的应力波结果如图12所示,与SHPB试验获得的峰值应力之间具体误差分析见表8.由表8可知,采用曲线3时,其数值模型获得的应力波与SHPB试验获得的应力波更加接近.作者同时也对普通混凝土在输入不同DIF曲线下的数值模型与SHPB试验进行过对比研究,数值模型中输入的不同DIF曲线如图13所示,其中曲线1为应变率无关曲线;曲线2为CEB推荐曲线,该曲线由SHPB试验获得[21];曲线3为修正CEB曲线(见式(28)).数值模拟中在入射杆施加的应力波参数如表9所示.数值模拟和SHPB试验中透射杆中的应力波结果如图14所示,与SHPB试验[22]获得的峰值应力之间具体误差分析见表10.由表10可知,采用曲线3的数值模型应力波与SHPB试验中获得的透射波更加接近,即表明计算模型获得的普通混凝土动态抗压强度与实验更加接近,这与沥青混凝土材料在高应变率下的力学行为相同.由以上分析可知,在对混凝土类(包括沥青混凝土)结构进行动态数值模拟时(如结构在冲击和爆炸下的动态响应),数值模型中材料或构件可模拟在强动载条件下的惯性作用,即本构模型不应考虑SHPB试验中由于环向惯性效应所引起的那部分动态增长系数,故需要对SHPB试验所得的DIF做修正.式中:拟合参数;为静力条件下应变率,=1×10-5,s-1.本文采用液压伺服试验机和SHPB对沥青混凝土进行了不同应变率下的压缩试验,得出了中高应变率下沥青混凝土材料的DIF和材料动态应力-应变关系曲线.基于动态SHPB试验,采用弹塑性损伤模型对沥青混凝土的SHPB试验进行了三维数值模拟,通过比较数值模拟中试样与SHPB试验中的动态应力波曲线,表明数值模拟结果可体现试验中沥青混凝土的动态力学行为,本文提出的一套确定弹塑性损伤模型中关键参数的方法可以快速有效地描述沥青混凝土在中高应变率下的应力-应变行为.同时,对于SHPB试验所获得的DIF,应包含两个因素的影响,即低应变率时孔隙的影响以及高应变率时横向惯性约束的影响.本文所采用的弹塑性损伤本构模型并未考虑孔隙的影响,因此数值模拟时应包含此部分影响因素;而数值模型中的试件在高应变率作用下将产生惯性效应,如果数值模拟采用SHPB试验中获取的DIF曲线,将导致惯性效应的重复,其现象也在普通混凝土的SHPB数值模拟中被验证.故对沥青混凝土材料或构件进行高应变率下数值模拟时(如材料在冲击和爆炸下的动态响应),应不考虑SHPB试验中由于环向惯性效应所引起的那部分动态增长系数,即需要对SHPB试验所得的DIF做出修正.[1] Tan S,Low B,Fwa T. Behavior of asphalt concrete mixtures in triaxial compression[J]. Journal of Testing and Evaluation,1996,22(3):195-203.[2] Seibi A,Sharma M,Ali G,et al. Constitutive relations for asphalt concrete under high rates of loading[J]. Transportation Research Record,2011,1767(1):111-119.[3] Park D,Martin T,Lee H,et al. Characterization of permanent deformation of an asphalt mixture using a mechanistic approach[J]. KSCE Journal of Civil Engineering,2005,9(3):213-218.[4] Tang W,Ding Y,Yuan X. The HJC model parameters of an asphalt mixture[C] // DYMAT 2009-9th International Conference on the Mechanical and Physical Behavior of Materials Under Dynamic Loading. Brussels,Belgium,2009:1419-1423.[5] Tekalur S,Shukla A,Sadd M,et al. Mechanical characterization of a bituminous mix under quasi-static and high-strain rate loading[J]. Construction and Building Materials,2009,23(5):1795-1802.[6] Malvar L,Crawford J,Wesevich J,et al. A plasticity concrete。
英语翻译

Moisture and Strain Rate Effects on Concrete Strengthby C. Allen Ross, David M. Jerome, Joseph W. Tedesco, and Mary L. HughesThe effects of strain rate and the coupled effects of moisturecontent and strain rate on concrete strength are experimentallyinvestigated. Dry concrete exhibits clearly defined strain rate tran-sition regions for both tension and compression. Significantstrength increases in dry concrete are observed only at strain ratesabove the transition regions. Wet concrete, however, experiencesappreciable increases in strength at strain rates both below andabove the dry concrete transition region. An analytical expres-sion has been derived that accura tely predicts the tensile fracturestrength of dry concrete. This expression can be modified toaccount for moisture content in concrete.Keywords: compressive strength; concrete s; moisture content (of aggre-gate,hardened concrete, etc.); strains; tensile strength.INTRODUCTIONResults from experimental studies documenting theeffects of strain rate on dry concrete strength have beenreported in the literature as early as the mid-1900s.1-3 Sincethat time, a considerable amount of data relevant to the strainrate dependence of concrete strength has been published.Specific details of some of the methods used for data collec-tion are presented in References 4 through 14. Recent workconducted by Ross et al.15 demonstrates strain rate sensi-tivity in both compression and tension for various dryconcrete mixes. Compressive strength data for dry concreteis presented in Fig. 1. This figure illustrates that no appre-ciable strength increases occur below a strain rate range ofapproximately 60 to 80/sec. Beyond this transition region,however, significant increases in strength are exhibited.Similar data for concrete tensile strength is presented in Fig. 2.The strain rate transition region for appreciable increases indry concrete tensile strength is approximately 1 to 10/sec.The presence of excess moisture in concrete appears tohave a significant effect on both the tensile and compressivestrengths under high strain rate loading. Severalinvestigators15-17 have recently reported strength increasesin wet concrete greater than those exhibited by dry concretefor strain rates above the tran sition region. Moreover, Rossiand Boulay16 have observed substantial strength increasesfor wet concrete at strain rates below the transition region,where dry concrete has been demonstrated to be relatively insensitive. Based on their observations, Rossi and Boulay16have concluded that significant strain rate effects exist in wetconcrete specimens only. Ho wever, based on concretecompressive strength data presented by Ross et al.15 andtensile strength data presented in this paper, Rossi andBoulay’s conclusion is valid only for strain rates below thetransition region. At strain ra tes above the transition region,both wet and dry concrete stre ngth data exhibit significantstrain rate sensitivity.Dynamic fracture stress, time of fracture, and particle sizeof brittle materials as a function of strain rate are given indetail by Grady.18-20 However, these theoretical relation-ships are only applicable above some high strain rate tran-sition region that is not defined. In this paper, the relationsof Grady18-20 are reviewed for application to concrete. Inaddition, a relationship is derived to predict dry concretetensile strength from very low to high strain rates.RESEARCH SIGNIFICANCEThe results of this research demonstrate clearly definedstrain rate transition regions for the compressive and tensileACI Materials Journal, V. 93, No. 3, May-June 1996.Received February 10, 1994, and revi ewedunder Institute publication policies.Copyright © 1996, American Concrete Institut e. All rights reserved, including the makingof copies unless permission is obtained fr om the copyright proprietors. Pertinentdiscussion will be published in the March-April 1997 ACI Materials Journal ifreceived by December 1, 1996.ACI member C. Allen Ross is a professor emeritus of aerospace engineering, mechan-ics, and engineering sciences, University of Florida, and a visiting professor at HQAir Force Civil Engineering Support Agen cy, Tyndall AFB, Florida. His researchinterests include the dynamic respon se of materials and structures.David M. Jerome is a senior research engineer in Wright Laboratory’s ArmamentDirectorate at Eglin AFB, Florida. He recently obtained his doctoral degree in engi-neering mechanics at the Univ ersity of Florida. His rese arch interests include thedynamic response of ma terials and structures.ACI member Joseph W. Tedesco is Gottlieb Professor of Civil Engineering, AuburnUniversity. His research interests include structural dynamics and finite element analysis.Mary L. Hughes is a research structural engineer in Wright Laboratory’s A ir BaseSurvivability Section at Tyndall AFB, Florida. She has received BS and MSdegrees in civil engineering.strengths of dry concrete. Below these transition regionsobserved strength increases are negligible; above thesetransition regions significant strength increases are exhib-ited. The moisture content of concrete has been shown tohave an important effect on strain rate sensitivity. Wetconcrete has displayed significant increases in strength atstrain rates below the dry conc rete transition region, and atstrain rates above the transitio n region, the strength increasesobserved in wet concrete are greater than those experiencedby dry concrete. This become s significant for submergedstructures when subjected to dynamic loadings that inducestrain rates above 1.0/sec. Finally, an analytical expression isderived from fracture mechanics theory that accuratelypredicts the tensile fracture strength of dry concrete over awide range of strain rates.Brittle fracture of concreteStudies on brittle fracture of condensed matter conductedby Grady18-20 are based on the assumption that local kineticenergy plus strain energy must exceed or equal the fracturesurface energy (all on a unit mass basis) for fracture to occur.Grady’s general assumption implies that at high st rain rates all of the particles of the same size must be fractured at thesame time. The basic premise is that peak stress σs is attainedin finite time ts at some strain rate and is given by(1)where B is bulk modulus, ε is strain, is strain rate, ρ isdensity, C0 is wave speed , ts is time to fracture, andσs is tensile fracture stress. At high strain rates, the fractureparticle diameter s is assumed to be limited by the wavespeed tos ≤ 2 C0ts(2)where the factor 2 comes from the assumption that a crackone-half length (s/2) = C0ts will be propagated in each directionfrom a fracture site.Details of the derivation of energy terms are presented inReferences 18 through 20 and are reviewed here. All energyterms are reckoned per unit mass andε·σsB ερC02ε·ts==ε·B ρ⁄ ()(3)(4)(5)where KIC is fracture toughness. Using the inequality KE + U ≥Γ(6)and Eq. (1) and (2), brittle fracture or spall strength σs, spallor fracture time ts, and fragment size s are found to beKinetic energy KE1120-------- - ρε·=2s2Strain energy density Uσs22 ρ C02--------------- =Fracture surface energy Γ 3 =KIC2ρC02s-------------- -(7)(8)(9)The strain energy density term of Eq. (6) has been shownto be approximately 15 times that of the kinetic energy term.Therefore, the kinetic energy term was neglected inobtaining Eq. (7) through (9).Eq.(7) through (9) are derived using the equality condition ofEq. (2) where the minimum particle size is limited by thewave speed. It has been shown experimentally15 that thecrack velocity of concrete is a function of strain rate. Thetheoretical limiting crack velocity is shown by Broek21 to be0.38 CL where CL is the longitudinal wave velocity. From Eq.(7) the slope of log10σs versuslog10εbecomes 1/3 . This slopeagrees reasonably well with the slope of regression curvesfitted to experimental data for concrete above a certain tran-sition strain rate.σs3 ρ C0KIC 2ε·() =13⁄ts1C0----- -3KICρCε·⁄()23⁄=s 2 =3KICρC0ε·⁄()23⁄However, Eq. (7) through (9) alone do not permit a contin-uous transition from low to high strain rates. Therefore, alow strain rate brittle fracture expression is introduced, usingcrack velocity as a function of strain rate, to facilitate thetransition from low to high strain rates.Low strain rate brittle fractureCrack velocity in concrete has been shown experimentallyto increase with strain rate15 (Fig. 3). Based on this data, therelation between crack velocity uc and strain rate ε.may bepresented as(10)where k is the intercept of the log10uc axis and m is the slopeof the linear plot of log10uc versus log10. Using Eq. (10),Eq. (2) may be rewritten as(11)tThe fracture toughness KIC that appears in Eq. (7) through(9) is assumed to be the static value and remains constantwith strain rate. Dynamic toughness KID, defined as thedynamic material resistance that is dependent on crackspeed, is given by Anderson22 as(12)where uc is crack velocity, ucl is limiting crack velocity, n isan experimentally determined value of approximately 1/ 3,and KIA is crack arrest toughness, defined in the limit as uc = 0,KID = KIAArrest toughness KIA appears to be approximately 25 to 50percent of KIC. The fracture toughness KIC of concrete isgiven by John and Shah23 as(13)where KIC is expressed in MPa-m1/ and fc′is the compressivestrength in MPa. The limiting velocity ucl has been shown tobe 0.38 CL by Broek21 and is assumed to approach Rayleighwave velocity CR as proposed by Anderson.22 Rayleigh velocity is approximately 0.6 CL for a Poisson’s ratio of ing Eq. (1), (10), (13), (3 ), (4), (5), and (6), anexpression for tensile fracture strength of concrete thatincorporates both crack velocity and fracture toughness asfunctions of strain rate is obtained. This fracture strength isgiven asKID KIA1 ucucl⁄ ()n–[] ⁄ ==ACI Materials Journal/May-June 1996(14)and is a function of strain rate, but most of the other param-eters are constants depending only on the compressive strength.Eq. (14) was evaluated using the following parameters:k = 100 (Reference 15)MPa (4060 and 8270 psi), were examined and the resultingstresses were normalized with respect to the stress at =10–5.7/sec, which yields the ratio of dynamic to static tensilestrength. The resulting curves are plotted versus log10 inFig. 2, along with experimental data. Very good correlationbetween Eq. (14) and the experimental concrete tensile datawas obtained. It is worth noting that very similar results wereobtained by Weerheijm25 using a much more elaborate and complicated derivation.It is important to point out th at a singularity occurs in thedenominator ofEq. (14) with the relationship of(15)–This singularity, which would limit the strain rate rangeover which Eq. (14) would be valid, can be overcome bylimiting the tensile strength to some peak value above thecritical strain rate given by(16)The advantage in using the ratio of dynamic to staticstrength, based on the low strain rate at which the static datawas obtained, is that the tensile strength at any strain rate isdetermined by simply multip lying the ordinate of thenormalized curve by the static tensile strength. This elimi-nates the necessity of having to know the arrest fracturetoughness of the concrete.As illustrated in Fig. 1, the compression data exhibits alow to high strain rate transitio n at a strain rate of approxi-mately 10 times that observed for the tensile data presentedin Fig. 2. This high strain rate compressive data was obtainedfrom experiments conducted on a 51-mm-diameter splitHopkinsonpressure bar (SHPB) using 51-mm-long specimensof the same diameter. (See ne xt section for a descriptionof the SHPB.) On failure these specimens experienced longi-tudinal cracking, thereby su ggesting transverse tensilefailure. Assuming the longitudinal cracking is the result ofstrain due to the Poisson effect, the transverse tensile strainεtt is computed byε·uclk⁄ ()1 m⁄=For a given Poisson’s ratio of 0.2 for concrete, both theaverage transverse tensile strain and strain rate are approxi-mately one-tenth of the compressive values. This results in acompressive transition strain rate that is 10 times the tensiletransition strain rate.Moisture and strain rate effectsIn an effort to experimentally determine the effects ofmoisture coupled with strain rate on concrete strength, aseries of wet/dry tests at low and high strain rates wereconducted. Tests were performed on completely wet, one-half dry, and dry concrete specimens.Concrete blocks of 0.3 x 0.3 x 0.3 m (12 x 12 x 12 in.) werecast, cured in air for 24 hr, placed in tap water for 7 to 10days, and then cored and cut to size underwater. The 51-mm-diameter, 51-mm-long (2.0 x 2.0-in.) specimens were storedin water for a total of 30 days.Previous tests15 have been completed to determine theoven time required for completely dry and one-half-dryspecimens. Oven drying at 230 F (110 C) with successivetimed weighings produced both the dry and one-half-dryspecimens. Wet specimens remained completely submergeduntil testing.Static tests were performed on all three types of specimensusing a closed-loop material test machine. Dynamic testswere accomplished using the Wright Laboratory SHPB atTyndall AFB, Florida. All tests specimens were 51 mm in diameter and 51-mm long. The split Hopkinson pressure baris a high strain rate device c onsisting of a gas gun, striker bar,incident bar, specimen, and transmitter bar, as shown inFig. 4(a). In general, the striker bar, propelled by the gasgun, impacts the incident bar and produces an elastic stresswave that propagates to the specimen, sandwiched betweenthe incident and transmitter bars. The elastic stress waveimpinges on the specimen wher e a portion of the stress waveis reflected back into the incident bar and a portion of thewave is transmitted into the transmitter bar. Strain gagesmounted on the incident and transmitter bar record the inci-dent and transmitted stress pulses. The integrated reflectedpulse is proportional to the strain in the specimen and thetransmitted pulse is proportional to the stress in the spec-imen. Using these pulses, a d ynamic stress-strain curve maybe formed. All specimens were 51 mm (2.0 in.) in diameter and 51-mm(2.0-in.) long. Specimens were cored from a solid blockusing a diamond core bit and cut to length by sawing, andends were ground flat. No capp ing material was used in thecompression tests. A steel metal bar, approximately 6.4-mmsquare and 51-mm long ( 0.25 x 0.25 x 2.0-in.), wasmachined to fit on each end of the splitting tensile specimen,as shown in Fig. 4(c).Standard compression tests were performed by applyingthe load along the longitudinal axis of the member [Fig. 4(b)],and splitting tensile tests were performed by rotating thespecimens 90 deg about a transverse specimen axis andapplying a load along a diametrical plane of the specimen, asshown in Fig. 4(c). The dynamic splitting tensile tests in theSHPB were first performed by Ross12 and numericallyanalyzed by Tedesco et al.26Results of wet/dry tests are presented in Fig. 5 and 6 fortension and compression, respectively. In both tension andcompression, the wet and one-half-dry data exhibit greaterstrength increases at higher strain rates than at lower strainrates. In both of these figures, the data is normalized withrespect to the static strength for each type of specimen. In allthe high strain rate work by the authors,8,12,13,15,26 all data isusually normalized with respect to data obtained at lowstrain rate (static test) using the same kind of specimens. Thisresults in the use of the dyna mic increase factor, defined asthe ratio of dynamic strength to static strength. Hopefully,byusing this one may eliminate problems such as differentmaturities relative to cure time and different mix strengths.Also, it is believed that effects of scale due to both specimensize and aggregate may also be minimized by the use of thedynamic increase factor.In all cases the static strengt h of the wet and one-half-dryspecimens was less than that of the static dry tests. However,in the dynamic test the strength of the wet and one-half-dryspecimens was generally greater than the strength of the dryspecimens. The strengths of all the tensile specimens testedare shown as a function of strain rate in Fig. 7.In observing the failure mechanisms of the various tests,one generally finds that in all tensile tests the appearance ofthe fractured surface is the same. The majority of the aggregatesare not fractured but pulled free from the paste. This holdstrue even when comparing dry, one-half-dry, and wet speci-mens to each other as well as for low and high strain ratetests. For compression tests, as the strain rate increases, thenumber of fractured pieces increases and the size of the frac-tured pieces decreases. Fractured surfaces of low strain rate compression specimens are similar to those of the tensilespecimens, but at the higher ra tes, the aggregates begin toshow multiple fractures.Static strength decreases in wet concrete as compared todry concrete have been attributed to the presence of moistureforcing the gel particles apart and reducing the van der Waalsforces.27 These reduced forces are proportional to thespecific surface energy; the criti cal stress for crack formationis then reduced and the overa ll specimen strength is reduced.This explanation appears plausible at low strain rates wherethe crack has time to seek the pa th of least resistance throughthe gel and gel matrix-aggregate interfaces. However, at highstrain rates the presence of the water appears to enhanceconcrete strength. Weerheijm25 attributes the increase of dryconcrete tensile strength at hi gh strain rates to effects ofinertia. The maximum rate at which concrete can fracture islimited, and any effort to force the crack to form at a higherrate simply results in increa sed deformation and strength.The presence of moisture in concrete has a tendency toamplify the inertia effects of the wet specimens, resulting ina strength greater than the dry strength.In addition, the presence of the moisture may also increasematerial stiffness and thereby afford better coupling forwave propagation. The increased stiffness with moisture present is evidenced by the hi gher modulus obtained for wetspecimens, as reported in Re ference 17. Also, the increasedstiffness of wet concrete at hi gh strain rates should result ina higher fracture toughness. A higher fracture toughnessused in Eq. (13) would predict a higher strength for thwet concrete.CONCLUSIONSDry concrete strength is relatively strain rate insensitivebelow the transition strain rates. These transition strain ratesare between 1 and 10/sec for tension, and between 60 and80/sec for compression. Wet co ncrete, however, exhibitssignificant increases in strength at strain rates below as wellas above the transition strain rates for dry concrete. Ananalytical expression that incorporates both crack velocityand fracture toughness as functions of strain rate has beenderived that accurately predicts the tensile fracture strengthof dry concrete. ACKNOWLEDGMENTSThe experimental work for this study was conducted at Wright Laborato-ry Air Base Survivability Section, Tyndall AFB, Florida.REFERENCES1. Watstein, D., “Effect of Straining Rate on the Compressive Strengthand Elastic Properties of Concrete,” ACI J OURNAL, Proceedings V. 24,No. 4, Apr. 1953, pp. 729-744.2. Goldsmith, W.; Kenner, V. H.; and Ricketts, T. E., “DynamicBehavior of Concrete,” Experimental Mechanics, V. 66, 1966, pp. 65-69.3. Melling er, F. M., and Birkimer, D. L., “Measurements of Stress andStrain on Cylindrical Test Specimens of Rock and Concrete under Impact Loading,” Te ch n i c a l R e p o r t 4-46, Department of Army Ohio River Divi- sion Laboratory, Apr. 1966.4. Green, H., “Impact Strength of Concrete,” Institution of Civil Engi-neers, Proceedings, V. 28, 1968, pp. 731-40.5. Hughes, B. P., and Gregory, R., “Impact Strength of Concrete UsingGreen's Ballistic Pendulum,” Institution of Civil Engineers, Proceedings,V. 81, 1968, pp. 731-40.6. Hughes, B. P., and Gregory, R., “Concrete Subjected to High Rates ofLoading in Compression,” Magazine of Concrete Research, V. 24, 1972,pp. 25-36.7. Hughes, B. P., and Watson, A. J., “Compressive Strength and Ulti-mate Strain of C oncrete under Impact Loading,” Magazine of ConcreteResearch , V. 30, 1978, pp. 189-99.8. Malvern, L. E., and Ross, C. A., “Dynamic Response of Concrete andConcrete Structures,” two annual re ports and a final report for AFOSRContract F49620-83-K007, University of Florida, Gainesville, Feb. 1984,Feb. 1985, and May 1986.9. Kormeling, H. A.; Zielinski, A. J.; and Reinhardt, H. W., “Experi-ments on Concrete under Single and Repeated Uniaxial Impact Tensile Loading,” Stevin Laboratory Report 5-80-3, Delft University of Tech-nology, 2nd Printing, 1981.10. Gran, J. K.; Florence, A. L.; and Colton, J. D., “Dynamic TriaxialTests of High-Strength Concrete,” Journal of Engineering Mechanics ,V. 115, 1989, pp. 891-904.11. Suaris, W., and Shah, S. P., “P roperties of Concrete Subjected toImpact Loading,” Journal of Structural Engineering , American Society ofCivil Engineers, V. 109, No. 7, 1983, pp. 1727-1741.12. Ross, C. Engineering and Services Laboratory, Air Force Engineering and Services Center, Tyndall AFB, Florida, 1989.13. Ross, C. A.; Kuennen, S. T.; and Tedesco, J. W., “Experimental andNumerical Analysis of High Strain Rate Concrete Tensile Tests,” Micro- mechanics of Failure of Quasibrittle Materials , S. P. Shah et al., eds.,Elsevier Applied Science, London, 1990, pp. 353-364.14. Sierakowski, R. L., “Dynamic Effects in Concrete Materials,”Application of Fracture Mechan ics to Cementitious Composites , S. P.Shah, ed., Martinus Nijhoff Publishi ng, Dordrecht, Netherlands, 1985.15. Ross, C. A.; Tedesco, J. W.; and Kuennen, S. T., “Effects of StrainRate on Concrete Strength,” ACI Materials Journal, V. 92, No. 1, Jan.-Feb. 1995, pp. 37-47.16. Rossi, P., and Boulay, C., “Etude experimentale du couplagefissuration-viscoité au se in du béton,” Project No. 9, Rapport GRECO, Rheologie des Géomatériaux,1989.17. Reinhardt, H. W.; Rossi, P.; a nd van Mier, J. G. M., “Joint Inves- tigation of Concrete at High Rates of Loading,” Materials and Structures, 23, 1990, pp. 213-216.18. Grad y, E. E., and Lipkin, J., “Criteria for Impulsive Rock Fracture,”Geophysical Research Letters, V. 7, No. 4, Apr. 1980, pp. 255-258.19. Grady, D. E., “Mechanics of Fracture under High Rate Stress Loading,” Sandia National Laboratories Report SAND 82-1148C, 1983. 20. Grady, D. E., and Lipkin, J ., “Mechanisms of Dynamic Fragmen- tation: Factors Governing Fragment Size,” Sandia National Laboratories Report SAND 84-2304C, 1984.21. Broek, D., Elementary Engineering Fracture Mechanics, M. Nijhoff Publishing, Boston, 1982.22. Anderson, T. L., Fracture Mechanics: Fundamentals and Applica-tions , CRC Press, Boca Raton, Florida, 1991.23. John, R., and Shah, S. P., “Effect of High Strain Rate of Loading on Fracture Parameters of Concrete,” Proceedings of Fra cture of Concreteand Rock , Society for Experimental M echanics-Réunion Internationaledes Laboratoires d'Essais et de Recherches sur les Matérieux et les Constructions International Conference, S. P. Shah and S. E. Swartz, eds., Society of Experimental Mechanics, Bethel, Connecticut, 1987, pp. 35-52. 24. Neville, A. M., Properties of Concrete, J. Wiley & Sons, New York, 1973, pp. 313-320.25. Weerheijm, J., “Concrete under Im pact Tensile Loading and Lateral Compression,” PhD dissertation, Delf t Univers ity of Technology, Delft, Netherlands, 1992.26. Tedesco, J. W.; Ross, C. A.; and Brunair, R. M., “Numerical Anal-ysis of Dynamic Split Cylinder Tests,” Computers and Structures, V.32, No. 3-4, 1989, pp. 609-624.27. Wittmann, F. H., “Interaction of Har dened Cement Paste and Water,” Journal of the American Ceramic Society , V. 56, No. 8, Aug. 1972, pp. 409-415.28. John, R., and Shah, S. P., “Fracture of Concrete Subjected to Impact Loading,” Cement, Concrete and Aggregates , CCAGDP V. 8, No. 1, 1986, pp. 24-32. A., “Split-Hopkinson Pressure Bar Tests,” ESL-TR-88-82,。
群体不善于推理,却急于采取行动英语作文

群体不善于推理,却急于采取行动英语作文全文共3篇示例,供读者参考篇1Groups are a fundamental part of human society. We rely on them for everything from completing projects at school and work to organizing social activities. However, despite their importance, groups often struggle with reasoning and making well-thought-out decisions. Instead, they tend to rush headlong into action without properly analyzing the situation. This tendency stems from various psychological factors that come into play when people operate in a group setting.To begin with, groups often fall victim to the phenomenon known as "groupthink." This occurs when members of a group become so invested in maintaining unity and avoiding conflict that they fail to properly scrutinize ideas or consider alternative viewpoints. Critical thinking and dissenting opinions get suppressed in favor of quickly reaching a consensus, even if that consensus is flawed or based on faulty reasoning.One major driver of groupthink is the desire to conform and avoid being ostracized from the group. Humans are inherentlysocial creatures who crave a sense of belonging and acceptance. When operating in a group context, we have a strong psychological urge to go along with the majority opinion, even if we privately harbor doubts or disagreements. Nobody wants to be "that person" who rocks the boat and criticizes the group's prevailing mindset.Furthermore, highly cohesive groups often develop an "us vs. them" mentality that closes them off from outside perspectives. There is an instinctive tendency to automatically reject or dismiss viewpoints that originate from non-members. This insularity means groups frequently miss out on valuable input that could have improved their reasoning and decision-making processes.Another factor that hampers groups' ability to think critically is the diffusion of responsibility that occurs when tasks and decisions get spread across multiple individuals. No single person feels fully accountable, so a "someone else will handle it" mentality takes over. Important considerations get overlooked as group members assume others have thoroughly vetted the issue. Critical thinking falls by the wayside as the group rushes to take action without any one person being truly responsible.Additionally, groups are susceptible to cascades of misinformation and misconceptions. If inaccurate informationmanages to take hold early in the group's discussions, it can easily snowball as people inadvertently reinforce and build upon the initial flaws in reasoning. The desire to appear knowledgeable often leads people to go along with and validate false claims rather than admit ignorance. Over time, the group ends up basing decisions on fundamentally unsound premises.On a related note, groups are prone to what psychologists call the "bias blind spot"—the tendency to recognize the impacts of cognitive biases on others while failing to acknowledge how those same biases might be clouding our own judgments. In a group setting, members often arrogantly assume that their perspectives are rational and objective, while other groups or individuals are the ones being irrational and biased. This prevents the honest self-reflection required for sound reasoning.While the pitfalls described above are daunting, it would be overly cynical to assume that all groups are doomed to make poor decisions. There are concrete steps groups can take to overcome their tendency to bypass reasoning in their rush to action:First, groups must foster an environment where dissenting opinions and respectful criticism are not just tolerated, but actively encouraged. Contrarian viewpoints should be embracedas values-adding perspectives rather than threats to group cohesion. Leaders can set the tone by modeling openness to pushback and designating specific roles like "devil's advocates" to ensure all assumptions get properly scrutinized.Second, groups should implement formal practices to force themselves to slow down and think through issues methodically. For example, holding pre-mortems (envisioning potential failures before taking action) or explicitly weighing pros and cons can inject much-needed critical analysis. Building in cooling-off periods can prevent rash decisions driven by the heat of the moment.Third, groups must remain vigilantly aware of the cognitive biases and group dynamics that can cloud their reasoning. Providing education about common pitfalls like confirmation bias and groupthink can help members recognize when those insidious influences are taking hold. Similarly, clearly delineating roles and personal accountability helps prevent the diffusion of responsibility.Fourth, groups should make a concerted effort to actively solicit outside perspectives, particularly from people who may have contrasting backgrounds, experiences and viewpoints. Diverse inputs serve as an antidote to the insularity and blindspots that often beset cohesive groups. Of course, this requires members to have the humility to accept that there may be wisdom and value in perspectives that originate beyond their echo chamber.Finally, when the stakes are truly high, groups should consider leveraging the power of virtual environments and AI simulations to vet ideas and play out potential scenarios before taking real-world action. Computer modeling provides a valuable opportunity to conduct objective, consequence-free experimentation that can expose flaws in reasoning and highlight unanticipated ramifications.In summation, while the human tendency to prioritize action over painstaking reasoning is deeply ingrained, it is a tendency we must consciously fight against in our group settings. The consequences of hasty, under-analyzed decisions can potentially be disastrous, whether in business, government or other critical domains. Groups must internalize and operationalize practices that counteract their natural psychological shortcomings when it comes to methodical, evidence-based reasoning. Admitting the problem is the first step—now it's time for groups to embrace the difficult work of addressing it.篇2Groups are Poor at Reasoning, Yet Quick to ActIt's no secret that human beings are prone to irrational behavior and flawed decision-making, but when we come together in groups, these tendencies seem to get amplified. Time and again, we see communities, organizations, and entire nations rushing headlong into ill-conceived courses of action without properly examining the rationale behind their choices. This phenomenon, where groups act impetuously despite a lack of sound reasoning, is a troubling reality that warrants closer examination.One of the primary reasons why groups struggle with rational thinking is the phenomenon of "groupthink." Coined by psychologist Irving Janis, groupthink refers to the tendency of tightly-knit groups to prioritize unanimity and conformity over critical evaluation of alternative viewpoints. When members of a group become too insular and insulated from outside perspectives, they run the risk of developing an inflated sense of invulnerability and closed-mindedness.This insularity can breed a dangerous complacency, where dissenting opinions are actively discouraged or suppressed, and the group develops an "us versus them" mentality. As a result, the group's decision-making process becomes increasinglydetached from objective reality, as members reinforce each other's preconceptions and ignore contrary evidence or viewpoints. The tragic decision by U.S. policymakers to escalate American involvement in the Vietnam War, despite mounting evidence that the conflict was unwinnable, is a sobering example of groupthink in action.Another factor that contributes to groups' propensity for hasty action is the diffusion of responsibility. When individuals are part of a larger collective, they often feel less accountable for their actions and decisions. This phenomenon, known as the "bystander effect," can lead to a dangerous abdication of personal responsibility, as group members assume that someone else will take the initiative or raise objections.In large groups, this diffusion of responsibility can become even more pronounced, as individuals feel increasingly anonymous and detached from the consequences of the group's actions. This dynamic can create an environment where reckless or unethical behavior thrives, as no one feels personally accountable for the outcomes. The infamous Stanford Prison Experiment, where participants rapidly descended into abusive behavior when assigned to play the roles of guards and prisoners,provides a chilling illustration of how quickly the veneer of civility can crumble in such situations.Furthermore, groups are often susceptible to the influence of strong personalities and charismatic leaders. When a dominant individual emerges within a group, their forceful presence and persuasive abilities can sway the collective towards impulsive or misguided actions. This phenomenon, known as the "halo effect," can cause groups to overlook or ignore glaring flaws in a leader's reasoning, simply because of their perceived authority or charm.History is replete with examples of groups being led astray by charismatic figures peddling dubious or dangerous ideologies. The rise of figures like Adolf Hitler and Jim Jones, and the tragic consequences that followed, serve as cautionary tales about the perils of uncritically following a dominant personality's lead.While the tendencies towards groupthink, diffusion of responsibility, and the halo effect can all contribute to groups' proclivity for rash action, there are strategies that can be employed to counteract these dynamics. Encouraging dissent and actively seeking out contrarian viewpoints can help break the cycle of insularity and complacency that often afflicts groups.Instituting mechanisms for individual accountability, such as rotating leadership roles or employing anonymous feedback systems, can mitigate the diffusion of responsibility and foster a greater sense of personal investment in the group's decisions.Additionally, cultivating a culture of critical thinking and healthy skepticism towards authority figures can help inoculate groups against the undue influence of charismatic leaders. By actively questioning assumptions and subjecting proposed courses of action to rigorous scrutiny, groups can increase their chances of making well-reasoned and prudent decisions.Ultimately, the tendency of groups to act impetuously while neglecting sound reasoning is a complex and multifaceted issue. It is a phenomenon that touches upon fundamental aspects of human psychology and social dynamics. However, by acknowledging these tendencies and actively working to counteract them, we can strive to create groups and organizations that are better equipped to navigate the challenges of the modern world with wisdom and foresight.As students and future leaders, it is incumbent upon us to develop the critical thinking skills and intellectual humility necessary to resist the siren call of rash action and groupthink. Only by cultivating a culture of open discourse, accountability,and evidence-based decision-making can we hope to harness the collective power of groups while mitigating their inherent flaws.For in a world that grows increasingly complex and interconnected, the consequences of groups acting without prudence or reasoning can be catastrophic. It is a lesson that history has taught us time and again, often at a terrible cost. The onus is on us to learn from these past mistakes and strive to create a future where groups are not just quick to act, but wise in their judgments and deliberations.篇3People are often capable of sound reasoning when making decisions as individuals. However, when we come together as groups or collectives, our ability to think logically and arrive at well-grounded conclusions seems to deteriorate. Instead, groups tend to act swiftly and decisively, even in the absence of a clear rationale guiding their choices. This phenomenon, which I call the "group impetuosity paradox", can have significant real-world ramifications across various spheres of human activity.One domain where we can observe this paradox at play is in the realm of politics. Political parties or movements frequentlytake hard-line stances and pursue agendas that, upon closer inspection, may not withstand rigorous intellectual scrutiny. The dynamics of group polarization, wherein individual members' views become more extreme through continuous interaction and reinforcement, contribute to this effect. Each party member fortifies their convictions by drawing inspiration fromlike-minded peers, leading the group as a whole to adopt increasingly radical positions without necessarily evaluating their validity through impartial reasoning.A notable historical example that illustrates this phenomenon is the buildup to the 2003 invasion of Iraq by a coalition led by the United States. Despite a lack of concrete evidence linking the Iraqi regime to an active weapons of mass destruction program or direct ties to the 9/11 terrorist attacks, the Bush administration and its allies swiftly rallied public support for military intervention. Group dynamics within the government and the broader public discourse amplified the perceived threat and created an echo chamber that drowned out dissenting voices calling for more deliberation and fact-based analysis.In the corporate world, the group impetuosity paradox can manifest in the form of companies rushing to embrace the latestmanagement fads or disruptive technologies without carefully evaluating their long-term viability or relevance to the organization's core competencies. The fear of missing out on potential competitive advantages often outweighs the need for meticulous due diligence, leading to hasty decisions that may ultimately prove costly or misguided.Even in academia, a bastion of intellectual rigor, the allure of being part of a prestigious research group or subscribing to a dominant paradigm can sometimes overshadow objective reasoning. The desire to belong and conform can lead scholars to overlook contradictory evidence or alternative perspectives, perpetuating established theories or models long after their limitations have become apparent.So, what drives this perplexing tendency for groups to act rashly, without subjecting their choices to the scrutiny of sound reasoning? Several psychological and social factors may contribute to this phenomenon.One potential explanation lies in the diffusion of responsibility that occurs within groups. When decision-making is shared among multiple individuals, each person's sense of personal accountability can become diluted. This diminished accountability can embolden group members to adopt riskier orless well-reasoned stances, as the consequences of poor choices are perceived as being dispersed across the collective.Moreover, the desire for social cohesion and conformity within groups can suppress dissenting views and critical thinking. Individuals may prioritize maintaining harmony and solidarity over voicing potentially unpopular perspectives or challenging the group's prevailing beliefs. This pressure to conform can stifle the expression of diverse viewpoints that could otherwise enrich the group's reasoning process.Additionally, the dynamics of group polarization, as mentioned earlier, can amplify initial biases and inclinations, further distorting the group's ability to engage in impartial reasoning. As members reinforce each other's predispositions, the group's collective stance becomes increasingly entrenched, making it more difficult to consider alternative perspectives or reevaluate underlying assumptions.While the group impetuosity paradox presents a significant challenge, it is not an insurmountable one. By cultivating an awareness of this phenomenon and implementing strategies to counteract its effects, groups can enhance their capacity for sound reasoning while still benefiting from the synergies of collective decision-making.One potential remedy lies in fostering an organizational culture that actively encourages critical thinking, respectful dissent, and the open exchange of diverse perspectives. Establishing norms and processes that ensure all voices are heard and thoughtfully considered can help mitigate the risk of groupthink and premature consensus formation.Another approach involves incorporating structured decision-making frameworks or techniques that explicitly prompt groups to consider alternative viewpoints, identify potential biases, and rigorously scrutinize their underlying assumptions. Techniques such as devil's advocacy, where designated individuals purposefully challenge the group's prevailing beliefs, or pre-mortem analysis, where groups anticipate potential failures before implementing a decision, can help inject more thorough reasoning into the group's deliberations.Furthermore, embracing a culture of continuous learning and adaptability can empower groups to remain open to revising their decisions or altering course in response to new information or changing circumstances. Rather than stubbornly clinging to initial choices, groups that prioritize ongoing learning andevidence-based adjustments are better equipped to navigate complex and dynamic environments.In conclusion, the group impetuosity paradox, wherein groups tend to act hastily despite their collective potential for sound reasoning, poses a significant challenge across various domains of human endeavor. While the psychological and social factors contributing to this phenomenon are complex, recognizing its existence is the first step toward mitigating its effects. By fostering organizational cultures that value critical thinking, dissent, and diverse perspectives, incorporating structured decision-making frameworks, and embracing a mindset of continuous learning and adaptability, groups can enhance their capacity for reasoned decision-making while still benefiting from the synergies of collective wisdom.。
非线性动态方法评估重合钢筋建筑的地震抗性说明书
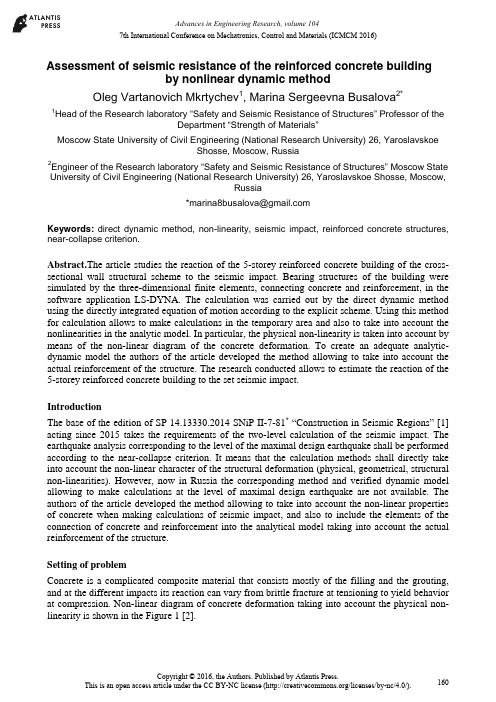
7th International Conference on Mechatronics, Control and Materials (ICMCM 2016)Assessment of seismic resistance of the reinforced concrete buildingby nonlinear dynamic methodOleg Vartanovich Mkrtychev1, Marina Sergeevna Busalova2*1Head of the Research laboratory “Safety and Seismic Resistance of Structures” Professor of theDepartment “Strength of Materials”Moscow State University of Civil Engineering (National Research University) 26, YaroslavskoeShosse, Moscow, Russia2Engineer of the Research laboratory “Safety and Seismic Resistance of Structures” Moscow State University of Civil Engineering (National Research University) 26, Yaroslavskoe Shosse, Moscow,Russia**************************Keywords:direct dynamic method, non-linearity, seismic impact, reinforced concrete structures, near-collapse criterion.Abstract.The article studies the reaction of the 5-storey reinforced concrete building of the cross-sectional wall structural scheme to the seismic impact. Bearing structures of the building were simulated by the three-dimensional finite elements, connecting concrete and reinforcement, in the software application LS-DYNA. The calculation was carried out by the direct dynamic method using the directly integrated equation of motion according to the explicit scheme. Using this method for calculation allows to make calculations in the temporary area and also to take into account the nonlinearities in the analytic model. In particular, the physical non-linearity is taken into account by means of the non-linear diagram of the concrete deformation. To create an adequate analytic-dynamic model the authors of the article developed the method allowing to take into account the actual reinforcement of the structure. The research conducted allows to estimate the reaction of the 5-storey reinforced concrete building to the set seismic impact.IntroductionThe base of the edition of SP 14.13330.2014 SNiP II-7-81* “Construction in Seismic Regions” [1] acting since 2015 takes the requirements of the two-level calculation of the seismic impact. The earthquake analysis corresponding to the level of the maximal design earthquake shall be performed according to the near-collapse criterion. It means that the calculation methods shall directly take into account the non-linear character of the structural deformation (physical, geometrical, structural non-linearities). However, now in Russia the corresponding method and verified dynamic model allowing to make calculations at the level of maximal design earthquake are not available. The authors of the article developed the method allowing to take into account the non-linear properties of concrete when making calculations of seismic impact, and also to include the elements of the connection of concrete and reinforcement into the analytical model taking into account the actual reinforcement of the structure.Setting of problemConcrete is a complicated composite material that consists mostly of the filling and the grouting, and at the different impacts its reaction can vary from brittle fracture at tensioning to yield behavior at compression. Non-linear diagram of concrete deformation taking into account the physical non-linearity is shown in the Figure 1 [2].Figure 1. Non-linear diagram of concrete deformationTo solve the problem it is necessary to have a corresponding material model. The Figure 2 shows the most complete models describing adequately the work of concrete at deformation (CSCM – Continuous Surface Cap Model) [3].Figure 2. Mathematical model of concrete (CSCM – Continuous Surface Cap Model) Concrete yield surface is described by the invariants of the stress tensor that in turn are determined from the formula (1)-(3).13J P=(1)212ij ijJ S S′=(2)313ij jk kiJ S S S′=(3)where1J is the first invariant of the stress tensor, 2J′ is the second invariant of the stress tensor, 3J′is the third invariant of the stress tensor,ijS is stress tensor, P is pressure.To study the actual reaction of the structure to the seismic impact it will not be sufficient to take into account the nonlinear properties of the concrete only. To show the real picture of thedeformation it is necessary to include the actual reinforcement into the analytic dynamic model, that is, to simulate the reinforcement cage of the building under analysis in the structural design [4].The Figure 3 shows the structural design of the five-storey reinforced concrete building of the cross-sectional wall structural scheme. All bearing structures are simulated by the three dimensional elements for concrete and bar elements for reinforcement [5].Figure 3. Structural design The Figure 4 shows the reinforcement cages of the building.Figure 4. Reinforcement cageCalculation resultsCalculation was made by the software application LS-DYNA by the direct dynamic method [6]. Equations of motion (4) were integrated directly according to the explicit scheme (5):a ++=Mu Cu Ku f (4)where u is nodal displacement vector, =uv is nodal velocity vector, =u a is nodal acceleration vector, M is mass matrix, C is damping matrix, K is rigidity matrix, af is vector of applied loads. /22t t t t t t t t t t +∆+∆+∆∆+∆=+u u v (5)This method allows to take into account the geometrical, physical and structural nonlinearities andalso to make calculations in the temporary area (dynamics in time).Three-component diagram was used as a design seismic impact corresponding to the intensity 9 earthquake (Figure 5). a)b)c)Figure 5. Three-component accelerograma)component X, b) component Y, c) component ZIsofields of the plastic deformations after the earthquake (t = 30 s) are shown in the Figure 6. Figure 6. Isofields of the plastic deformations after the earthquake at the moment of time t = 30 s The character of the plastic deformations corresponds completely to the character of cracks distribution. The Figure 6 shows that the bearing structures of the building of this structural scheme were damaged seriously but the building did not collapse, that means the conditions of the special limit state (near-collapse criterion) are satisfied. As a result of the conducted research, the seismic resistance of the building according to the near-collapse criterion was determined as intensity 9.ConclusionsThe analysis of the data obtained as a result of the research allows to conclude that for the adequate estimation of the reaction of the structure to the seismic impact it is necessary to make calculations in the nonlinear dynamic arrangement taking into account the nonlinear diagrams of concrete deformation and also to add the actual reinforcement into the structural design. The use of the offered method of the buildings earthquake calculations at the design stage will allow to estimate adequately the level of seismic resistance of the building structures.AcknowledgementsThis study was performed with the support of RF Ministry of Education and Science, grant No.7.2122.2014/K.References[1].SP 14.13330.2014 SNIP II-7-81. Stroitel'stvo v seysmicheskikh rayonakh[SP 14.13330.2014SNIP II-7-81. Construction in Seismic Areas]. (2014). Moscow: Analitik.[2].SP 63.13330.2012 SNIP 52-01-2003. Betonnye i zhelezobetonnye konstruktsii. Osnovnyepolozheniya[SP 63.13330.2012 SNIP 52-01-2003. Concrete and Reinforced Concrete Structures. Summary]. (2012). Moscow: Analitik.[3].Murray, Y.D. (2007). Users Manual for LS-DYNA Concrete Material Model 159. Report No.FHWA-HRT-05-062. U.S. Department of Transportation: Federal Highway Administration. [4].Murray, Y.D. (2007). Evaluation of LS-DYNA Concrete Material Model 159. Publication No.FHWA-HRT-05-063. U.S. Department of Transportation: Federal Highway Administration. [5].LS-DYNA. (n.d.). Keyword User’s Manual(Vol. 1, 2). Livermore Software TechnologyCorporation (LSTC).[6].Andreev, V.I., Mkrtychev, O.V., & Dzinchvelashvili, G.A. (2014). Calculation of Long SpanStructures to Seismic and Accidental Impacts in Nonlinear Dynamic Formulation. Applied Mechanics and Materials, 670-671, 764-768。
冲击载荷作用下应变率对砂岩力学性能的影响

冲击载荷作用下应变率对砂岩力学性能的影响张雨波;茅献彪;陶静;李明【摘要】借助于ANSYA/LS-DYNA数值分析软件对SHPB试验进行数值模拟,就不同应变率对砂岩力学性能的影响进行了研究,探讨了不同应变率对砂岩峰值应力、弹性模量、软化模量的影响规律,系统地分析了砂岩在不同应变率作用下的破坏规律。
结果表明:随着应变率的增加,峰值应力显著增加,表现出较强的应变率相关性;应变率增大,弹性模量随之增大,但增长速率逐渐减小;应变率越大,软化模量反而降低。
应变率·ε从632.4 s-1变化到752.5 s-1时,软化模量由-2.98降到-4.18,降低了28.71豫;当应变率·ε大于752.5 s-1为1757.9时,软化模量仅降低了5豫,说明应变率较大时变化趋势较为缓慢。
高应变率下砂岩试件的动态压缩破坏主要呈现为轴向劈裂破坏。
%Conducting a numerical simulation of the SHPB experimental data through ANSYA/LS-DYNA,the present paper studies the impact of different strain rates on the mechanical property of sandstone and investigates the effect law of different strain rates on the peak stress,elastic modulus and softening modulus of sandstone,offering a systematic analysis of the damage law of sandstone under different strain rates. The findings reveal that the peak stress shows a notable increase as the strain rate increases and that the two exhibit a strong correlation. Experimental data shows that the elastic modulus will increase as the strain rate increases,but the rate of increase will decrease gradually. When the strain rate increases,the softening modulus will actually decrease. Experimental data also shows that when the strain rate ·ε varies from 632. 4 s-1 to 752. 5 s-1 ,the softening modulus will decreasefrom -2. 98 to-4. 18,showing a 28. 71% decrease while the softening modulus only shows a 5% decrease when the value of strain rate ·ε is greater than 752. 5 s-1 at 1757. 9,which indicates that when the strain rate is comparatively greater,the var-iation trend will become relatively gentle. The experiment also finds that the dynamic compression fracture of the sample sandstone under high strain rate demonstrates the fashion of an axial splitting fracture.【期刊名称】《爆破》【年(卷),期】2014(000)003【总页数】6页(P42-46,90)【关键词】高应变率;砂岩;SHPB;力学性质【作者】张雨波;茅献彪;陶静;李明【作者单位】中国矿业大学力学与建筑工程学院,徐州221116;中国矿业大学力学与建筑工程学院,徐州221116; 中国矿业大学深部岩土力学与地下工程国家重点实验室,徐州221116;中国矿业大学深部岩土力学与地下工程国家重点实验室,徐州221116;中国矿业大学深部岩土力学与地下工程国家重点实验室,徐州221116【正文语种】中文【中图分类】TD235.1矿山运输、隧道开挖、石油钻井工程以及爆破工程都涉及到冲击载荷作用下岩石的力学特性方面的研究。
混凝土在动态双向压力作用下的强度和变形特性
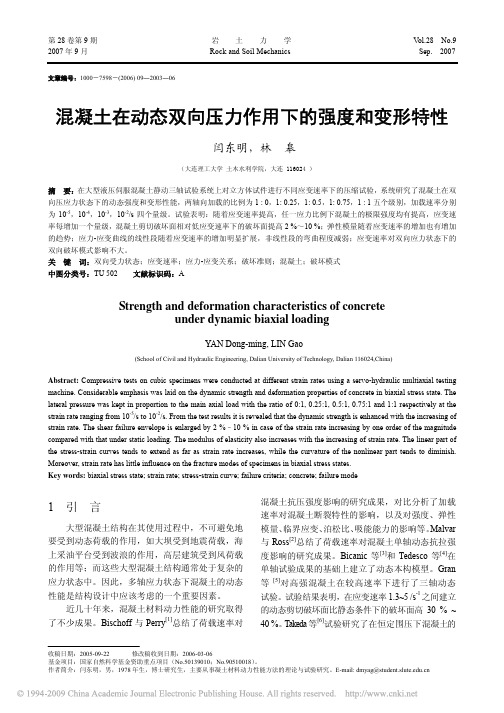
混凝土抗压强度影响的研究成果,对比分析了加载 速率对混凝土断裂特性的影响,以及对强度、弹性 模量、临界应变、泊松比、吸能能力的影响等。Malvar 与 Ross[2]总结了荷载速率对混凝土单轴动态抗拉强 度影响的研究成果。Bicanic 等[3]和 Tedesco 等[4]在 单轴试验成果的基础上建立了动态本构模型。Gran 等 [5]对高强混凝土在较高速率下进行了三轴动态 试验。试验结果表明,在应变速率 1.3~5 /s-1 之间建立 的动态剪切破坏面比静态条件下的破坏面高 30 % ~ 40 %。Takeda 等[6]试验研究了在恒定围压下混凝土的
收稿日期:2005-09-22
修改稿收到日期:2006-03-06
基金项目:国家自然科学基金资助重点项目(No.50139010;No.90510018)。
作者简介:闫东明,男,1978 年生,博士研究生,主要从事凝土材料动力性能方法的理论与试验研究。E-mail: dmyag@
泡沫混凝土动态力学性能及本构关系
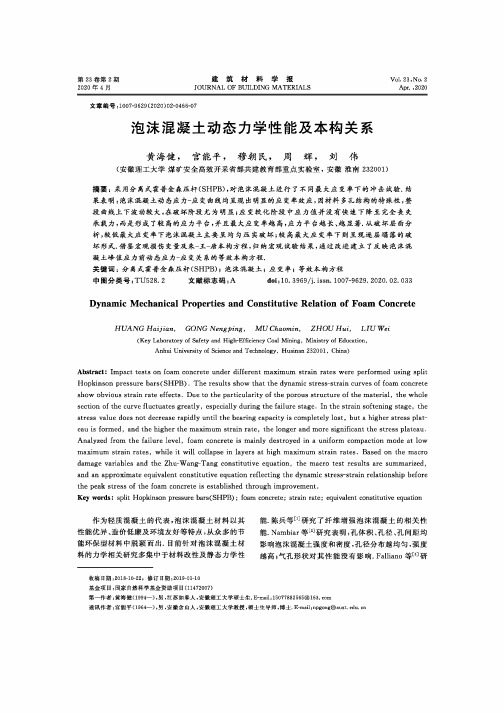
建筑材料学报JOURNAL OF BUILDING MATERIALS第23卷第2期2020年4月Vol. 23,No. 2Apr. ,2020文章编号:1007-9629(2020)02-0466-07泡沫混凝土动态力学性能及本构关系黄海健,宫能平,穆朝民,周辉,刘伟(安徽理工大学煤矿安全高效开采省部共建教育部重点实验室,安徽淮南232001)摘要:采用分离式霍普金森压杆(SHPB),对泡沫混凝土进行了不同最大应变率下的冲击试验.结果表明:泡沫混凝土动态应力-应变曲线均呈现出明显的应变率效应,因材料多孔结构的特殊性,整段曲线上下波动较大,在破坏阶段尤为明显;应变软化阶段中应力值并没有快速下降至完全丧失承载力,而是形成了较高的应力平台,并且最大应变率越高,应力平台越长、越显著.从破坏层面分析,较低最大应变率下泡沫混■凝土主要呈均匀压实破坏;较高最大应变率下则呈现逐层塡落的破坏形式.借鉴宏观损伤变量及朱-王-唐本构方程,归纳宏观试验结果,通过改进建殳了反映泡沫混 凝土峰值应力前动态应力-应变关系的等效本构方程.关键词:分离式霍普金森压杆(SHPB);泡沫混凝土;应变率;等效本构方程中图分类号:TU52& 2 文献标志码:A doi :10. 3969/j. issn. 1007-9629. 2020. 02. 033Dynamic Mechanical Properties and Constitutive Relation of Foam ConcreteHUANG Haijian, GONG N e ng p ing,MU Chaomin, ZHOU Hui, LIU Wei(Key Laboratory of Safety and High-Efficiency Coal Mining , Ministry of Education,Anhui University of Science and Technology, Huainan 232001, China)Abstract : Impact tests on foam concrete under different maximum strain rates were performed using splitHopkinson pressure bars(SHPB) . The results show that the dynamic stress-strain curves of foam concreteshow obvious strain rate effects. Due to the particularity of the porous structure of the material, the whole section of the curve fluctuates greatly, especially during the failure stage. In the strain softening stage, the stress value does not decrease rapidly until the bearing capacity is completely lost, but a higher stress plat eau is formed, and the higher the maximum strain rate, the longer and more significant the stress plateau.Analyzed from the failure level, foam concrete is mainly destroyed in a uniform compaction mode at low maximum strain rates, while it will collapse in layers at high maximum strain rates. Based on the macro damage variables and the Zhu-Wang-Tang constitutive equation, the macro test results are summarized, and an approximate equivalent constitutive equation reflecting the dynamic stress-strain relationship before the peak stress of the foam concrete is established through improvement.Key words : split Hopkinson pressure bars(SHPB); foam concrete ; strain rate; equivalent constitutive equation作为轻质混凝土的代表,泡沫混凝土材料以其性能优异、造价低廉及环境友好等特点,从众多的节能环保型材料中脱颖而出.目前针对泡沫混凝土材料的力学相关研究多集中于材料改性及静态力学性能.陈兵等E 研究了纤维增强泡沫混凝土的相关性能.Nambiar 等囚研究表明:孔体积、孔径、孔间距均影响泡沫混凝土强度和密度,孔径分布越均匀,强度越高;气孔形状对其性能没有影响.Falliano 等⑷研收稿日期=2018-10-225修订日期=2019-01-10基金项目:国家自然科学基金资助项目(11472007)第一作者:黄海健(1994—),男,江苏如皋人,安徽理工大学硕士生.E-mail : 150********@163. com通讯作者:宫能平(1964—),男,安徽含山人,安徽理工大学教授,硕士生导师,博士. E-mail ;npgong@a u S t. edu. cn第2期黄海健,等:泡沫混凝土动态力学性能及本构关系467究表明:水胶比对泡沫混凝土抗压强度影响极大;不同性质的发泡剂导致制品微结构中的空隙排列不同;与在玻璃纸片内固化相比,在空气中固化的制品抗压强度最Kearsley等⑷研究发现,泡沫混凝土的抗压强度随着密度的减小呈指数函数形式减小.在动态力学性能研究方面,袁璞等皈解决了泡沫混凝土类低阻抗多孔介质材料透射信号采集难的问题,采用灵敏系数较高的半导体应变片可较好地捕捉微弱的透射信号,实现对泡沫混凝土类多孔介质材料近似恒应变率的动态压缩试验.王建国等皈研究了分层介质对冲击的响应,发现泡沫混凝土在应力波的冲击作用下,气孔发生坍塌破坏,不仅产生了大的变形,而且吸收了大量的能量,在宏观上表现为泡沫混凝土强度较低,但具有较大的极限变形.由于泡沫混凝土越来越多地应用于防震、抗冲击设计中,因此有必要对其动态力学性能进行进一步的研究•本文以分离式霍普金森压杆(SHPB)装置为试验平台,研究了泡沫混凝土的动态力学性能,借鉴宏观损伤变量及朱-王-唐模型,通过改进、拟合建立了反映泡沫混凝土峰值应力前动态应力-应变关系的近似等效本构方程.1试验设计1.1混凝土试件的制备按照表1中的配合比将水泥、粉煤灰、水、聚丙烯(PP)纤维和外加剂混合均匀,并倒入添加量为1.2m3/m3的泡沫,搅拌成均匀流浆态,倒入模具后养护制成泡沫混凝土(FC).普通混凝土(0C)采用标准C50混凝土制备而成•经静态力学试验得到试件物理力学性能指标,见表2.表1泡沫混凝土配合比Table1Mix proportion of foam concrete kg/m3 Cement Fly ash Water PP fiber Admixture 7&022.025.00.5 6.5表2物理力学性能指标Table2Physical performance IndexSpecimenDensity/(g•cm-3)Peakstress/MPaPeak strainElasticmodulus/GPaDeformationmodulus/GPaPoisson'sratioOC 2.36753.910.00878&619 5.1990.058 FC0.726 3.2450.005460.503 1.6440.1171.2试验装置及原理1.2.1试验装置动力学试验在安徽理工大学冲击实验室的SHPB试验系统上完成,系统采用的撞击杆(子弹)、入射杆和透射杆直径均为50mm,长度分别为0.4、4.0,2.5m,材质均为高强度铝杆,密度为2.7X 10³kg/m3,弹性模量为70GPa,纵波波速为5090m/s.1.2.2试验数据处理SHPB试验通常采用三波法进行数据处理,由于试验采集的入射信号与反射信号十分接近,在计算入射端应力时,常由于测试数据误差导致计算结果偏差很大•针对泡沫混凝土材料的特殊性,采用简化的三波法进行数据处理,见式(1).")=字“力)e(i)=£[&&)(1)e(i)=$[*[ei(Z)—e r(z)—E t(^)]d^,LoJ o 式中M为时间荷⑵心(t)和£()分别为入射、反射和透射波的应变脉冲;E、C和A分别为波导杆弹性模量、波速和截面积;和人分别为试件的厚度和截面积;*£)、€&)和E&)分别为应力、应变和应变率.2泡沫混凝土冲击试验结果及分析图1为泡沫混凝土应变率时程曲线.由图1可知,在不同最大应变率(打Q下,泡沫混凝土试件均对应一段应变率平缓上升的曲线,说明加载达到了使初始压力上升平缓的目的,从而能保证泡沫混凝土动态力学分析结论具有一定的可靠性.图2为不同最大应变率下泡沫混凝土的动态应力-应变(旷小曲线,因曲线波动较大,为清晰起见,只选取其中4个展示.由图2可见:不同最大应变率下泡沫混凝土的动态应力-应变曲线形态基本相似,均具有较长的弹性上升阶段和较短的塑性变形阶段;随着最大应变率的增大,动态弹性模量增加,峰值应力逐渐变大,试样达到峰值应力后进入应变软化阶段.468建筑材料学报第23卷图1泡沫混凝土应变率时程曲线Fig. 1 Time-strain rate curves of foam concretes——156235 ——394 —5350.020.040.06 0.080.107 6 5 4 3 2 1E d H /S0图2不同最大应变率下泡沫混凝土的动态应力-应变曲线Fig. 2 Dynamic stress-strain curves of foam concrete atdifferent maximum strain rates在加载初期,泡沫混凝土试件孔壁骨架具有一定的承载能力,此阶段荷载由孔壁骨架来承受,动态应力-应变基本呈线性关系,符合胡克定律,部分入射应力波能量转化为试件的弹性变形能.但由于其内部孔洞形成了诸多自由面,导致信号采集效果不佳,噪波影响较大,造成线弹性阶段动态应力-应变曲线的较大波动.为了排除试验系统大范围误差造成的较大数据波动,同时与泡沫混凝土形成对比,设计了 1组普通混凝土的SHPB 试验,其动态应力-应变曲线如图3所示.由图3可见:普通混凝土的动态应力-应变曲线初始阶段呈上凹型,为混凝土原有裂隙和孔隙受压后逐渐闭合所致;闭合阶段过后,曲线近似为线 性;随着加载的继续,裂隙扩展,局部破坏加大,到达屈服极限,曲线斜率下降,试件切线模量逐渐降低,随后快速进入应变软化阶段•排除试验系统的大范围误差后,与普通混凝土应力-应变曲线相比,泡沫 混凝土的应力-应变曲线存在2个显著特征:第一,整段曲线上下波动较大,在破坏阶段尤为明显;第 二,在应变软化阶段,应力值并没有快速下降至完全丧失承载力,而是形成了 1个较高的应力平台,并且 最大应变率越高,应力平台表现得越长、越显著.160140120100806040200.010.02 0.03 0.04 0.05e图3普通混凝土试件的动态应力-应变曲线Fig. 3 Dynamic stress-strain curves of ordinaryconcrete specimens泡沫混凝土为多孔材料,诸多研究表明,多孔结构对材料力学性能的影响极大⑺.在受到冲击加载时,由于其内部孔洞分布不均匀,较弱的孔洞 产生破坏时,该孔洞周围产生应力集中,导致破坏在此孔洞周边沿垂宜于应力的方向向四周扩展,直至该层混凝土被均匀压实后应力释放;随着加载的继续,压实层的上、下侧孔洞相互接触,重复进行上述破坏过程直至试件整体被压实、破坏.当 首先破坏的孔洞层被压实破坏时,该层应力卸载,应力随应变增加而减小;在压实层两侧孔洞接触 并被压实的过程中,应力则随应变增加而小幅度增加.图2中,上述破坏过程表现为应力-应变曲线破坏阶段形成较明显的上下波动的应力平台;由于较高最大应变率下泡沫混凝土的破坏形式更倾向于逐层塌落破坏,因此最大应变率越大,动态应力-应变曲线中的平台越明显.泡沫混凝土动态峰值应力环、峰值应变和峰值模量Ep 随最大应变率的变化趋势如图4所示.由 图4可见:泡沫混凝土的峰值应力和峰值模量均随着最大应变率的增加而增加,在156〜540 st 最大应变率范围内,二者与最大应变率之间均近似为线性,拟 合得到关系式分别为:a P = 0. 004 83^ + 3.156 09和Ep= 0. 000 6051^+ 0. 263 68,表现出显著的应变率硬化特性;泡沫混凝土相对较软,由于应变硬化效应,峰值应变随着最大应变率的提升而下降,拟合得到关系式为 €P = -0. 234 661^ + 1104.第2期黄海健,等:泡沫混凝土动态力学性能及本构关系4694^/s-1 (a)Peak stress 100200300400500600j"(b)Peak elastic modulus0.01100.01050.01000.0095--------1-------------1----------1--------1------------1100200300400500600(c)Peak strain图4变形参数随最大应变率的变化趋势Fig.4Trend of deformation parameter with maximum strain rate为对比冲击载荷和静态载荷作用下混凝土的强度,引入动态增长因子(DIF):DIF=孕(2)J c,s式中:九用为混凝土动态抗压强度,九“为混凝土静态抗压强度.动态抗压强度可由混凝土应力-应变曲线获得,静态抗压强度取值为表2中的峰值应力.泡沫混凝土和普通混凝土动态增长因子随最大应变率变化趋势如图5所示.由图5可知,2种混凝土的动态增长因子图5动态增长因子随最大应变率变化趋势Fig.5Trend of dynamic increase factor with maximum strain rate 均随最大应变率增加而增大,与峰值应力相似,动态增长因子与最大应变率之间也有良好的线性关系.3动态本构关系由于泡沫混凝土材料的特殊性,受冲击载荷后,其应力-应变曲线上下波动较大,即使采用灵敏系数极高的半导体应变片及相应的脉冲整形技术,曲线的波动也较大b叫根据混凝土类材料的性质,线弹性阶段曲线的波动实际上可以归结为电磁干扰信号,其整体趋势是可信的•为了归纳宏观试验结果,本文建立了1个能较好反映峰值应力前动态应力-应变关系的近似等效本构模型,首先对峰值应力前动态应力-应变曲线进行降噪处理,处理后的曲线如图6所示.考虑到泡沫混凝土的应变硬化和应变率硬化等力学行为,采用朱-王-唐非线性黏弹性本构方程⑼可以对泡沫混凝土的动态力学性能进行较好的表达,朱-王-唐本构方程为:dr G—E Q£-\-a£'e(r)exp(-01+E2J e(r)exp^—\J dr(3)470建筑材料学报第23卷600.0050.0100.0150.020图6降噪处理后峰值应力前动态应力-应变曲线Fig.6Dynamic stress-strain curves before peak stress after noise reduction式中:E°g、p为非线性弹簧弹性常数;E j、E2分别为低频和高频Maxwell体的弹性模量;仇、仇为松弛时间;「为时间,0<厂<£.针对泡沫混凝土在冲击载荷下的实际力学响应和朱-王-唐本构方程中各项所代表的物理意义,对朱-王-唐本构方程做下述改进:(1)方程式的第1项,即Eoe+ae2+磴,表示冲击加载时材料的平衡态力学响应,与应变率无关.由试验结果可知,泡沫混凝土应变很小,根据文献研究取⑷,可以将非线弹性部分看作线性,相应地,将朱-王-唐本构方程中的非线性弹簧简化为线性弹簧.即可将三次多项式简化为一次线性多项式,则第1项的简化形式为E°£.(2)试验中泡沫混凝土受冲击载荷时的时间尺度以10ps计,而低频Maxwell体的松弛时间仇为10。
- 1、下载文档前请自行甄别文档内容的完整性,平台不提供额外的编辑、内容补充、找答案等附加服务。
- 2、"仅部分预览"的文档,不可在线预览部分如存在完整性等问题,可反馈申请退款(可完整预览的文档不适用该条件!)。
- 3、如文档侵犯您的权益,请联系客服反馈,我们会尽快为您处理(人工客服工作时间:9:00-18:30)。
International Journal of Impact Engineering 25(2001)869–886Dynamic behavior of concrete at high strain rates andpressures:I.experimental characterizationD.L.Grote,S.W.Park 1,M.Zhou*The Geor g e W.WoodruffSchool of Mechanical En g ineerin g ,Geor g ia Institute of Technolo g y,Atlanta,GA 30332-0405,USAReceived 1June 1999;received in revised form 16October 1999;accepted 6April 2001AbstractUnderstanding the behavior of concrete and mortar at very high strain rates is of critical importance in a range of applications.Under highly dynamic conditions,the strain-rate dependence of material response and high levels of hydrostatic pressure cause the material behavior to be significantly different from what is observed under quasistatic conditions.The behavior of concrete and mortar at strain rates of the order of 104s @1and pressures up to 1.5GPa are studied experimentally.The mortar analyzed has the same composition and processing conditions as the matrix phase in the concrete,allowing the effect of concrete microstructure to be delineated.The focus is on the effects of loading rate,hydrostatic pressure and microstructural heterogeneity on the load-carrying capacities of the materials.This experimental investigation uses split Hopkinson pressure bar (SHPB)and plate impact to achieve a range of loading rate and hydrostatic pressure.The SHPB experiments involve strain rates between 250and 1700s @1without lateral confinement and the plate impact experiments subject the materials to deformation at strain rates of the order of 104s @1with confining pressures of 1–1.5GPa.Experiments indicate that the load-carrying capacities of the concrete and mortar increase significantly with strain rate and hydrostatic pressure.The compressive flow stress of mortar at a strain rate of 1700s @1is approximately four times its quasistatic strength.Under the conditions of plate impact involving impact velocities of approximately 330ms @1,the average flow stress is 1.7GPa for the concrete and 1.3GPa for the mortar.In contrast,the corresponding unconfined quasistatic compressive strengths are only 30and 46MPa,respectively.Due to the composite microstructure of concrete,deformation and stresses are nonuniform in the specimens.The effects of material inhomogeneity on the measurements during the impact experiments are analyzed using a four-beam VISAR laser interferometer system.r 2001Elsevier Science Ltd.All rights reserved.Keywords:Concrete;Dynamic behavior;High strain rate;Hydrostatic pressure;Plate impact;Split Hopkinson pressure bar*Corresponding author.Tel.:+1-404-894-3294;fax:+1-404-894-0186.E-mail address:min.zhou@ (M.Zhou).1Currently,US Federal Highway Administration,TFHRC/HRDI/PSI,6300Georgetown Pike,McLean,VA 22101.0734-743X/01/$-see front matter r 2001Elsevier Science Ltd.All rights reserved.PII:S 0734-743X (01)00020-31.IntroductionThe response of concrete to dynamic loading is of interest in a variety of civilian and military applications.Understanding the response of concrete to impact or explosive loading is important for the successful destruction of military targets and for the effective protection of defense structures.For example,the protective shells of nuclear power plants are expected to survive the impact loading of an incoming missile or other sources.Airport runways must withstand repeated dynamic loads due to aircraft takeoffand landing.Dynamic loading on concrete structures arising from natural hazards such as tornadoes,earthquakes and ocean waves is also of great practical concern.Characterization of the behavior of concrete under impact or impulsive loading is a prerequisite for the design and analysis of these structures.When concrete is subjected to dynamic loading of sufficient amplitude,fracture,fragmentation and pulverization occur.The entire process consists of initial elastic response,plastic flow,micro-and macro-crack formation,fragmentation,rubblization and flow of rubblized granules.In addition to initial strength,the comminution and post-rubblization flow also play a significant role in determining the response of concrete during impact.For example,the effectiveness of a blast or a penetrator depends strongly on the deformation,failure and the removal of materials from the front of the projectile because the flow of the granules occurs over a major portion of the entire process.Clearly,the load-carrying capacity and energy absorbency of the target materials undergo dramatic evolution throughout the process.This evolution plays an important role in determining the performance of structures and the effectiveness of penetrators.In order to establish models that can be used to simulate and predict the response of structures made of such materials,it is necessary to quantify experimentally their response to high rates of loading under various multiaxial states of stress and to characterize their behavior throughout the stages ofdeformation.D.L.Grote et a l./Interna tiona l Journa l of Impa ct Engineering 25(2001)869–886870D.L.Grote et a l./Interna tiona l Journa l of Impa ct Engineering25(2001)869–886871 The mechanical behavior of concrete has been found to depend on strain rate over a wide range of conditions[1–19].The range of strain rate studied is usually dictated by the type of loading devices employed.For instance,Bresler and Bertero[17]and Takeda and Tachikawa[18]used hydraulic testing machines to load specimens at strain rates up to1s@1.Hughes and Gregory [14],Watstein[15]and Hughes and Watson[19]used a drop-weight impactor to achieve strain rates on the order of10s@1.Ross et al.[1–3]and Malvern et al.[10]used a split Hopkinson pressure bar and obtained deformation rates of the order of10–103s@1.These investigations concerned only strain rates under103s@1.Furthermore,the conditions do not involve the high hydrostatic pressures that exist in impact and penetration.Partly because of the absence of hydrostatic pressure,these experiments simulate only the early stages of deformation and failure such as fracture and fragmentation but do not simulate the post-fracture processes of pulverization and granularflow.The rate dependence is stronger at higher strain rates.For example,the Hopkinson bar experiments of Ross et al.[1–3]showed that there is a sharp upturn in the strength of concrete in the strain rate region of10–103s@1.Deformation and failure of concrete structures subjected to impact or penetration have also been studied[20–24].Dancygier and Yankelevsky[25]and Dancygier[26]found that high strength concrete is much more effective in resisting impact loading than normal strength concrete.Kipp et al.[27]reported an average dynamic spall strength of30MPa at impact velocities of30–220ms@1for two different concrete formulations.Kennedy[28]and Barr[29]have provided guidelines for the design and analysis of concrete structures accounting for enhanced dynamic failure resistance.Two of the most important factors influencing the behavior of concrete under dynamic conditions are strain-rate sensitivity and pressure dependence.Despite the work reported,there is still a lack of data and understanding for conditions involving very high strain rates and high hydrostatic pressures.The currently available data concern only strain rates up to103s@1 and pressures up to several hundred MPa.In order to obtain realistic characterizations and develop constitutive models for the materials in applications such as impact,penetration and blast,experimental data for conditions beyond what has been analyzed are needed.This need motivated the current study.This study is aimed at producing data for the extreme conditions not yet fully simulated in laboratory or analyzed in modeling.The approach is to use plate impact and split Hopkinson bar experiments to generate strain rates over the range of102–104s@1and pressures of up to 1.5GPa.These conditions more closely simulate those found in actual penetration and explosion.For comparison purposes,quasistatic experiments are also conducted. Since the evolution of microstructure greatly changes the behavior of concrete as deformation progresses,the experiments emphasize time-resolved analysis of the changes in the load-carrying capacities of the materials.To this end,laser interferometry and high-speed digital oscilloscopes are used to obtain deformation and stress histories in the materials.The experimental data obtained are used to calibrate the constitutive model employed in numerical simulations presented in Park et al.[30].Finite element simulations reported in the companion paper focus on the dynamic load-carrying and energy-absorbing capabilities of concrete under the conditions of the plate impact experiments discussed in this paper.The numerical simulations use a micro-mechanical model of the concrete microstructure and explicitly account for the arbitrary two-phase microstructural morphology of the concrete.The effects of individual phase properties, phase distributions and phase volume fraction on the dynamic behavior of concrete are quantitatively analyzed.2.MaterialsThe materials analyzed are a G-mix concrete with the maximum aggregate size of 9.5mm and a pure mortar.Both materials are provided by Tyndall Air Force Base and have the same processing conditions.The pure mortar also has the same composition as the mortar phase in the concrete.When tested separately,it provides a means for obtaining the response of the mortar phase in the concrete.It must be pointed out that the in situ properties of the mortar phase may not be exactly the same as those of the pure mortar,especially the degree of porosity in the matrix phase could be different from that of the pure mortar.However,a microscopic observation revealed that such difference in porosity is very small and insignificant.Cross sections of a mortar and a concrete specimen are shown in Fig.1.The composition of the fly ash contained in the pure mortar and the mortar phase in the concrete is shown in Table 1.The proportions of the fly ash components meet the requirements of ASTM and AASHTO.The gradation of aggregate used in the concrete is given in Fig.2.The volume fraction of the aggregate in the concrete is 42%.The Young’s modulus,Poisson’s ratio and density for both materials are listed in Table 2.The densities are directly measured.The Young’s modulus and Poisson’s ratio are determined through ultrasonic measurements of the wave speeds in the materials.3.Quasistatic compression experimentsFor comparison purposes,experiments are conducted to determine the quasistatic compressive strengths of concrete and mortar under conditions of uniaxial stress.Cylindrical specimens 3in in diameter and 6in in length are subjected to unconfined compression at a nominal strain rate of 10@3s @1following ASTM standard C39-96.The results of the experiments are summarized in Table 3.The quasistatic compressive strength of the mortar (approximately 46MPa)is foundtoFig.1.Cross sections of specimens before experiment (diameter:76.2mm);(a)mortar,(b)concrete.D.L.Grote et a l./Interna tiona l Journa l of Impa ct Engineering 25(2001)869–886872Table 1Composition of the fly ash used in mortar and concrete specimens ComponentsVol%ASTM C618spec.(class F)AASHTO M295spec.(class F)Silicon dioxide (SiO 2)50.7Aluminum oxide (Al 2O 3)24.9Iron oxide (Fe 2O 3)13.8Sum of SiO 2,Al 2O 3,Fe 2O 389.470.0%Min70.0%Min Calcium oxide (CaO) 3.130.0%Max Magnesium oxide (MgO)1 5.0%Max Sulfur trioxide (SO 3)0.5 5.0%Max 5.0%Max Moisture content 0.2 3.0%Max 3.0%Max Loss on ignition3.6 6.0%Max 5.0%MaxAmount retained on No.325sieve 2234.0%Max34.0%MaxSpecific gravity2.31Fig.2.Gradation of the aggregate used in the concrete specimens.Table 2Material constants for mortar and aggregateYoung’s modulus (GPa)Poisson’s ratio Density (kg/m 3)Mortar 200.22100Aggregate450.292600D.L.Grote et a l./Interna tiona l Journa l of Impa ct Engineering 25(2001)869–886873be higher than that of the concrete (approximately 30MPa).This difference in strength is related to different deformation and failure mechanisms in these materials.In concrete,microcracks readily develop and grow along the aggregate-matrix interfaces due to high stress concentrations at these interfaces and due to weak interfacial bonding [31,32].These microcracks coalesce and develop into macrocracks under increased loading,leading to a premature failure of concrete compared to mortar.The quasistatic strengths provide a baseline level with which dynamic flow stress levels will be compared.4.Split Hopkinson pressure bar experimentsTo obtain the dynamic stress-strain behavior of mortar at intermediate strain rates,a series of split Hopkinson pressure bar (SHPB)experiments are conducted.The specimens are circular cylinders 19.05mm (or 12.70mm)in diameter.Specimens with different aspect (length to diameter)ratios are used.The strain rates achieved range from 250to 1700s @1.Details of each experiment including specimen dimensions and the resulting dynamic compressive strengths are listed in Table 4.The results are used in Park et al.[30]to formulate a constitutive model for the mortar phase in the concrete.Due to the coarse aggregate in the concrete and limitations on the specimen diameter that can be accommodated by the SHPB apparatus,no SHPB experiments are conducted on the concrete.Fig.3is a schematic illustration of the SHPB apparatus used.The technique is based on the theory of one-dimensional wave propagation in an elastic bar.This split-bar configuration was developed by Kolsky [33]following the original introduction by Hopkinson [34]and a comprehensive study by Davies [35].Over the years,the technique has been extended to tensile [36]and torsional [37]configurations.The specimen is placed between the input and output bars.The striker bar,propelled by pressurized gas,impacts against the input bar.Upon impact,a compressive stress pulse is generated in the striker and input bar.The duration of the loading pulse is equal to the time for stress wave to traverse back and forth once in the striker bar.The compressive stress pulse then impinges on the specimen sandwiched between the input and output bars.Part of the incident pulse is reflected back into the input bar from the input bar/specimen interface and part of it is transmitted through the specimen into the output bar.A strain gage stationTable 3Quasistatic compression tests on concrete and mortarSpecimen #1Specimen #2Specimen #3MaterialConcrete Mortar Mortar Specimen diameter (in) 3.0 3.0 3.0Length (in)6.0 6.0 6.0Maximum load (kips)30.546.048.5Compressive strength (MPa)29.744.847.3Failure modeShearCone and shearCone and shearD.L.Grote et a l./Interna tiona l Journa l of Impa ct Engineering 25(2001)869–886874is placed on the input bar and another on the output bar.The strain gage output signals are recorded on a digital oscilloscope.Fig.4(a)shows the signals recorded from the strain gages mounted on the input and output bars during an experiment.These strain measurements are used to determine the time histories of the stress,strain and strain rate in the specimen during deformation.Specifically,the stress and strain histories are[38], respectively,sðtÞ¼E b A bAe TðtÞð1ÞTable4Split Hopkinson pressure bar experiments on mortarTest ID Strainrate(s@1)Compressivestrength(MPa)Specimendiameter,D(mm)Specimenlength,L(mm)L/D Diameter ofpressure barused(mm)14506015.211.70.7619.05 24507015.211.20.7319.05 3100011010.1 5.50.5419.05 47006510.110.5 1.0412.70 54806010.816.0 1.4812.70 65006010.815.2 1.4112.70 76506511.314.2 1.2712.70 8135012511.314.2 1.2612.70 97008511.4 6.00.5219.05 108008511.9 6.30.5319.05 119409511.7 6.00.5119.05 128509511.9 5.50.4619.05 136008012.0 5.80.4919.05 146207811.6 5.90.5119.05 159009011.5 5.90.5119.05 16135011011.4 4.80.4219.05 174005511.811.40.9719.05 182905011.911.70.9919.05 197006511.911.9 1.0019.05 203004512.117.7 1.4719.05 213506011.517.8 1.5519.05 222804012.317.3 1.419.05 234007012.012.3 1.0319.05 24105011012.0 5.60.4719.05 25150016011.2 5.50.4919.05 26170018011.4 5.10.4519.05 2768011011.411.4 1.0019.05 2866010011.412.8 1.1219.05 2983014218.7 6.20.3319.05 3088014718.7 5.80.3119.05 312507518.814.20.7519.05D.L.Grote et a l./Interna tiona l Journa l of Impa ct Engineering25(2001)869–886875Fig.3.A schematic illustration of the split Hopkinson pressure barapparatus.Fig.4.Data analysis for an SHPB experiment;(a)measured strain gage signals,(b)computed stress and strain rate histories,(c)computed strain history,and (d)stress-strain relationship.D.L.Grote et a l./Interna tiona l Journa l of Impa ct Engineering 25(2001)869–886876and’eðt Þ¼@2c bLe R ðt Þ;ð2Þwhere e T and e R denote the amplitudes of the transmitted and reflected strain pulses.E b ,A b and c b denote the Young’s modulus,cross-sectional area and longitudinal wave speed of the bars,and A and L are the cross-sectional area and length of the specimen,respectively.The expression for the strain rate in (2)may be integrated with respect to time to give the strain,i.e.,e ðt Þ¼@2c b L Z te R ðt Þd t :ð3ÞFig.4(b)shows the stress and strain rate histories obtained from the reflected and transmittedstrain histories shown in Fig.4(a).The strain rate is not constant throughout the period in general due to the dynamic nature of the experiment.An average strain rate is calculated and used for the duration of loading.The average strain rate for the test shown in Fig.4is 1500s @1.The strain history computed according to (3)is shown in Fig.4(c).The history of stress in Fig.4(b)and the history of strain in Fig.4(c)combine to yield the stress-strain relation shown in Fig.4(d).In a SHPB test,the specimen must be short enough for a uniform state of stress along the length of the specimen to be rapidly achieved during loading.Five to ten wave reverberations within the specimen are normally required [39].On the other hand,when very short specimens are used,friction between the specimen ends and the bars can play a significant role and lead to an apparent increase in strength [40].The diameter of the specimen also needs to be small relative to the wavelength of the applied load pulse for the one-dimensional wave theory to be valid without the complication of Pochhammer-Chree radial oscillations.Accounting for these restrictions,specimens with length ðL Þranging from 4.8to 18.8mm and diameter ðD Þranging from 5.1to 15.2mm are used in the experiments.These specimens have aspect ratios ðL =D Þbetween 0.31and 1.55,see Table 4.Davies and Hunter [41]suggested that the optimum aspect ratio be L =D ¼ffiffiffiffiffi34n q ,where n is the Poisson’s ratio of the specimen material.In most cases,this condition yields L =D E 0:5.In the experiments conducted here,aspect ratios between 0.31and 1.55are used to achieve a range of strain rates for the characterization of strain rate sensitivity.Multiple tests show that specimens with aspect ratios in this range yield consistent stress-strain curves for the same strain rate and no obvious size effect is observed.The stress-strain curves of mortar at four different strain rates are shown in Fig.5.Clearly,thecompressive strength increases with increasing strain rate.At a strain rate of ’e=1500s @1,the compressive strength is 160MPa or approximately 3.5times the quasistatic strength.The curves indicate strain-softening after the peak stress,reflecting fragmentation and granular flow.The similar shapes of these stress-strain curves allow the strain-rate sensitivity of the flow stress to be characterized using a simple scaling function.This strain-rate dependence of the compressive strength is shown in Fig.6.The dynamic strength values are normalized with respect to the quasistatic strength of 46MPa.The symbols denote experimental points and the continuous line represents a curve fit of the data.Due to the lack of available experimental data between the quasistatic regime and the SHPB impact regime,the following straight-line fit is employed over this range of strain rate:R ¼0:0235log ’e þ1:07;ð4ÞD.L.Grote et a l./Interna tiona l Journa l of Impa ct Engineering 25(2001)869–886877where R is the ratio of dynamic to quasistatic flow stresses and log log 10.The nonlinear part of the curve is characterized byR ¼0:882ðlog ’eÞ3@4:48ðlog ’e Þ2þ7:22ðlog ’e Þ@2:64:ð5ÞThe SHPB tests cover strain rates between 250and 1700s @1.A sharp increase in dynamicstrength is observed over the range of strain rates achieved by the SHPB experiments.ThisfindingFig.6.Strain-rate dependence of the compressive strength of mortar (normalized with respect to the quasistatic strength).D.L.Grote et a l./Interna tiona l Journa l of Impa ct Engineering 25(2001)869–886878is consistent with the results reported by Ross and coworkers [2].Different formulas have been proposed for the characterisation of the rate-sensitivity of the compressive strength of concrete.For example,CEB [42]suggested formulas for representing a slow increase in strength for strain rates up to 30s @1and a rapid increase for strain rates greater than 30s @1.Fig.6shows an extrapolated behavior beyond the strain rate of 1700s @1.This characterization is used in the numerical simulations discussed in Park et al.[30].The strain at which the maximum compressive stress occurs is an important parameter in the characterization of material behavior.There have been differing reports as to how this strain varies with strain rate.Watstein [15],Takeda and Tachikawa [43],and Kvirikadze [44]have reported that this strain increases with increasing strain rate.On the other hand,Hatano and Tsutsumi [45],Cowell [46]found that it remains essentially constant while Hughes and Watson[19],Dilger et al.[47],and Dhir and Sangha [48]have reported that it decreases with strain rate.The contradictory findings can partly be attributed to the inconsistency among the methods of loading and associated errors.For example,Watstein [15]reported that the strain at maximum stress decreases with strain rate when tests are conducted using a hydraulic machine while it increases with strain rate when the specimens are loaded with a drop-hammer.Fig.5appears to indicate that the strain at maximum stress increases slightly with increasing strain rate.However,the amount of increase is very small and may well be within the range of experimental error.In the numerical simulations reported in Park et al.[30],this strain is assumed to remain constant at different strainrates.Fig.7.Configuration of the plate impact experiment.D.L.Grote et a l./Interna tiona l Journa l of Impa ct Engineering 25(2001)869–8868795.Plate impact experimentsPlate impact provides a unique means to generate extremely high strain rates and high pressures under well-controlled conditions.In this study,normal impact experiments are conducted on circular disks of concrete and mortar to characterize their dynamic stress-carrying capacities.Average strain rates achieved are of the order of 104s @1.Since attention is focused on the time period before cylindrical unloading waves arrive at the center of the impacted specimen,the central region remains in a state of nominally uniaxial strain due to lateral inertial confinement.Confining pressures in the experiments conducted are of the order of 1–1.5GPa.A schematic illustration of the impact configuration is shown in Fig.7.The specimens are 76.2mm in diameter and 10mm in thickness.The end surfaces are lapped flat and the actual thickness is within 0.0254mm of 10mm.The specimen is placed at the front of the projectile assembly.A gap between the disk specimen and the projectile tube is provided to allow a traction-free end condition for the back surface of the specimen during the impact process.The specimen impacts against an anvil plate made of hardened Hampden tool steel.The target steel is heat-treated to have a hardness of approximately 65on the Rockwell C scale and has a thickness of 13.5mm.The projectile is propelled by pressurized helium gas.The impact occurs in a vacuum chamber located at the muzzle end of a gas gun.The velocity of the projectile V 0is measured immediately prior to impact using wire pins.Upon impact,compressive stress waves are generated in both the specimen and the anvil plate.These waves propagate from the impact face toward the rear surface of the specimen and the rear surface of the anvil plate.Upon arriving at the rear free surfaces,these compressive waves are reflected as tensile waves.The reflected tensile waves then interfere destructively with the on-going incident compressive waves,reducing the compressive stresses in the specimen.The normal particle velocities at four points on the rear surface of the anvil plate are measured using a VISAR (Velocity Interferometer System for Any Reflector)laser interferometer system with an accuracy of 72ms @1.The four simultaneous measurements are made using four independent laser probes arranged as shown in Fig.7.One probe (D)is focused at the center and the other three (A,B,andC)are focused on three points on a circle around the center.The latter probes are evenly spaced on the circle and are at a distance of 16mm from the specimen center.The simultaneous measurements of velocities at different locations provide an opportunity for analyzing the heterogeneous deformation in the specimen.The interference signals from the laser inter-ferometers are detected by photodiodes and recorded on a Tektronix TDS 784A digital oscilloscope with sampling rates of up to 4billion samples per second.The time-distance diagram shown in Fig.8indicates schematically how the waves propagate in the concrete specimen and the steel anvil plate during the impact process.The diagram is based on the one-dimensional wave propagation theory and the lines represent the longitudinal wave fronts at a given position and time.The construction of this diagram assumes that the materials involved are homogeneous and linearly elastic.This assumption does not consider the significant inelastic deformation and the material heterogeneity in the specimen.Therefore,this illustration should be viewed as an approximate representation for various wave fronts and a guide for experiment design.This diagram is also useful for the analysis and interpretation of experimental results.In addition to the nominally planar wave fronts,a cylindrical release wave also develops in the specimen and the target plate.This wave originates from the periphery at the impact face andD.L.Grote et a l./Interna tiona l Journa l of Impa ct Engineering 25(2001)869–886880propagates toward the center of the plates.This wave disrupts the well-characterized and nominally one-dimensional nature of the loading waves.In the analysis and discussion,attention is focused on the part of the experiment before this unloading wave arrives at the rear surface of the target plate ðt 7Þ.The useful window for data analysis for the velocity profiles recorded on the rear surface is therefore t 72t 1which is approximately 6.38m s for the experimental configuration used.The experiment is designed such that the target steel plate remains elastic throughout the impact process.Although the stress and velocity at the impact face are not uniform due to the inhomogeneous specimen properties,elastic wave propagation in the target plate allows the stress and velocity to become more uniform as they approach the rear surface of the target plate.This wave propagation process can be used as a mechanism for obtaining an average measure for the stress history at the impact face.According to the one-dimensional elastic wave theory,this average stress is related to the free surface particle velocity through [49].s ðt Þ¼12r cV fs ðt Þ;ð6Þwhere s ,V fs ,r and c are,respectively,the average longitudinal stress at the specimen/target interface,particle velocity at the rear surface of the target,mass density and longitudinal wave speed of the anvil material.Eq.(6)allows the history of the longitudinal stress carried by the specimen to be inferred from the velocity history measured at the rear surface of the anvilplate.Fig.8.Time-distance diagram for the plate impact experiment based on linear elastic material behavior.D.L.Grote et a l./Interna tiona l Journa l of Impa ct Engineering 25(2001)869–886881。