学术海报模板
合集下载
学术 型海报模板ppt课件

25
Under the same stress distribution, reliability curves of
different individual dispersion situations with the same
average value are almost the same, showing no
The first time that the degradation process crosses the critical
threshold value D follows an Inverse Gaussian distribution, and the
reliability
fRun(tc)tioncanDbegivte(nt
paper presents a novel method of field reliability prediction considering environment variation and product individual dispersion. Wiener diffusion process with drift was
degradation rate
with a link function such as the Arrhenius
relationship
R t aU zU R t | z, a f z f a dzda
aL
zL
The varied fen zvironmentfalafa ctors and individual dispersion can be
Type
Parameter
Average
Variance
学术会议精美海报模板-100
This is a label for the image. This is a label for the image. This is a label for the image. This is a label for the image. This is a label for the image. This is a label for the image. This is a label for the image. This is a label for the image. This is a label for the image. This is a label for the image.
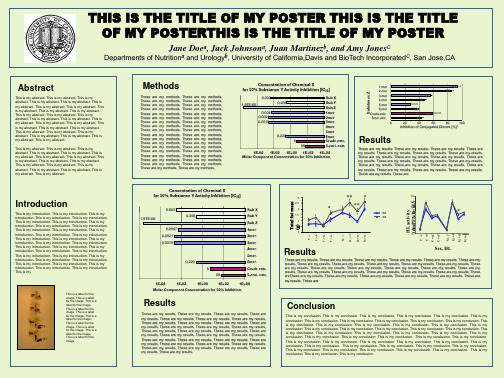
Concentration of Chemical X for 50% Substance Y Activity Inhibition [IC50]
1.97E-06
0.003
0.0047 0.0021 0.0019
0.256
0.229
5 59
Sub X Sub Y Sub Z 1mer 2mer 3mer 4mer 5mer 6mer Crude extr. 5-enri. extr.
1E-04
1E-02
1E+00
1E+02
1E+04
Molar Component Concentration for 50% Inhibition
Results
These are my results. These are my results. These are my results. These are my results. These are my results. These are my results. These are my results. These are my results. These are my results. These are my results. These are my results. These are my results. These are my results. These are my results. These are my results. These are my results. These are my results. These are my results. These are my results. These are my results. These are my results. These are my results. These are my results. These are my results. These are my results. These are my results. These are my results. These are my results. These are my results. These are my results. These are my results. These are my results. These are my results.
学术海报模版ppt Poster

paper size (46.8” high by 33.1” wide) but prints can
be scaled up or down in size to any dimension with
the same aspect ratio. For example, if you order an
Microsoft® design the software and we created all
of the original color themes, templates, and clip art
galleries. We know how to make your printed
poster look just like it does on screen. Other
and altered s. We know the secrets to avoid
those issues. So choose Genigraphics for the most
accurate reproduction available.
Figure 1. Label in 24pt Calibri.
2.5
Series 2
2
To change the font style of this text box: Click on the
border once to highlight the entire text box, then
select a different font or font size that suits you.
<your organization>
Email:
Website:
学术会议精美海报模板-78
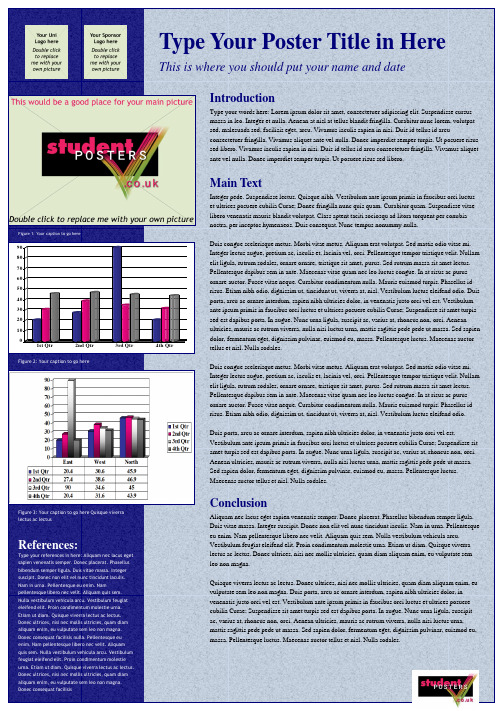
Figure 2: Your caption to go here
3rd Qtr
4th Qtr
Figure 3: Your caption to go here Quisque viverra lectus ac lectus
References:
Type your references in here: Aliquam nec lacus eget sapien venenatis semper. Donec placerat. Phasellus bibendum semper ligula. Duis vitae massa. Integer suscipit. Donec non elit vel nunc tincidunt iaculis. Nam in urna. Pellentesque eu enim. Nam pellentesque libero nec velit. Aliquam quis sem. Nulla vestibulum vehicula arcu. Vestibulum feugiat eleifend elit. Proin condimentum molestie urna. Etiam ut diam. Quisque viverra lectus ac lectus. Donec ultrices, nisi nec mollis ultricies, quam diam aliquam enim, eu vulputate sem leo non magna. Donec consequat facilisis nulla. Pellentesque eu enim. Nam pellentesque libero nec velit. Aliquam quis sem. Nulla vestibulum vehicula arcu. Vestibulum feugiat eleifend elit. Proin condimentum molestie urna. Etiam ut diam. Quisque viverra lectus ac lectus. Donec ultrices, nisi nec mollis ultricies, quam diam aliquam enim, eu vulputate sem leo non magna. Donec consequat facilisis
国际学术会议海报(poster)模板(英文)10

▪ The infants who more frequent and longer look to mother’s face in the interaction showed high emotional recognition in toddlerhood.
▪Findings from this longitudinal study suggest that infants’ social looking to their mothers during interactions may provide an opportunity to explore and percept others’ emotions.
Through social referencing, infants figure out how to feel and behave with respect to the many new events encountered everyday situations. As a spontaneous action for gathering social information, infants’ attention to others’ faces is expected to play an important role in the development of social cognition.
Method
▪Participants
Fifty-one 12-month-old infants and their mothers participated in a larger 3-year longitudinal study.
▪Procedure & Measures
学术 型海报模板ppt课件

Type
Probability Density
Gamma
TGamma
Normal
Parameter Average Var 4 24 112
4 7 21 196
14 2 30
56
7 4 32 112
4 7 35 196
28 7.5 28
56
28 10.5 28 112
28 14 28 196
Assume
is the degradation value of the ith
product at time , then
and
The effect that environmental factors and individual dispersion have on degradation process can be considered as changes in the degradation rate with a link function such as the Arrhenius relationship
where
and a.
and are density functions for z
Gamma, transformed Gamma and Normal distribution with different parameters are chosen to study the influence of temperature on reliability.
INTRODUCTION
Reliability tests are usually conducted at a certain virtual environmental stress level whereas the field environment is highly varied from the virtual environment. This paper presents a novel method of field reliability prediction considering environment variation and product individual dispersion. Wiener diffusion process with drift was used for degradation modeling and a link function which presents degradation rate is introduced to model the impact of varied environment and individual dispersion. Results indicates that properly modeled (proper distribution type and parameters) environmental stress is the fundamental of varied environment oriented reliability prediction.
国际学术会议海报张贴模板 42x60 Horizontal
Results
Xxxxxxxxxxxxxxxxxxxxxxxxxxxxxxxxxxxxxxxxxxxxxxxxxxxxxxx xxxxxxxxxxxxxxxxxxxxxxxxxxxxxxxxxxxxxxxxxxxxxxxxxxxxxxx xxxxxxxxxxxxxxxxxxxxxxxxxxxxxxxxxxxxxxxxxxxxxxxxxxxxxxx xxxxxxxxxxxxxxxxxxxxxxxxxxxxxxxxxxxxxxxxxxxxxxxxxxxxxxx xxxxxxxxxxxxxxxxxxxxxxxxxxxxxxxxxxxxxxxxxxxxxxxxxxxxxxx xxxxxxxxxxxxxxxxxxxxxxxxxxxxxxxxxxxxxxxxxxxxxxxxxxxxxxx xxxxxxxxxxxxxxxxxxxxxxxxxxxxxxxxxxxxxxxxxxxxxxxxxxxxxxx xxxxxxxxxxxxxxxxxxxxxxxxxxxxxxxxxxxxxxxxxxxxxxxxxxxxxxx xxxxxxxxxxxxxxxxxxxxxxxxxxxxxxxxxxxxxxxxxxxxxxxxxxxxxxx xxxxxxxxxxxxxxxxxxxxxxxxxxxxxxxxxxxxx xxxxxxxxxxxxxxxxxxxxxxxxxxxxxxxxxxxxxxxxxxxxxxxxxxxxxxx xxxxxxxxxxxxxxxxxxxxxxxxxxxxxxxxxxxxxxxxxxxxxxxxxxxxxxx xxxxxxxxxxxxxxxxxxxxxxxxxxxxxxxxxxxxxxxxxxxxxxxxxxxxxxx xxxxxxxxxxxxxxxxxxxxxxxxxxxxxxxxxxxxxxxxxxxxxxxxxxxxxxx xxxxxxxxxxxxxxxxxxxxxxxxxxxxxxxxxxxxxxxxxxxxxxxxxxxxxxx xxxxxxxxxxxxxxxxxxxxxxxxxxxxxxxxxxxxxxxxxxxxxxxxxxxxxxx xxxxxxxxxxxxxxxxxxxxxxxxxxxxxxxxxxxxxxxxxxxxxxxxxxxxxxx xxxxxxxxxxxxxxxxxxxxxxxxxxxxxxxxxxxxxxxxxxxxxxxxxxxxxxx xxxxxxxxxxxxxxxxxxxxxxxxxxxxxxxxxxxxxxxxxxxxxxxxxxxxxxx xxxxxxxxxxxxxxxxxxxxxxxxxxxxxxxxxxx
学术会议海报Poster模板1

Yyyyyyyyyyyyyyyyyyyyyyyyyyyyyyyyyyyyyyyyyyyyyyyyyyy yyyyyyyyyyyyyyyyyyyyyyyyyyyyyyyyyyyyyyyyyyyyyyyyyyyy yyyyyyyyyyyyyyyyyyyyyyyyyyyyyyyyyyyyyyyyyyyyyyyyyyyy yyyyYyyyyyyyyyyyyyyyyyyyyyyyyyyyyyyyyyyyyyyyyyyyyyy yyyyyyyyyyyyyyyyxxxxxxxxxxxxxxxxxxxxxxxxxxxxxxxxxxxx xxxxxxxxxxxxxxxxxxxxxxxxxxxxxxxxxxxxxxxxxxxxxxxxxxxx xxxxxxxxxxxxxxxxxxxxxxxxxxxxxxxxxxxxxxxxxxxxxxxxxxxx xxxxxxxxxxxxxxxxxxxxxxxxxxxxxxxxxxxxxxxxxxxxxxxxxxxx xxxxxxxxxxxxxxxxxxxxxxxxxxxxxxxxxxxxxxxxxxxxxxxxxxxx xxxxxxxxxxxxxxxxxxxxxxxxxxxxxxxxxxxxxxxxxxxxxxxxxxxx xxxxxxxxxxxxxxxxxxxxxxxxxx.
3. Xxxxxxxxxxxxxxxxxxxxxxxxxxxxxxxxxxxxxxxxxxxxxxxx xxxxxxxxxxxxxxxxxxxxxxxxxxxxxxxxxxxxxxxxxxxxxxxxx xxxxxxxxxxxxxxxxxxxxxx
4. Xxxxxxxxxxxxxxxxxxxxxxxxxxxxxxxxxxxxxxxxxxxxxxxx xxxxxxxxxxxxxxxxxxxxxxxxxxxxxxxxxxx
Figure #1
3. Xxxxxxxxxxxxxxxxxxxxxxxxxxxxxxxxxxxxxxxxxxxxxxxx xxxxxxxxxxxxxxxxxxxxxxxxxxxxxxxxxxxxxxxxxxxxxxxxx xxxxxxxxxxxxxxxxxxxxxx
4. Xxxxxxxxxxxxxxxxxxxxxxxxxxxxxxxxxxxxxxxxxxxxxxxx xxxxxxxxxxxxxxxxxxxxxxxxxxxxxxxxxxx
Figure #1
- 1、下载文档前请自行甄别文档内容的完整性,平台不提供额外的编辑、内容补充、找答案等附加服务。
- 2、"仅部分预览"的文档,不可在线预览部分如存在完整性等问题,可反馈申请退款(可完整预览的文档不适用该条件!)。
- 3、如文档侵犯您的权益,请联系客服反馈,我们会尽快为您处理(人工客服工作时间:9:00-18:30)。
Poster Basics/Poster Layout CSEE Format 36 x 44” Landscape
ONLY To start using this template you first need to delete most of the contents of this page. Keep the poster title, logos and at least one of the blue section headers in each column. The cleared template should now look like Figure 1. After you decide how many sections you need for your poster (Abstract, Introduction, Methods, Results, Acknowledgements), use the “copy” and “paste” commands to create the correct number of copies of the blue section headers. Move the header copies approximately to where you think they need to be on the poster, so you can get a better sense of the overall poster layout. It will help you organize your content. See Figure 2. To add text, use the text tool to draw a text box starting from the left edge of a column to the right edge and start typing in your text. You can also paste the text you may have already copied from another source. See Figure 3. Repeat the process to complete your poster.
Acknowledgements
•List multiple authors below the title; lead mentor first. Check with your mentor about the number and order of authors and acknowledgements. •Acknowledge the Department of Energy’s Workforce Development of Teachers and Scientists (or just the DOE for BLIPS) as well as Berkeley Lab, CSEE, any additional funders and your specific mentor and Lab group members. Your mentor can advise you about this.
Changing Column Depending Layout on how you lay out
your poster, you may want to change the column layout configuration. •PowerPoint versions prior to 2007 - FORMAT>SLIDE DESIGN (Figure 5). The slide design pane will open. From there you can select an alternate layout (Figure 6). •PowerPoint 2007 – HOME >LAYOUT and select from drop down menu.
A B
Content
•Abstract should appear in the first cell, and follow the format used in the version you submitted for your Bio/Abstract page (include any updates to your data) •The headings of each cell should reflect research abstract components: Abstract (same as paragraph with Bio) Introduction Methods – procedures, models or programs used; likely to be subdivided into several cells. Results – use graphs and images to convey your data as much as possible Conclusion Acknowledgements
Graphics / Images
Figure 1 Figure 2 Figure 3
Logos
•CSEE logo – tif format, most prominent, upper left •DOE logo – jpeg format, upper right •Logo of any funding source or Division, if needed, upper right, to left of DOE logo •If necessary, make the DOE logo slightly smaller in order to fit other logos in upper right corner
•Avoid pixelization when enlarging images. •Preview the printing quality of an image by zooming in at 100% or 200%, depending on the final size of the poster. What you’ll see is likely what you’ll get at printing time. (Figure 10).
1US
Mentor’s name, your name and the names of other people who have contributed to this presentation go here.
Department of Energy, 2Lawrence Berkeley National Laboratory
(Figu
Style
•Use the third person •Concise, not conversational language •Consider using bullets instead of a narrative style (except for your abstract) •Use more images, graphics, less text •Title, up to 90 pt, bold in Arial, Georgia, Palatino or Tahoma font •Headers,50– 72 pt, bold in Arial, Georgia, Palatino or Tahoma font •Internal text, 28 - 44 pt in Georgia or Palatino font •Spell out acronyms the first time they are used (generally in Abstract)
Word or other applications: •PowerPoint versions prior to 2007 EDIT>COPY, copy your chart and come back to PowerPoint. Go to EDIT>PASTE and paste the chart on the poster. •PowerPoint 2007 – INSERT and select chart or graph. •You can scale your charts and tables proportionally by holding down the Shift key and dragging in or out one of the corners.
Importing Photographs •Use the largest images you have
access to for your poster. • Avoid images downloaded from the web and avoid copying and pasting images •PowerPoint versions prior to 2007 INSERT>PICTURE>FROM FILE (Figure 9). •PowerPoint 2007 - INSERT, select from drop down menu.
TEMPLATE DESIGN © 2008
•Tell your story using graphics and images as much as possible •Crop and enlarge figures so that the data are highlighted •Remove any computer screen images i.e., the bar graph, not the tool bar •Label pictures, charts, graphs, etc., clearly and succinctly