
学术海报设计速成 Effective Academic Poster DesignPPT课件
Effective Academic Poster Design
单 位:图书馆咨询部 联系方式:
内容
• 制作学术海报之前的准备工作 • 学术海报的设计技巧 • 海报的展示
准备工作
• 选择工具软件 • 了解参展要求 • 组织和准备将展示的信息
– 文字信息 – 图、表 – 照片
准备工作—续
– 整海报的背景颜色
• 学术型通常无背景或选用“沉闷色” 背景
• 表现活泼主题可选鲜艳的颜色
– 标题和题框的颜色
• 可用渐变色打破单调
– 框和图表的颜色和背景色要协调 – PowerPoint提供的配色方案
有影响力的设计
• 尽量避免以下情况
– 多层叠合时使用过于接近的颜色
• 看不清文字内容
海海报报设设计计
– 表格里数据多时用不同底色标出想要强 调的数据
有影响力的设计—续
• 别忘记
– 介绍你自己
• 照片和Logo的使用 • 可以在最下部留下联系信息
– 致谢
• 最后的检查很重要!
– 打印错误测试
• 用A4纸打印一份检查是否有打印内容丢失
– 检查错别字!! – 请同学、朋友帮助检查
海报的展示过程简介
– 每一块内容的文字表述一定要简练
海报设计技巧 — 抓住观众
• 能否留住你的观众? – 3秒驻足+30秒笼统阅读
• 突出主题的一些方法 – 用>30%的面积表现主题, 从3米以外吸引观众
• 主题、小标题的字体要大 • 用图要多(40%)
设计的重要性?
海报设计技巧 —
有影响力的设计
• 有效地使用背景图片和颜色
感谢聆听
不足之处请大家批评指导
Please Criticize And Guide The Shortcomings
演讲人:XXXXXX 时 间:XX年XX月XX日
• 对号“入板” • 准备图钉或胶带 • 准备一些打印好的纸本(handouts)
对 号 入 板
结束语
当你尽了自己的最大努力时,失败也是伟大的, 所以不要放弃,坚持就是正确的。
When You Do Your Best, Failure Is Great, So Don'T Give Up, Stick To The End
• 图、表、小标题、文字内容排列 在栏内
有影响力的设计—续
– 在海报四周边缘留出最少4cm空白
• 以防打印不准确
有影响力的设计—续
• 清晰的,容易跟读的文字内容
– 从左到右 – 语言描述要清晰、简洁
• 假定观众不熟悉海报内容所涉及的专业
– 字体一定要加粗
• 建议字体大小
– 主标题字号 > 小标题字号 > 正文文字字号 – 主标题字号90-150,或3米以外可以看清 – 内容文字字号30-32,最好按句分成小段
– 浅色背景上的深色字最易分辨
有影响力的设计—续
• 使用图、表、照片提高直观效果
– 推荐使用量≥40% – 用彩色图:.jpg或者.emf
• 图片的质量:200-300dpi、亮度、清晰度 • 避免拉扯失真
– 图/表的内容和文字内容对应
• 编号和命名
• 注意细节上的美化
– 文本框对齐,图片整齐排列
– 一副海报里用过多种颜色
• 不推荐超过三种,照片除外
– 颜色深的水印背景 – 忙乱感觉的背景
有影响力的设计—续
• 块间和行间留出足够空白
– 便于跟读 – 能有效地把读者注意力引到关
键元素
有影响力的设计—续
块间和行间注意排列整齐和有序
– 眼睛习惯于跟从条条框框
• 整体版面分栏:
– 栏与栏之间间隔3cm – 纵向版面建议分2栏 – 横向版面建议分3栏
• 推荐使用的软件工具
– PowerPoint
• 方便文字处理,可以转成其它格式
• 注意海报的尺寸要求
– 根据会议要求、展览空间和面积 – 一般120*90cm或90*120cm
• 设置位置:office2003,文件/页面设置
准备工作—续
• 组织信息(包括文字和图、表)
– 把信息分成几个主要部分,即分块 • 主题目(title) • 简介(introduction,background) • 提出的问题(problems) • 目的(objectives)或假设(hypothesis) • 材料和方法(materials and methods) • 结果(results) • 讨论(discussions) • 结论(conclusions) • 推论(implications)
横向学术poster模板

横向学术poster模板
横向学术海报(poster)是一种常见的学术交流形式,用于展示研究成果、观点或实验数据。
以下是一个横向学术海报的模板,包含了一般情况下需要包括的几个主要部分:
1. 标题部分:
海报标题,简洁明了地概括研究内容或主题。
作者信息,包括作者姓名、所属机构和联系方式。
2. 引言部分:
研究背景,介绍研究领域的背景和相关文献。
研究问题,明确研究的目标和问题。
研究意义,阐述研究的重要性和应用价值。
3. 方法部分:
研究设计,描述实验设计、数据收集和分析方法。
样本/实验对象,介绍研究所使用的样本或实验对象。
测量指标,列出用于评估研究结果的主要指标。
4. 结果部分:
数据展示,通过图表、表格或图片等方式展示研究结果。
结果解读,对结果进行解读和分析,突出关键发现和趋势。
5. 讨论部分:
结果解释,解释结果与研究问题之间的关系。
结果比较,将结果与相关研究进行比较和讨论。
结果影响,讨论结果对该领域的影响和可能的应用。
6. 结论部分:
主要结论,总结研究的主要发现和结论。
展望未来,提出进一步研究的方向和建议。
7. 参考文献部分:
引用文献,列出在海报中引用的相关文献。
此外,还可以根据具体研究内容的需要添加其他部分,如实验
过程、图示说明等。
请注意,以上仅是一个一般的横向学术海报模板,具体的内容
和结构可以根据研究的具体要求和学术会议的规定进行调整和修改。
学术海报英语作文
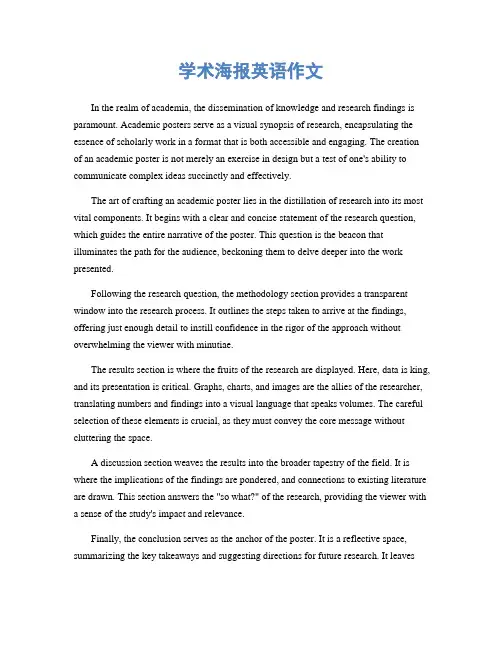
学术海报英语作文In the realm of academia, the dissemination of knowledge and research findings is paramount. Academic posters serve as a visual synopsis of research, encapsulating the essence of scholarly work in a format that is both accessible and engaging. The creation of an academic poster is not merely an exercise in design but a test of one's ability to communicate complex ideas succinctly and effectively.The art of crafting an academic poster lies in the distillation of research into its most vital components. It begins with a clear and concise statement of the research question, which guides the entire narrative of the poster. This question is the beacon that illuminates the path for the audience, beckoning them to delve deeper into the work presented.Following the research question, the methodology section provides a transparent window into the research process. It outlines the steps taken to arrive at the findings, offering just enough detail to instill confidence in the rigor of the approach without overwhelming the viewer with minutiae.The results section is where the fruits of the research are displayed. Here, data is king, and its presentation is critical. Graphs, charts, and images are the allies of the researcher, translating numbers and findings into a visual language that speaks volumes. The careful selection of these elements is crucial, as they must convey the core message without cluttering the space.A discussion section weaves the results into the broader tapestry of the field. It is where the implications of the findings are pondered, and connections to existing literature are drawn. This section answers the "so what?" of the research, providing the viewer with a sense of the study's impact and relevance.Finally, the conclusion serves as the anchor of the poster. It is a reflective space, summarizing the key takeaways and suggesting directions for future research. It leavesthe audience with a lasting impression of the work, an invitation to consider the research beyond the confines of the poster session.Throughout the poster, the language used is the vehicle for clarity. It must be precise, yet vibrant; technical, yet approachable. Each sentence is a thread in the larger tapestry of the narrative, and their interconnection is what makes the poster coherent and cohesive.In conclusion, the academic poster is a microcosm of research, a concentrated burst of scholarship that, when executed well, can inspire, inform, and ignite discourse. It is a testament to the researcher's ability to not only conduct research but to share it in a manner that resonates with an audience, regardless of their familiarity with the subject matter. The academic poster is not just a summary of work; it is an invitation to a conversation, a snapshot of a journey, and, above all, a story waiting to be told. 。
原创国际学术会议海报(poster)模板(英文)
Electric Field (V/m)
Electric Field (V/m)
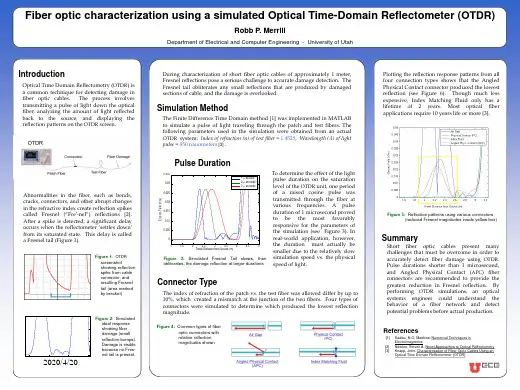
Introduction
Optical Time Domain Reflectometry (OTDR) is a common technique for detecting damage in fiber optic cables. The process involves transmitting a pulse of light down the optical fiber, analyzing the amount of light reflected back to the source, and displaying the reflection patterns on the OTDR screen.
Figure 4: Common types of fiber optic connectors with relative reflection magnitudes shown
Plotting the reflection response patterns from all four connection types shows that the Angled Physical Contact connector produced the lowest reflection (see Figure 6). Though much less expensive, Index Matching Fluid only has a lifetime of 2 years. Most optical fiber applications require 10 years life or more [3].
国际学术会议海报(poster)模板(英文)10
Method
▪Participants
Fifty-one 12-month-old infants and their mothers participated in a larger 3-year longitudinal study.
▪Procedure & Measures
At 12 months
Results
The quantity and quality of infants’ looking during interaction
▪ Twelve-month-olds were more likely to look at task objects than at their mother during teaching interactions.
▪ The infants who more frequent and longer look to mother’s face in the interaction showed high emotional recognition in toddlerhood.
▪Findings from this longitudinal study suggest that infants’ social looking to their mothers during interactions may provide an opportunity to explore and percept others’ emotions.
▪ However, longer looks to objects during social-oriented tasks were related to lower scores in recognizing highintensity emotions.
原创国际学术会议海报(poster)模板(英文)
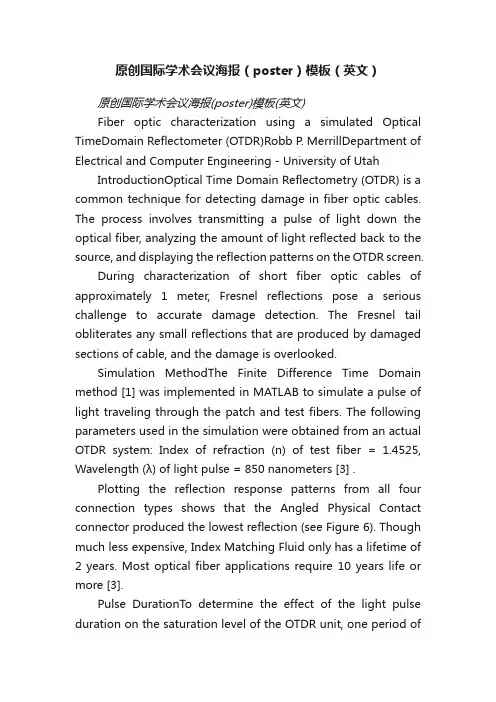
原创国际学术会议海报(poster)模板(英文)原创国际学术会议海报(poster)模板(英文)Fiber optic characterization using a simulated Optical TimeDomain Reflectometer (OTDR)Robb P. MerrillDepartment of Electrical and Computer Engineering - University of Utah IntroductionOptical Time Domain Reflectometry (OTDR) is a common technique for detecting damage in fiber optic cables. The process involves transmitting a pulse of light down the optical fiber, analyzing the amount of light reflected back to the source, and displaying the reflection patterns on the OTDR screen.During characterization of short fiber optic cables of approximately 1 meter, Fresnel reflections pose a serious challenge to accurate damage detection. The Fresnel tail obliterates any small reflections that are produced by damaged sections of cable, and the damage is overlooked.Simulation MethodThe Finite Difference Time Domain method [1] was implemented in MATLAB to simulate a pulse of light traveling through the patch and test fibers. The following parameters used in the simulation were obtained from an actual OTDR system: Index of refraction (n) of test fiber = 1.4525, Wavelength (λ) of light pulse = 850 nanometers [3] .Plotting the reflection response patterns from all four connection types shows that the Angled Physical Contact connector produced the lowest reflection (see Figure 6). Though much less expensive, Index Matching Fluid only has a lifetime of 2 years. Most optical fiber applications require 10 years life or more [3].Pulse DurationT o determine the effect of the light pulse duration on the saturation level of the OTDR unit, one period ofa raised cosine pulse was transmitted through the fiber at various frequencies. A pulse duration of 1 microsecond proved to be the most favorably responsive for the parameters of the simulation (see Figure 3). In realworld application, however, the duration must actually be smaller due to the relatively slow simulation speed vs. the physical speed of light.OTDR Saturation at Increased Pulse Durations 0.035 1 second 0.03 2 seconds 3 secondsAbnormalities in the fiber, such as bends, cracks, connectors, and other abrupt changes in the refractive index create reflection spikes called Fresnel ( Fre'-nel ) reflections [2]. After a spike is detected, a significant delay occurs when the reflectometer ‘settles down’ from its saturated state. This delay is called a Fresnel tail (Figure 1).Figure 1: OTDR screenshot showing reflection spike from cable connector, and resulting Fresnel tail (area marked by bracket)0.025Electric Field (V/m)0.020.01510.01Figure 5: Reflection patterns using various connectors (reduced Fresnel magnitudes inside yellow box)0.0050 1 1.5 2 2.5 3 3.5 4 Travel Distance from Source (m) 4.5 5SummaryShort fiber optic cables present many challenges that must be overcome in order to accurately detect fiber damage using OTDR. Pulse durations shorter than 1 microsecond, and Angled Physical Contact (APC) fiber connectors are recommended to provide the greatestreduction in Fresnel reflection. By performing OTDRsimulations, an optical systems engineer could understand the behavior of a fiber network and detect potential problems before actual production.Figure 3: Simulated Fresnel Tail skews, then obliterates, the damage reflection at larger durationsConnector TypeThe index of refraction of the patch vs. the test fiber was allowed differ by up to 10%, which created a mismatch at the junction of the two fibers. Four types of connectors were simulated to determine which produced the lowest reflection magnitude.15x 10-3Ideal Reflection Characteristics (No OTDR Saturation)105Figure 2: Simulated ideal response showing fiber damage (small reflection bumps). Damage is visible because no Fres-nel tail is present.Electric Field (V/m)Figure 4: Common types of fiber optic connectors with relative reflection magnitudes shownReferences[1] Sadiku, N.O. Matthew. Numerical Techniques in Electromagnetics [2] Newton, Steven A. Novel Approaches to Optical Reflectometry [3] Knapp, John. Characterization of FiberOptic Cables Using an Optical Time Domain Reflectometer (OTDR)0 2 2.5 3 Travel Distance from Source (m) 3.5Fiber optic characterization using a simulated Optical TimeDomain Reflectometer (OTDR)Robb P. MerrillDepartment ofElectrical and Computer Engineering - University of UtahIntroductionOptical Time Domain Reflectometry (OTDR) is a common technique for detecting damage in fiber optic cables. The process involves transmitting a pulse of light down the optical fiber, analyzing the amount of light reflected back to the source, and displaying the reflection patterns on the OTDR screen.During characterization of short fiber optic cables of approximately 1 meter, Fresnel reflections pose a serious challenge to accurate damage detection. The Fresnel tail obliterates any small reflections that are produced by damaged sections of cable, and the damage is overlooked.Simulation MethodThe Finite Difference Time Domain method [1] was implemented in MATLAB to simulate a pulse of light traveling through the patch and test fibers. The following parameters used in the simulation were obtained from an actual OTDR system: Index of refraction (n) of test fiber = 1.4525, Wavelength (λ) of light pulse = 850 nanometers [3] .Plotting the reflection response patterns from all four connection types shows that the Angled Physical Contact connector produced the lowest reflection (see Figure 6). Though much less expensive, Index Matching Fluid only has a lifetime of 2 years. Most optical fiber applications require 10 years life or more [3].Pulse DurationTo determine the effect of the light pulse duration on the saturation level of the OTDR unit, one period of a raised cosine pulse was transmitted through the fiber at various frequencies. A pulse duration of 1 microsecond proved to be the most favorably responsive for the parameters of the simulation (see Figure 3). In realworld application, however, the duration must actually be smaller due to the relatively slow simulation speed vs. the physical speed of light.OTDR Saturation at Increased Pulse Durations 0.035 1 second 0.03 2 seconds 3secondsAbnormalities in the fiber, such as bends, cracks, connectors, and other abrupt changes in the refractive index create reflection spikes called Fresnel ( Fre'-nel ) reflections [2]. After a spike is detected, a significant delay occurs when the reflectometer ‘settles down’ from its saturated state. This delay is called a Fresnel tail (Figure 1).Figure 1: OTDR screenshot showing reflection spike from cable connector, and resulting Fresnel tail (area marked by bracket)0.025Electric Field (V/m)0.020.01510.01Figure 5: Reflection patterns using various connectors (reduced Fresnel magnitudes inside yellow box)0.0050 1 1.5 2 2.5 3 3.5 4 Travel Distance from Source (m) 4.5 5SummaryShort fiber optic cables present many challenges that must be overcome in order to accurately detect fiber damage using OTDR. Pulse durations shorter than 1 microsecond, and Angled Physical Contact (APC) fiber connectors are recommended to provide the greatest。
研究生学术会议海报制作指南
研究生学术会议海报制作指南随着学术研究的不断深入和发展,学术会议成为学者们交流研究成果、分享学术经验、发展合作伙伴关系的重要场所。
而作为学术会议的一项重要宣传材料,海报的制作是参会者引起他人注意并展示自己研究成果重要手段之一。
本文以研究生学术会议海报制作为主题,从细节、要点和技巧等方面展开,在帮助学者们制作出具有吸引力的海报的同时,也提供一些建议和指导。
一、海报尺寸与规范制作一个理想的学术会议海报,首先要确保尺寸与规范的准确性。
大多数学术会议都会提供海报模板,可以直接在模板上进行创作。
一般情况下,海报的尺寸为70 cm × 100 cm,纵横比为2:3。
此外,为了确保海报的清晰度,在设计过程中应该使用高分辨率的图片和图表。
二、设计原则与风格选择1. 简洁明了海报应该以简洁明了为原则,避免在有限的空间内使用过多的文字和图片,以免引起视觉疲劳。
可以选择一个主题或关键信息,突出重点。
2. 一致的风格在整个设计过程中,选择一个统一的风格和配色方案将使海报更具吸引力。
可以使用学校或研究机构的标志色和标志图案,并确保整个海报传达出一致的信息。
3. 有吸引力的排版良好的排版可以将信息组织得更具有吸引力和易于阅读。
使用合适的字体、字号和行距,并遵循“重要信息在上、辅助信息在下”的原则。
三、内容选取与结构安排1. 研究背景介绍对研究的背景进行简明扼要的介绍,包括问题的提出、研究意义以及相关研究现状。
2. 研究目的及方法明确研究目的是什么,以及使用了哪些方法进行研究。
可以简洁地介绍研究的设计、样本选择、数据收集和分析过程。
3. 研究结果与分析展示研究的主要结果,并进行相关的解释和分析。
可以使用图表、表格或图片等方式来呈现研究结果,使其更加直观清晰。
4. 结论和展望总结研究的主要结论,并对未来的研究方向和发展提出展望。
四、视觉要素的运用1. 颜色选择适合主题和内容的颜色搭配。
可以根据学校或研究机构的标志色进行选择,同时避免使用太过刺眼的颜色。
有关海报讲座英语作文模板
有关海报讲座英语作文模板Poster Presentation。
Poster presentation is a common way to display research findings, project ideas, and other information in a clear and concise manner. It is a popular format for academic conferences, business meetings, and other events where people want to share their work with others.The purpose of a poster presentation is to communicate information quickly and effectively. A well-designed poster can attract attention, convey key messages, and generate interest in the subject matter. To create an effective poster, it is important to follow some basic guidelines.First, choose a clear and concise title that accurately reflects the content of the poster. The title should be large enough to be easily read from a distance and should be positioned at the top of the poster.Second, organize the content of the poster in a logical and easy-to-follow manner. Use headings, subheadings, and bullet points to break up the text and make it easier to read. Use graphics, such as charts, graphs, and images, to illustrate key points and make the poster more visually appealing.Third, use a font that is easy to read, such as Arialor Times New Roman. Avoid using fancy or decorative fonts that may be difficult to read from a distance. Use a font size that is large enough to be easily read from a distance, such as 24-point or larger.Fourth, make sure the poster is well-designed and visually appealing. Use colors and graphics to make the poster stand out and attract attention. Use a consistent color scheme and style throughout the poster to create a cohesive and professional look.Finally, practice presenting the poster before the event. Be prepared to answer questions and engage with people who are interested in your work. Use the poster as avisual aid to help explain your research or project and to generate interest in your work.In conclusion, poster presentation is a valuable toolfor communicating information in a clear and concise manner. By following some basic guidelines and designing aneffective poster, you can attract attention, convey key messages, and generate interest in your work.。
学术会议海报Poster模板1
3. Xxxxxxxxxxxxxxxxxxxxxxxxxxxxxxxxxxxxxxxxxxxxxxxx xxxxxxxxxxxxxxxxxxxxxxxxxxxxxxxxxxxxxxxxxxxxxxxxx xxxxxxxxxxxxxxxxxxxxxx
4. Xxxxxxxxxxxxxxxxxxxxxxxxxxxxxxxxxxxxxxxxxxxxxxxx xxxxxxxxxxxxxxxxxxxxxxxxxxxxxxxxxxx
Figure #1
如何写学术海报
如何写学术海报Effective Academic Poster Design 主讲:王雅晶博士联系方式:内容•制作学术海报之前的准备工作•学术海报的设计技巧•海报的展示准备工作•选择工具软件•了解参展要求•组织和准备将展示的信息–文字信息–图、表–照片准备工作—续•推荐使用的软件工具–PowerPoint•方便文字处理,可以转成其它格式•注意海报的尺寸要求–根据会议要求、展览空间和面积–一般12090**120cm120**90cm或90•设置位置:office2003,文件/页面设置准备工作—续•组织信息(包括文字和图、表)–把信息分成几个主要部分,即分块•主题目(title)•简介(introduction,background)•提出的问题(problems)•目的(objectives)或假设(hypothesis)•材料和方法(materials and methods)•结果(results)•讨论(discussions)•结论(conclusions)•推论(implications)–每一块内容的文字表述一定要简练海报设计技巧—抓住观众•能否留住你的观众?–3秒驻足+30秒笼统阅读•突出主题的一些方法–用>30%的面积表现主题,从3米以外吸引观众•主题、小标题的字体要大•用图要多(40%)设计的重要性?海报设计技巧—有影响力的设计•有效地使用背景图片和颜色–整幅海报的背景颜色•学术型通常无背景或选用“沉闷色”背景•表现活泼主题可选鲜艳的颜色–标题和题框的颜色•可用渐变色打破单调–框和图表的颜色和背景色要协调–PowerPoint提供的配色方案有影响力的设计•尽量避免以下情况–多层叠合时使用过于接近的颜色•看不清文字内容–一副海报里用过多种颜色•不推荐超过三种,照片除外–颜色深的水印背景–忙乱感觉的背景海报设计海报设计有影响力的设计—续•块间和行间留出足够空白–便于跟读–能有效地把读者注意力引到关键元素有影响力的设计—续块间和行间注意排列整齐和有序–眼睛习惯于跟从条条框框•整体版面分栏:–栏与栏之间间隔3cm–纵向版面建议分2栏–横向版面建议分3栏•图、表、小标题、文字内容排列在栏内有影响力的设计—续–在海报四周边缘留出最少4cm空白•以防打印不准确有影响力的设计—续•清晰的,容易跟读的文字内容–从左到右–语言描述要清晰、简洁•假定观众不熟悉海报内容所涉及的专业–字体一定要加粗•建议字体大小–主标题字号> 小标题字号> 正文文字字号–主标题字号90-150,或3米以外可以看清–内容文字字号30-32,最好按句分成小段–浅色背景上的深色字最易分辨有影响力的设计—续•使用图、表、照片提高直观效果推荐使用量≥≥40%–推荐使用量–用彩色图:.jpg或者.emf•图片的质量:200-300dpi、亮度、清晰度•避免拉扯失真–图/表的内容和文字内容对应•编号和命名•注意细节上的美化–文本框对齐,图片整齐排列–表格里数据多时用不同底色标出想要强调的数据有影响力的设计—续•别忘记–介绍你自己•照片和Logo的使用•可以在最下部留下联系信息–致谢•最后的检查很重要!–打印错误测试•用A4纸打印一份检查是否有打印内容丢失–检查错别字!!–请同学、朋友帮助检查海报的展示过程简介•对号“入板”•准备图钉或胶带•准备一些打印好的纸本(handouts)对号入板谢谢! 再见!更多请点击……。
国际学术会议海报(poster)模板(英文)9
20 10 0
b a
c
20 10
• Contingent responses are additions, modifications and deletions of specific behaviors • We allow for settings with multiple caretakers to guarantee ecological validity (there were either 1 (11.5%) or 2-3 (4.8%) other persons besides the mother)
80 70
d a b/d
b
80
a a
70
contingency rate in %
60 c/d/e
n.s .
n.s .
b/c a/c a/c a/b b
analysis of caretakers’ behavior
b/d a/b/c/ d a
b/c
Percentages of child events
THEORETICAL BACKGROUND • To react contingently toward a baby’s signals is part of the universal intuitive parenting repertoire (Papoušek & Papoušek, 1991). In two recent studies vocalizing was the dominant modality followed by touching (Hsu & Fogel, 2003; VanEgeren et al., 2001) • Furthermore, there are culture-specific modulations: • Gusii mothers from rural Kenya predominantly reacted by holding and touching whereas Boston middle-class mothers reacted primarily by looking and vocalizing (Richman et al., 1992) • Japanese mothers reacted more by touching as compared to Euro-American mothers who used facial expressions and vocalizing more often (Fogel et al.,1988) Our study addresses the general occurrence of contingent responsiveness as well as the specificity of reactions using a multicultural design with mothers who differ with respect to their interactional preferences: • Mothers with an independent model of parenting (Berlin and Los Angeles) should use distal modalities more often, • Mothers with an interdependent model of parenting (rural Nso) should use proximal modalities more often, and • Mothers with an autonomous relational model of parenting (Beijing, Delhi, urban Nso) should use both distal and proximal modalities equally often PROCEDURE • Families were visited at home • 10 minutes free play interaction between the caretaker and her 3-month old baby was videotaped METHODS – modalities for contingent responsiveness: 1.Body contact (holding) 2.Body stimulation (touching) 3.Gaze (looking) 4.Smile 5.Facial expression (raised eyebrows, mouth open) 6.Vocalization (talking) 7.Object stimulation (toys) 8.Acoustical stimulation (flipping, rattling)