从一个消费者的角度在韩国汽车市场的产品效率分析(外文)
汽车市场调查报告消费者偏好分析

汽车市场调查报告消费者偏好分析近年来,汽车市场竞争日益激烈,为了在市场中脱颖而出,汽车制造商需要深入了解消费者的需求和偏好。
本报告通过对消费者进行调查,分析了消费者在购买汽车时的偏好,为汽车制造商提供了有价值的参考和建议。
一、价格因素调查结果表明,消费者在选择汽车时最重要的因素之一是价格。
在经济全球化的大背景下,消费者普遍趋向于选择价格较为合理的汽车。
此外,对于购买欧洲车的消费者来说,品牌的影响力也是他们考虑的重要因素。
因此,汽车制造商需要在产品价格和品牌影响力之间寻找一个平衡点。
二、燃油经济性环保议题在当今社会中备受重视,燃油经济性成为消费者选择汽车的另一个重要因素。
调查显示,大多数消费者在选择汽车时更倾向于购买燃油经济性较好的车型。
这不仅可以为消费者节省燃油开支,还有助于减少环境污染。
因此,汽车制造商应该将燃油经济性作为产品研发的重点,提供更多燃油经济性较好的车型供消费者选择。
三、安全性能在车辆发展的早期阶段,消费者对安全性能关注度较低,但随着交通事故率的增加,消费者开始重视汽车的安全性能。
在调查中,多数消费者表示他们在购买汽车时会更倾向于选择安全性能好的车型。
因此,汽车制造商在产品设计中应注重提高车辆的安全性能,例如配备更先进的安全气囊和刹车系统。
四、舒适性和内部空间随着生活水平的提高,消费者对汽车的舒适性和内部空间的要求也越来越高。
调查发现,许多消费者在选择汽车时会考虑座椅的舒适性、噪音隔离效果以及后排乘客的腿部空间等因素。
因此,汽车制造商应在产品设计中注重提升舒适性,并提供更宽敞和可调节的座椅。
五、技术配置科技的不断进步为汽车行业带来了许多创新,如智能驾驶、车联网等技术让汽车更加智能化。
在调查中,许多消费者表示他们对这些技术配置抱有浓厚的兴趣,尤其是年轻一代的消费者。
因此,汽车制造商应将技术配置纳入产品设计,提供更智能化、便捷化的驾驶体验。
综上所述,根据本次调查结果,我们可以得出结论,消费者在购买汽车时主要关注价格、燃油经济性、安全性能、舒适性和内部空间以及技术配置等因素。
韩国汽车认证法规-概述说明以及解释
韩国汽车认证法规-概述说明以及解释1.引言1.1 概述韩国汽车认证法规是韩国政府针对汽车行业制定的一系列法律法规和标准,旨在确保汽车的质量、安全和环保性能达到一定的要求。
这些法规和标准涵盖了汽车设计、生产、销售和使用等各个环节,对韩国汽车市场起到了规范和监管的作用。
韩国汽车认证法规主要包括以下几个方面的内容:1. 汽车生产标准:韩国汽车认证法规要求汽车制造企业在生产过程中要符合一定的标准,包括汽车设计、制造工艺、零部件选用、生产线管理等几个方面。
这些标准旨在确保汽车的质量和安全性能达到国家规定的要求。
2. 汽车安全标准:韩国汽车认证法规规定了汽车在安全性能方面的要求,包括碰撞安全、防火安全、刹车安全、安全气囊等几个方面。
这些标准旨在保护乘车人员和行车安全,降低交通事故的发生率。
3. 环境保护标准:韩国汽车认证法规对汽车的环保性能也提出了一定的要求。
包括排放标准、燃油消耗标准、噪音标准等几个方面。
这些标准旨在减少汽车对环境的污染,促进可持续发展。
4. 售后服务标准:韩国汽车认证法规还规定了汽车销售企业在售后服务方面的要求,包括汽车保修、召回制度、维修技术支持等几个方面。
这些标准旨在保障消费者的权益,提高汽车的使用价值和市场竞争力。
总之,韩国汽车认证法规是韩国政府为了保证汽车质量、安全和环保性能而制定的一系列法律法规和标准。
它对汽车行业的发展起着重要的引导和监管作用,既保护了消费者的权益,又促进了汽车产业的可持续发展。
1.2 文章结构文章结构部分的内容可以如下所示:文章结构部分旨在介绍本篇长文的整体组织架构,以便读者能够清晰地了解本文的逻辑顺序和各部分的内容。
本文分为引言、正文和结论三个主要部分。
引言部分包括概述、文章结构和目的三个方面。
首先,我们将对韩国汽车认证法规进行一个总体概述,以便读者对韩国的汽车认证环境有一个初步的认识。
其次,我们将介绍本文的整体结构,包括各个章节和各章节所涉及的要点。
最后,我们将明确本文的目的,即从多个角度全面分析韩国的汽车认证法规,为读者提供全面准确的信息和见解。
韩国现代汽车国际化之路案例分析

• 1976年出口海外市场,距离其在国内市场推出不到3年的时间;
• 其后,PONY又出口到埃及、巴基斯坦等一系列不发达市场国家;
• 1983年,现代汽车成功进入加拿大这个北美发达市场。
• 到1984年,现代汽车累计生产Pony轿车 50 万台;
• 到85年,现代已 在全球建立起完 整的分销体系
• 85年底现在汽车 并在美国成立了 公司,负责北美 地区的销售
• 88年12月,现 • 93年,在津巴布
代汽车加拿大 韦建立CKD工厂
Quebec的工厂正 • 加大了第二代发
式投入运行,目 标是直接供应北
动机、CVT、
美市场
AVCS、混合动
• 工厂后因生产及 管理不佳等原因
不得擅自传阅、引用或复制。
调整阶段综述
时间:从1993年到1997年,以向津巴布韦进行CKD方式出口为标志性起点;
特征:经历了北美发达市场上的短暂繁荣和迅速挫败后,现代调整了出口战略,一方面继续强化出口分销体系建设, 加大在竞争对手投入较少的不发达市场的销售力度,并采用了如CKD/SKD出口、技术转让生产等较灵活的方式 (基本不需要进行项目投资,因此可视为一种灵活的出口方式而不是生产方式);另一方面关闭在发达市场的 生产基地,强化公司内部质量等管理,在本土生产精品出口到发达市场。
特征:这一时期主要特征是业务的探索性,自主新车型的开发,面向陌生的国外市场,都处于积累经验的阶段。在这个 阶段出口业务的运作模式也是以一般贸易为主,按国家或地区向代理商出口。公司在国外不设分支机构,没有海 外销售方面的投资预算(如境外宣传/广告、售后服务索赔),所有销售服务活动都由代理商自己来设计和完成。
国际市场营销期末试题(6套试题)
20 —20 学年第学期考试试题 (A)卷课程名称国际市场营销学任课老师签名出题老师签名题库审题老师签名 ____________ 考试方式(闭卷)适用专业国际经济与贸易考试时间 120分钟一、判断题(判断下列各题正误,正者在括号内打"√",误者在括号内打"×"。
每小题1分,共10分)1、一个国家或地区的经济发展周期对国际企业开展市场营销的影响很小。
()2、在国际市场营销学中,所谓产品,就是指实体的产品或物质的产品。
()3、某企业通过与东道国的一企业签订合同组建合资企业的方式进入该国经营。
它这是合同进入模式。
() 4、用古色古香的、可作茶杯的瓶子作酒瓶,这在产品包装策略中属附赠品包装策略。
()5、国际市场必须按一种模式化的标准进行细分。
()6、在国际营销中,人口分布对国际市场规模大小影响很大。
()7、在国际营销活动中,产品必须实现跨国界的转移。
()8、营业推广是效果最好但费用最昂贵的促销手段。
()9、国际营销企业在国际市场上给予中间商一定时期内的独家销售特定商品的权力的策略是短渠道策略。
()10、国际市场营销活动的主体是国家。
()二、选择题 (下列选项中,至少有一个是正确的。
请将正确选项的题号写在括号内。
每小题 1 分,共10分)1、在国际市场营销中,成本付出最高的是()方式。
A、选择型性营销B、集中型营销C、差异型营销D、广泛型营销2、下列因素中,属于国际营销可控因素的是()。
A、各国的语言与文化B、各国的贸易和经营习惯C、产品分销渠道D、各国的政治、经济与法律体系3、相对而言,用()对国际市场进行宏观细分能更全面地反映市场特征。
A、地理标准B、文化标准C、经济标准D、组合法4、下列商品中较宜选择无差异性策略的是()。
A、粮食B、服装C、鞋类D、化妆品5、一国人口增长,意味着该国市场规模()。
A、扩大B、不变C、缩小D、不一定扩大6、目标市场是指()。
中国消费者对韩国产品选择的研究

中国消费者对韩国产品选择的研究一、本文概述随着全球化进程的加速,国际间的经济交流与合作日益密切,各国的产品在全球范围内流动,消费者的选择也变得更加多元化。
中国,作为世界上最大的消费市场之一,其消费者的选择对于全球市场来说具有举足轻重的地位。
韩国,作为亚洲的经济强国,其产品在中国市场上的表现也备受关注。
本文旨在深入研究中国消费者对韩国产品的选择偏好及其背后的原因,为韩国企业在中国市场的发展提供有益的参考。
本文首先通过文献综述的方式,梳理了国内外关于消费者选择行为的相关理论和研究成果,为后续的实证研究提供了理论基础。
在此基础上,结合中国的文化背景和消费环境,构建了研究模型,并提出了相应的研究假设。
为了更准确地揭示中国消费者对韩国产品的选择偏好,本文采用了问卷调查的方法,收集了大量的一手数据。
通过对数据的统计分析,本文揭示了消费者对韩国产品的整体态度、购买意愿及其影响因素。
同时,本文还通过对比分析,探讨了不同消费群体在选择韩国产品时的差异。
二、韩国产品在中国市场的现状数据分析:根据最新的市场研究报告,韩国产品在中国市场的占有率在过去几年持续增长。
特别是韩国的化妆品、电子产品、时尚产品等,在中国消费者中享有较高的声誉。
原因分析:这一现象的原因包括韩国产品的高品质、创新性以及韩国流行文化在中国的影响。
产品质量:韩国产品以其高质量著称,这在中国消费者中形成了良好的口碑。
创新能力:韩国企业在产品设计和创新方面表现突出,这吸引了追求新鲜感和时尚感的年轻消费者。
文化影响力:韩流文化在中国的影响力不断扩大,促进了韩国产品在中国的受欢迎程度。
竞争激烈:中国市场上有来自世界各地的产品,韩国产品面临着激烈的竞争。
政治因素:中韩关系的变化可能对韩国产品在中国市场的销售产生影响。
本土品牌崛起:中国本土品牌的发展也对韩国产品构成了挑战。
持续增长:预计韩国产品在中国市场的占有率将继续增长,尤其是在化妆品和电子产品领域。
多元化发展:韩国企业可能会拓展新的产品线,以满足中国消费者的多样化需求。
外文文献翻译——顾客满意度
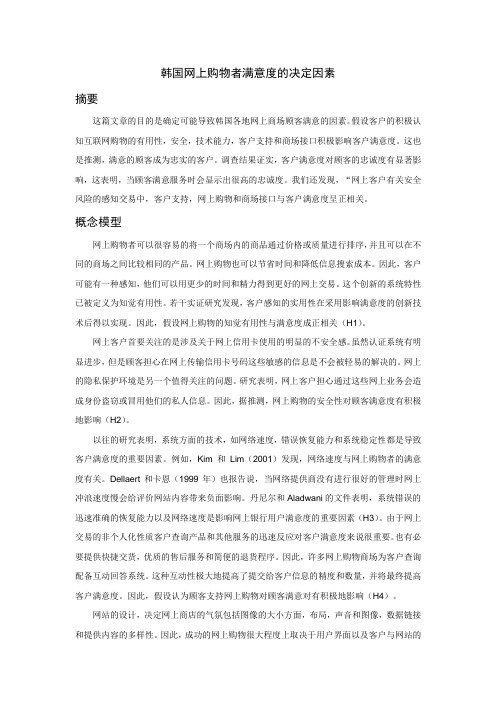
韩国网上购物者满意度的决定因素摘要这篇文章的目的是确定可能导致韩国各地网上商场顾客满意的因素。
假设客户的积极认知互联网购物的有用性,安全,技术能力,客户支持和商场接口积极影响客户满意度。
这也是推测,满意的顾客成为忠实的客户。
调查结果证实,客户满意度对顾客的忠诚度有显著影响,这表明,当顾客满意服务时会显示出很高的忠诚度。
我们还发现,“网上客户有关安全风险的感知交易中,客户支持,网上购物和商场接口与客户满意度呈正相关。
概念模型网上购物者可以很容易的将一个商场内的商品通过价格或质量进行排序,并且可以在不同的商场之间比较相同的产品。
网上购物也可以节省时间和降低信息搜索成本。
因此,客户可能有一种感知,他们可以用更少的时间和精力得到更好的网上交易。
这个创新的系统特性已被定义为知觉有用性。
若干实证研究发现,客户感知的实用性在采用影响满意度的创新技术后得以实现。
因此,假设网上购物的知觉有用性与满意度成正相关(H1)。
网上客户首要关注的是涉及关于网上信用卡使用的明显的不安全感。
虽然认证系统有明显进步,但是顾客担心在网上传输信用卡号码这些敏感的信息是不会被轻易的解决的。
网上的隐私保护环境是另一个值得关注的问题。
研究表明,网上客户担心通过这些网上业务会造成身份盗窃或冒用他们的私人信息。
因此,据推测,网上购物的安全性对顾客满意度有积极地影响(H2)。
以往的研究表明,系统方面的技术,如网络速度,错误恢复能力和系统稳定性都是导致客户满意度的重要因素。
例如,Kim和Lim(2001)发现,网络速度与网上购物者的满意度有关。
Dellaert和卡恩(1999年)也报告说,当网络提供商没有进行很好的管理时网上冲浪速度慢会给评价网站内容带来负面影响。
丹尼尔和Aladwani的文件表明,系统错误的迅速准确的恢复能力以及网络速度是影响网上银行用户满意度的重要因素(H3)。
由于网上交易的非个人化性质客户查询产品和其他服务的迅速反应对客户满意度来说很重要。
韩国现代汽车营销策略分析

韩国现代汽车营销策略分析韩国现代汽车作为韩国最大的汽车制造商之一,不仅在韩国市场上占据重要塞位,而且在举世范围内也取得了较大的成功。
这主要归功于现代汽车实行的创新营销策略。
起首,韩国现代汽车重视产品创新和多样化。
他们不仅提供各种型号的汽车,还关注产品的设计和功能方面的创新。
韩国现代汽车对汽车设计特殊重视,将奇特的设计风格融合在产品中,以吸引消费者的眼球。
并且,他们也关注消费者需求的变化,在市场上推出更多的新型车辆,如电动车和混合动力车,以满足消费者对环保和节能的追求。
其次,韩国现代汽车擅长运用数字营销手段。
他们充分利用互联网和社交媒体的优势,通过各种数字平台传递产品信息,与潜在消费者进行互动。
通过在社交媒体平台上发布与汽车相关的内容,如新闻、试驾视频和用户评判等,有效地引起消费者的爱好,并增加产品的著名度。
此外,韩国现代汽车重视区分市场定位。
他们依据不同的市场细分,针对不同的消费者群体设计和推广产品。
例如,在北美市场,韩国现代汽车定位为性价比高、可靠性强的汽车品牌。
而在欧洲市场,他们将品牌定位为豪华车市场,并利用豪华品牌吸引高端消费者。
通过有针对性的市场定位,他们实现了在不同市场上的差别化竞争。
最后,韩国现代汽车重视客户体验和售后服务。
他们提供全面的售后保障,如质保服务和24小时道路救援。
此外,他们还为消费者提供个性化的购车体验,通过提供试驾服务和定制选项等,满足消费者个性化需求。
这种重视客户体验的战略救助他们树立起良好的企业形象,并提高了客户满足度和忠诚度。
总而言之,韩国现代汽车通过产品创新、数字营销、市场定位和客户体验等策略的综合运用,不息提高了市场竞争力,拓展了举世市场份额。
这些成功策略救助韩国现代汽车成为了举世汽车行业中一个备受瞩目标品牌,并为其他汽车制造商树立起了良好的榜样。
韩国车总结

韩国车总结1. 引言韩国车在全球汽车市场中占据着重要的位置。
自20世纪50年代进入汽车制造领域以来,韩国车品牌在技术创新、设计和质量上取得了巨大的发展和进步。
本文将对韩国车进行全面的总结和评估,包括韩国车的优势、劣势以及主要的品牌和车型。
2. 韩国车的优势2.1 技术创新韩国车品牌在技术创新方面表现出色。
例如,现代汽车公司推出的混合动力和电动车型,以及起亚汽车公司开发的智能驾驶系统都获得了广泛的认可。
韩国车厂商在汽车电子技术、安全技术和燃油效率方面取得了显著的创新成果。
2.2 质量可靠韩国车的质量可靠性也是其竞争力的重要因素之一。
韩国车企严格控制生产过程,使用先进的生产设备和质量管理系统,确保每一辆车都符合高标准的质量要求。
用户对韩国车的整体质量评价较高,并且韩国车在各种质量调查和排名中都表现出色。
2.3 经济实惠与其他国际汽车品牌相比,韩国车的价格较为经济实惠。
韩国车企一直致力于提供性价比高的车型,满足不同消费者的需求。
韩国车在同级别市场中具有一定的价格优势,吸引了大量的消费者。
3. 韩国车的劣势3.1 品牌知名度与一些欧美汽车品牌相比,韩国车的品牌知名度较低。
尽管韩国车的品质和性能已经得到广泛认可,但一些消费者仍然更倾向于购买具有更高品牌知名度的汽车。
韩国车企需要加大品牌推广力度,提升品牌形象和知名度。
3.2 缺乏个性化定制选择相比其他国际汽车品牌,韩国车在个性化定制方面的选择较为有限。
一些消费者希望能够根据自己的喜好和需求进行车辆配置和个性化定制,但韩国车所提供的可选项相对较少。
韩国车企可以在这方面继续努力,以满足消费者对个性化定制的需求。
4. 主要的韩国车品牌和车型4.1 现代汽车公司•现代索纳塔:该车型是现代汽车公司的主打车型之一,深受消费者的喜爱。
它拥有出色的燃油经济性和舒适的驾乘体验。
•现代伊兰特:这款小型车以其经济实惠和可靠性而赢得了广泛的赞誉。
它适合城市生活和日常通勤使用。
4.2 起亚汽车公司•起亚索兰托:这款中型车在外观设计和内饰舒适度方面表现出色。
- 1、下载文档前请自行甄别文档内容的完整性,平台不提供额外的编辑、内容补充、找答案等附加服务。
- 2、"仅部分预览"的文档,不可在线预览部分如存在完整性等问题,可反馈申请退款(可完整预览的文档不适用该条件!)。
- 3、如文档侵犯您的权益,请联系客服反馈,我们会尽快为您处理(人工客服工作时间:9:00-18:30)。
Empir Econ(2010)38:119–137DOI10.1007/s00181-009-0258-xORIGINAL PAPERAnalysis of product efficiency in the Korean automobile market from a consumer’s perspectiveInha Oh·Jeong-Dong Lee·Seogwon Hwang·Almas HeshmatiReceived:15June2007/Accepted:16November2008/Published online:31January2009©Springer-Verlag2009Abstract In this study we develop and describe a conceptual and methodological framework to measure technical and allocative efficiency at the product level consider-ing consumer choice,which encompasses overall efficiency.Empirically,we combined data envelopment analysis and a discrete choice model in order to measure efficiency levels.The suggested framework is applied to the Korean automobile market.The relationship between the level of efficiency and market performance is discussed in terms of market share.Keywords DEA·Product efficiency·Consumers utility·Automobile market·South KoreaJEL Classification C14·C25·D13·D61·L921IntroductionPorter(1990)previously cited four key factors of the competitiveness of an economic agent:(1)firm strategy,structure and rivalry;(2)factor conditions;(3)related andI.Oh(B)Korea Energy Economics Institute,665-1,Naeson2-dong,Uiwang-si,Gyeonggi-do437-713,Koreae-mail:ioh@keei.re.kr;whistle3@snu.ac.krJ.-D.Lee·A.HeshmatiTechnology Management,Economics and Policy Program(TEMEP),Seoul National University,San56-1,Shillim-Dong,Gwanak-Gu,Seoul151-742,South KoreaS.HwangScience and Technology Policy Institute,Specialty Construction Center26F/27F,Shindaebang-dong,Dongjak-gu,Seoul156-714,South Korea120I.Oh et al. supporting industries;and(4)demand condition.Among them,the demand condition plays a significant role,driving the producer to innovate.The demand condition con-sists of a mix of consumer needs and the consumer’s ability to distinguish products with lower prices and superior quality.Afirm producing products that match consumer needs will make a profit,and will thus enjoy an increased likelihood of survival.Thus, if we know how accurately a given product conforms to the needs of the consumer, we can better understand the competitiveness of thefirm that produces that product. This workfirst requires a systematic framework by which consumer needs may be analyzed at the product level.Unfortunately,there has been little progress in research designed to analyze the products from the perspective of consumers.We canfind some research which investigates the competitiveness of products by comparing prices with quality.In this research,the product is described as a point in the price-quality space,a conceptfirst described by Lancaster(1966),after which a frontier is constructed which consists of products with the lowest price and highest quality.The competitiveness of a product has been measured by the distance between the product and the frontier.Papahristodoulou(1997),Fernandez-Castro and Smith (2002),and Lee et al.(2005)among others,have pursued this avenue of research. They referred to the measured index as the degree of efficiency or,in short,technical efficiency.If a product has a higher price and lower quality,the product will not be selected by consumers able to discern the difference between products.In this regard,prod-uct efficiency is one of the determining factors of market performance with regard to market share.However,we frequentlyfind that an efficient product is not selected by consumers,even when it has the highest quality and lowest price.This is not due to the absolute level of quality,but because the mix of qualities does not match the con-sumer’s preference structure.In this regard,there remains the possibility of allocative efficiency,in addition to that of technical efficiency.The technical efficiency refers to the distance between the position of a product and the frontier in the price-quality space.The allocative efficiency refers to the degree of match of quality mix with the preference structure.If we know the allocative efficiency of products,we will know which products provide the highest utility.However,there has been little discussion regarding allocative efficiency at the product level from the consumer’s perspective.This research is,to the best of our knowledge,thefirst to introduce the concept of allocative efficiency at the product level.Fortunately,we can utilize the recent devel-opment of the discrete choice theory to recover the utility function on the basis of market data.This provides a basis for the measurement of allocative efficiency(i.e., the match between quality mixes and consumer preference structure).The principal contribution of this research is that it introduces the concept of allocative efficiency at the product level,and presents a framework for the analy-sis of technical and allocative efficiency with information regarding the consumer’s preference structure.Methodologically,we employ a combination of the framework of data envelopment analysis(DEA)and discrete choice theory.The proposed frame-work is then applied to the Korean automobile market.The characteristic features of the study are as follows:(1)the development of an empirical framework by which allocative efficiency can be analyzed at the product level;(2)accommodation of the discreteness of the product quality attribute,by employing the discrete version ofAnalysis of product efficiency in the Korean automobile market121 the additive DEA model;and(3)combination of the information from the estimated results of the discrete choice model with DEA to generate an integrated model that enables efficient product analysis from the perspective of the consumer.This paper is organized as follows.Section2presents the theoretical framework for technical,allocative,and overall efficiency.Section3describes the empirical mod-els of DEA and discrete choice theory.Section4explains the characteristics of the Korean automobile market and the data used in empirical analysis.Section5contains the principal empirical results,and Sect.6presents the conclusions drawn from this study.2Theoretical framework2.1Efficiencies in productionThe term defined as“technical efficiency”is utilized commonly in the literature to describe the level of performance of a production unit with regard to its utilization of input resources in generating a given set of outputs.Koopmans(1951)defined“tech-nical efficiency”as a state in which it is technically impossible to increase outputs without simultaneously reducing another output or increasing inputs.Farrel(1957) showed that the“overall efficiency(OE)”of a production unit is comprised of two separate efficiency measures,referred to as“technical efficiency(TE)”and“alloca-tive efficiency(AE)”.He also proposed a method by which the technical inefficiency could be measured as the maximum equi-proportional reduction in all inputs consistent with the equivalent production of observed output.Allocative efficiency measures the degree of match of the current mix of input with the cost minimizing input mix.Even in cases in which production unit is technically efficient,it may not be allocatively efficient.Figure1shows a production technology with two inputs(x1,x2)and a single output (y).The production technology is denoted by an input requirement set L(y).For a production unit,P,with the output level y,technical efficiency can be defined as TE=d(OQ)/d(OP),where d(OQ)is the distance from the origin,O,to point Q.If input prices w1and w2are given,the iso-cost line is denoted by w1x1+w2x2=C, which is represented by the dotted line in Fig.1.In this case,we know that production at Q cannot achieve minimum cost,even though it is technically efficient by virtue of its location on the production frontier.The inefficiency due to an inappropriate mix of inputs(allocative efficiency),can be defined as AE=d(OR)/d(OQ).The overall efficiency is the combination of both technical efficiency and allocative efficiency, such that OE=d(OR)/d(OP).The above discussion can be applied to the definitions of efficiencies at the product level from the consumer’s perspective in the following discussion.2.2Efficiency in consumptionThe framework of cost minimization compels us to define technical,allocative,and overall efficiency on the production side.If we employ the framework of utility122I.Oh et al. Fig.1Technical(OQ/OP),(OR/OP)efficiency inproduction sideFig.2Technical(OI/OJ),allocative(OJ/OK)and overall efficiency(OI/OK)in consumption sidemaximization,then we can define the same efficiency terms on the consumption side.1 This is illustrated in Fig.2.In Fig.2,we assume that there are only two quality attributes,q1and q2.All prod-ucts in the market are assumed to have the same price.Each of the points I,J,K and U1Cost minimization on the production side corresponds to the expenditure minimization on the consumption side.Instead of expenditure function,we directly employ the utility function in this study.Analysis of product efficiency in the Korean automobile market123 denotes a product,and the solid line shows a frontier or boundary of the consumption possibility set faced by the consumers.As the prices are the same,any point on the consumption possibility set requires an equal expenditure to consume a product.Thus, we can alternatively refer to this consumption frontier as the budget line.In this case, the technical efficiency of product I can be defined as TE=d(OI)/d(OJ).If we understand the indifference curve or iso-utility curve,then we know the prod-uct or combination of products that yields the highest utility with a given budget.For example,in Fig.2,where the indifference curve is shown by a dotted line,product U provides the highest utility to the consumer among all the products observed in the market.Then,the allocative efficiency of the product I can be defined as the utility difference between product J,which is a projection to the frontier of product I,and product U.More formally,the allocative efficiency of product I can be expressed as AE=d(OJ)/d(OK).In a fashion similar to that of production analysis,the overall efficiency of product I can be defined as OE=d(OI)/d(OK).The above discussion tells us that inefficiency causes consumers to obtain lower utility for equal expenditure.We also know that the utility difference can be trans-formed into monetary terms on the basis of the concepts of money-metric utility functions and marginal willingness-to-pay(WTP)(Train2003;Ley and Steel1996). This transformation will be explained in detail in the following section describing the empirical framework.3Empirical frameworkThe empirical implementation of the above discussion requires measuring the distance in the price-quality space and understanding the structure of the utility function.For the measurement of distance,although a DEA model can be employed,the discreteness of consumer choices poses certain special challenges.As consumer choices are intrinsi-cally discrete and global convexity or concavity should not be imposed a priori on the shape of the frontier,we applied the free disposal hull(FDH)models(Deprins et al. 1984).The FDH model can accommodate the discreteness of the consumer choice in the real market,and makes no assumptions regarding the shape of the frontier (De Borger and Kerstens1996),when applied with the existing DEA model.In this section,we propose a modified version of an additive model,termed the “discrete additive model”.This proposed model allows us to accommodate the dis-creteness of qualities.Further,it does not specify input or output orientation.For the utility function,we show how the framework allows us to recover the random utility function on the basis of discrete choice theory.3.1Discrete additive model for efficiency measurementThe DEA model generally builds its production frontier with a linear combination of production possibility points.When we apply that framework to a price-quality space, we should be able to account for the discreteness of the quality of the product.Consum-ers are unable to combine different qualities of products,and can select a product only among the products already existing in the markets.In order to measure the distance124I.Oh et al. in this price-quality space,Lee et al.(2005)defined the consumption efficiency con-sidering this discreteness,and suggested using the discrete range adjusted measure (D-RAM)in order to measure product efficiency.Although the model is useful for measuring technical efficiency,it cannot accommodate the concept of utility,and thus cannot be utilized to measure allocative efficiency,one of the principal missions of the current study.Cooper et al.(1999)suggested a method by which allocative efficiency and over-all efficiency could measured using an additive DEA model on the production side, thereby demonstrating that the overall efficiency of a decision making unit(DMU) can be defined as the sum of the allocative efficiency and technical efficiency.The principal advantage of the additive DEA model of Cooper et al.can be found in the combination of the input-output orientation within a single model.We modified the additive DEA model by considering the discreteness of quality in order to construct a new DEA model,referred to as the“discrete additive DEA model”.The discrete additive DEA model is quite similar to the additive model,but the weights given to the reference points can have values only of one or zero.Before discussing thefinal efficiency model,an indifference curve must be defined to describe the utility struc-ture of the representative consumer.For the ease of empirical calculation of welfare loss,we assume the following linear indifference curve,which has become a common practice of the discrete choice theory(McFadden1974;Anderson et al.1992;Train 2003).Indifference curve:β z j−αp j(1) in which z j is a matrix of the quality attributes of product j,and p j is the price of prod-uct j.The method by which the parametersαandβare estimated will be explained in the next section.Once we have determined the values of the parameters,the overall efficiency of a product indicated by subscript0from the viewpoint of the representative consumer and measured by the additive model can be expressed as follows:Maxβ s++αs−s.t.p0=p+s−z0=z−s+(2)p=P λ,z=Z λe λ=1λj∈{0,1}s−,s+:freewhere,e:unit vector,λ:vector of weights whose elements take the value of0or1,s−,s+:slack vectors between the0th product and the frontier,P,Z:matrix which contains price and quality attribute variables of all products. The solutions for(2)are designated asλ,s−,s+.Analysis of product efficiency in the Korean automobile market125 Likewise,the technical efficiency can be expressed as follows:Max e s++es−s.t.p0=p+s−z0=z−s+(3)p=P λ,z=Z λe λ=1λj∈{0,1}s−,s+:non-negativeThe solutions for(3)are designated asλ∗,s−∗,and s+∗.Now,the allocative efficiency of product0can be expressed as follows:Maxβ s++αs−s.t.ˆp0=p+s−ˆz0=z−s+(4)p=P λ,z=Z λe λ=1λj∈{0,1}s−,s+:freewhereˆp0=p0−s−∗,ˆz0=z0+s+∗and the solutions are denoted byˆλ,ˆs−,andˆs+.In order to calculate the overall efficiency of products,program(2)seeks a product which gives the highest level of utility to the representative consumer,then compares its utility level with the product under investigation(product0).In order to calculate the technical efficiency,the program(3)looks for the most technically efficient prod-uct in relation to product0on the piecewise consumption frontier,and then compares its utility level with that of the technically efficient product.For a certain product, when it is impossible tofind any product which is not more expensive and,at the same time,is not inferior in every quality attribute,the product is considered a technically efficient product.The technically efficient product is then used as a reference for all products which are not cheaper and are not superior in every quality attribute to the technically efficient product.Program(4)calculates the gap in utility levels between the technically efficient product in relation to product0,and the product which gives highest utility to the consumers,and this gap is referred to as the allocative efficiency.Figure3is introduced to more intuitively illustrate the concept.In thefigure,when we think of a single quality attribute and price space for simplicity,and assume that there are four products(A,B,C,D),then the piecewise consumption frontier can be depicted by the solid line,considering the discreteness of the product.If the linear indifference curve is drawn along the dotted line,then product C yields the highest utility level to the consumer among thefive products.If we measure the inefficiency of product D,then the arrow from D to B indicates technical inefficiency,the arrow126I.Oh et al.Fig.3Technical,allocative and overall inefficiency in price-quality spacefrom B to C indicates allocative inefficiency,and the arrow from D to C shows the overall inefficiency.Here,the inefficiency terms are expressed as the sum of slacks compared to each reference point,and as the sum of slacks increases,the inefficiency of a product also increases.3.2Recovering the utility functionAs was explained in the previous section,we should know the utility function in order to measure the product efficiency from the viewpoint of the consumer.For this purpose, we utilized the instrumental variable(IV)Logit model of the discrete choice theory, which wasfirst suggested by Berry(1994)and adopted by Wojcik(2000,2001)and Kaiser(2002).However,the IV-Logit model suffers from its restrictive assumptions regarding elasticity(Berry1994;Berry et al.1995).Recent research has suggested a moreflexible random coefficient model for product differentiation models(Berry et al. 1995;Berry et al.1999;Nevo2000).However,in cases in which the measurement of elasticity is not the primary interest,a Logit model serves well for these purposes and is less burdensome in terms of econometric estimation.In the current study,we were interested only in estimating the parameters of the utility function.Thus,we will maintain the Logit method,which is easy to estimate and requires fewer observations to generate statistically significant estimates.The IV-Logit model assumes that a con-sumer’s purchasing behavior is predicated on the following linear utility functional form,where a consumer is confronted with a differentiated product market.u i j=β x j−αp j+ξj+εi j(5)Analysis of product efficiency in the Korean automobile market127 where u i j denotes the utility of consumer i when buying product j,the vector x j defines the quality attributes other than the price of product p j,andβandαare the parameters to be estimated.The termξj denotes a quality attribute,which is known to consumers and producers,but is unknown to the researchers.The termεi j denotes an identically and independently distributed(i.i.d.)extreme value,which has a double exponential distribution.The mean utility level provided to the consumer by obtaining product j,is then:δj=β x j−αp j+ξj(6)when we assume that the consumption of the outside product is normalized to be equal to zero and the market share of product j is assumed to be the same as the purchase probability of product j,then:s j(δj)=eδj1+Jj=1eδjand s0(δ0)=11+Jj=1eδj(7)for j=0,1,...,J,in which s j refers to the market share of product j and the subscript0denotes the outside product(McFadden1973).Rearranging the terms and taking the natural logarithm of(7)leads to the Logit-type market share equation for estimation,as follows:ln(s j)−ln(s0)=β x j−αp j+ξj(8) Now,we can estimate the parameters of the utility function by regressing(8),usingξj as an error term,ln(s j)−ln(s0)as a dependent variable,and x j and p j as independent variables.We have to pay attention to the fact that the unobserved quality attribute,ξj, is surely correlated with market share and price,as the unobserved quality attributes that influence demand are also likely to affect the marginal cost.Thus,we must use IV.The instruments used in this paper are exactly the identical to those suggested by Berry et al.(1995),such as:x j,r=j,r∈Firm f x r,r=j,r∈Firm fx r(9)in which Firm f is the set of products produced byfirm f.These instruments include the quality attributes of product j,the sum of each of these quality attributes over other products made by the samefirm,and the sum of each of these quality attributes over the products produced by otherfirms.2Intuitively,these IV attempt to proxy for the degree of competition with which thefirm is confronted.By using two-stage least 2For example,if one of our quality attributes is the volume of a car,then the instrument vector for product j includes the volume of car j,the sum of volume across own-firm products,and the sum of volume across rivalfirm products.Note also that one of our quality attributes is a constant term,so that the number of own-firm products and rival-firm products become instruments.128I.Oh et al. squares(2SLS)on(8)using instruments,we can estimate the parameters of the utility function.3.3Interpretation of technical,allocative and overall efficiencyHalme et al.(1999),Korhonen et al.(2002),and Korhonen and Syrjänen(2005)devel-oped the concept of value efficiency in the framework of the DEA model.The unique contributions of their work can be seen in proposing a value function that reflects the decision maker’s preferences.They prove that,if the underlying value function satis-fies some restrictions of homogeneity and continuity,etc.,then the measured distance in the input-output space will represent the difference in overall value attainment.As we are assuming a linear utility function,which is continuous,strictly increasing and homogenous with degree one in price and qualities,we can measure the difference in value in terms of the money-metric measure of willingness to pay of consumers. In the practical DEA framework employed in this study,the proportional terms are utilized as efficiency indices for WTP differences.Under the assumption of linear random utility functional form,marginal WTP for an increment of one unit of a quality attribute equals the ratio between the parameter of each quality attribute and the price parameter(Álvarez-Farizo and Hanley2002; Lee et al.2004b).The ratio of utility between the0th product and its counterpart on the frontier can be described as follows:WTP∗/WTP0=V(z∗)−p∗V(z0)−p0(10)in which V(z0)refers to the utility level with the aggregated quality attributes of the 0th product and p0is the price of the0th product,whereas the star denotes the quality attributes and the price of a product on the frontier.The above ratio tells us the ratio between the current level of utility and its optimal level.As calculated slacks denote the difference from the models on the frontier for each quality attribute and price,each efficiency term as measured by the proportion of WTP with an efficient model can be described as follows:OE=β (z∗−s+)α−(p∗+s−)/β z∗α−p∗TE=β (z∗−s+)α−(p∗+s−)/β (z∗−ˆs+)α−(p∗+ˆs−)AE=β (z∗−ˆs+)α−(p∗+ˆs−)/β z∗α−p∗(11)where(s+,s−),(s+∗,s−∗)and(ˆs+,ˆs−)are optimal solutions of slacks for the DEA model measuring the overall efficiency,technical efficiency,and allocative efficiency, respectively,and(z∗,p∗)denotes the quality attributes and the price of the product, which is overall efficient.When we apply this normalization process,OE is equal to the product of AE and TE,and all the indices are confined in the range between zero and one.Analysis of product efficiency in the Korean automobile market129Table1Production,export, import and stock of cars in Korea(in1,000) Source:Korean Automobile Manufacturers Association Year Production Export Import Number of car stock19932,050639136,27419942,312738147,40419952,526979198,46919962,8131,210259,55319972,8181,3172010,41319981,9541,362310,47019992,8431,510611,16420003,1151,6761112,06020012,9461,5011712,91520023,1481,5103013,94920033,1781,8153114,5874Data and variables4.1The South Korean automobile marketThe automobile industry comprises a large portion of the Korean economy.Accord-ing to the statistics from the Korean Automobile Manufacturers Association(KAMA), the total number of cars produced in Korea exceeded3million per year in20033,thus making South Korea the sixth largest automobile-producing country in the world.The number of cars exported was approximately1.8million per year in2003.The percent-age of workers engaged in automobile and automobile-related industries is over10% of the total workforce.Table1summarizes the overall picture for the development of the Korean automobile industry.According to Table1,the number of domestically produced cars per year increased steadily,except in1998due to the Asianfinancial crisis.Car exports have increased, whereas imports have not increased greatly.As the economy grows,the number of cars per thousand people has also increased,from6.5in1980to214.5in2003.The Korean automobile industry can be distinguished from the automobile indus-tries of other developed economies.In the specific case of Korea,five domestic auto-mobile manufacturers4are intensively competing within a limited domestic market.5 The market share among themfluctuated fairly wildly during the Asianfinancial cri-sis.Table2shows the distribution and development of production shares of different producers.Since1994,Hyundai was responsible for nearly50%of total production shares.The production share of Daewoo exceeded30%in1998,but it endured a 3These statistics do not include licensed production outside Korea.4Thefive car manufacturers include:Hyundai,Daewoo,Kia,Samsung and Ssangyong.5The ownership of these enterprises changed significantly as they pass through the Asianfinancial crisis in1997/1998.Some of the enterprises merged one another and others made coalition with foreign auto-mobile producers like General Motors(GM)and Renault.However,their own brand names did not change throughout the analysis period and we assigned each enterprise according to their brand name for further analysis.123130I.Oh et al.Table2Development of domesticfirm’s share in total production(%)Source:Korean Automobile Manufacturers Association Year Hyundai Daewoo Kia Samsung Ssangyong199450.7917.9029.22– 2.01 199549.6720.6027.36– 2.15 199647.7122.4926.91– 2.74 199746.5027.1223.27– 2.84 199843.2632.3519.93 2.13 2.26 199944.6626.6824.630.22 3.45 200048.9620.0525.790.92 3.75 200151.3713.1428.91 2.33 4.24 200254.089.3427.70 3.72 5.12 200351.8112.6125.97 3.70 4.77bankruptcy during the Asianfinancial crisis,and subsequently its share decreased steeply.Daewoo remained in operation by entering into a coalition/merger with Gen-eral Motors in2002.The production share of Kia was nearly30%,but decreased to levels below20%in1998.Kia forged a coalition with Hyundai in1999and has now nearly completely recovered the market share it enjoyed prior to the Asianfinan-cial crisis.Samsung automobile was established in1998and merged with Renault in2000.Ssangyong focuses principally on sport utility vehicles(SUV)and premium class cars.Its market share is increasing as the result of an increased preference for SUVs,reaching approximately5%in2003.Other characteristic features of the automobile market include that the cumulative market share of foreign cars was still less than one percent in2003,and that the period of owning a car before replacement is very short as compared to other developed countries.The time for replacement is approximately3.8years on average,while the average years for replacement in the US,Japan,and France are at least8years.As the overall life expectancy of Korean cars is comparable to those of other non-Korean cars, the time difference for replacement across countries does not reflect the quality of the cars.Rather,this trend is reflective of South Korean consumers’preference for newly manufactured models.Therefore,in the Korean domestic car market,frequent model changes to keep up with the evolving tastes of consumers is an important strategy for the success of automotive manufacturers.In addition,it enhances the competitiveness of industries in the international market.4.2Data for empirical analysisIn an effort to preserve the homogeneity of consumer preferences,we confined our analysis to passenger cars only.We obtained the sales data from periodicals published by rmation regarding the price and detailed quality attributes of each car model was obtained from the magazine“car vision”.The collected data covers each quarterly period from the third quarter of1998to the second quarter of2003.This gives us a total of1,373car-model-quarter observations with140distinct car models for20quarters.Each model is distinguished by its name and version.123。