KGL-WIN_CH05_EDITING A PROGRAM
KGL-WIN教程(LGPLC指令教程5)

KGL-WIN教程(LGPLC指令教程5)第五章编辑程序5.1编辑梯级图程序····························································· 5-1 5.2 编辑助记忆程序···························································· 5-2 5.3 编辑菜单········································································ 5-3 5.4 弹出菜单······································································ 5-4 5.5 视图菜单······································································ 5-4 5.6 管理⽂件········································································ 5-7第五章编辑程序程序被⽤做编辑和命令去控制机器或过程。
KGLWIN编程工具用户手册说明书

ISO 9001 Programmable Logic ControllerAiming at the Compactness and High Function°· H igh function and performance with Exclusive MPU chip- Execution speed : 0.5µs/step- Program capacity : 7ksteps°· Various built-in functions for the enlarging application fields- One(1)High speed counter (1~16kHz, 2~8kHz)- One(1)Pulse train output (2kHz)- Eight(8)PID control with auto tuning- Eight(8)Pulse catch inputs- Filtered input- Eight(8)External interrupt inputs- One(1)RS-232C I/F (dedicated, user defined, Modbus protocol)Powerful programming Tool (KGLWIN)°· Windows-based tool (Windows 95, 98 and NT)°· Applicable to all the K series°· Ladder diagram, Mnemonic language supported°· Possible to Edit a program in RUN mode°· Forced I/O On/Off°· Display the comments in a program°· Available all printers supported by Wndows°· Powerful debuggings- Execution step by step- Execution to a given step- Execution till the data becomes a given value.- Execution the cycles at the No. of given timesApplicationsMain UnitConveyor 03•K7M Provides Industrial Standard Protocol likeModbus & User defined Protocol made by User.•User can edit Link Characteristics & Protocol using User Defined Protocol (Stop Bit, Parity, Data length°¶)•Frames to be sent or received can be created asrequired by user.MODBUS Network InterfaceModem Communication Industry / Home Wide Area ProcessRiverPLC 1st LevelPlantApplication Example Water Treatment System in wide and long distance Area •Modem enables Remote programming up to 100km •Possible to program and monitor the PLCs via 2nd Level Link •Low Cost TeleMetering & TeleControl System availableProgramming Tool(KGLWIN )Overview- Windows-based tool (Windows 95, 98 and NT)- Applicable to all the MASTER-K series- Ladder diagram, Mnemonic language supported- Remote programming via network is available- Several windows can be displayed in a screen- Display the comments in a program Available all printers supported by WindowsOn-line Editing- Possible to Edit a program in RUN mode- Forced I/O On/Off and change the value of dataPowerful debuggings- Execution step by step- Execution to a given step- Execution till the data becomes a given value.- Execution the cycles at the No. of given timesMulti-WindowOn-line EditingDebuggingSpecification Perfomance specification of main modulePower SpecificationDimensions1. Main unit2. Expansion modulesK7M-DR10S8513513516521585K7M-DR20SK7M-DR30SK7M-DR40SK7M-DR60SG7E-DR10AG7F-ADHAG7F-AT2AG7L-CUEB/C。
Motorola 3.5 kHz 产品说明书
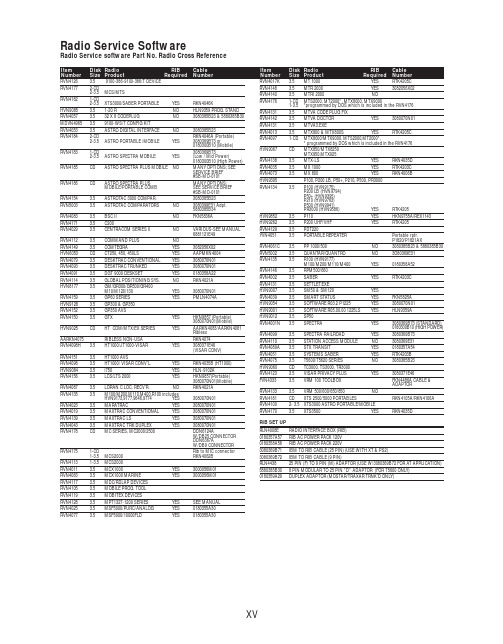
RVN4126 3.59100-386-9100-386/T DEVICERVN41772-CD2-3.5MCS/MTSRVN41821-CD2-3.5XTS3000/SABER PORTABLE YES RKN4046KHVN9085 3.51-20 R NO HLN9359 PROG. STAND RVN4057 3.532 X 8 CODEPLUG NO3080385B23 & 5880385B30 MDVN4965 3.59100-WS/T CONFIG KITRVN4053 3.5ASTRO DIGITAL INTERFACE NO3080385B23RVN41842-CD RKN4046A (Portable) 2-3.5ASTRO PORTABLE /MOBILE YES3080369B73 or0180300B10 (Mobile) RVN41831-CD3080369B732-3.5ASTRO SPECTRA MOBILE YES(Low / Mid Power)0180300B10 (High Power) RVN4185CD ASTRO SPECTRA PLUS MOBILE NO MANY OPTIONS; SEESERVICE BRIEF#SB-MO-0101RVN4186CD ASTRO SPECTRA PLUS MANY OPTIONS;MOBILE/PORTABLE COMB SEE SERVICE BRIEF#SB-MO-0101RVN4154 3.5ASTROTAC 3000 COMPAR.3080385B23RVN5003 3.5ASTROTAC COMPARATORS NO3080399E31 Adpt.5880385B34RVN4083 3.5BSC II NO FKN5836ARVN4171 3.5C200RVN4029 3.5CENTRACOM SERIES II NO VARIOUS-SEE MANUAL6881121E49RVN4112 3.5COMMAND PLUS NORVN4149 3.5COMTEGRA YES3082056X02HVN6053CD CT250, 450, 450LS YES AAPMKN4004RVN4079 3.5DESKTRAC CONVENTIONAL YES3080070N01RVN4093 3.5DESKTRAC TRUNKED YES3080070N01RVN4091 3.5DGT 9000 DESKSET YES0180358A22RVN4114 3.5GLOBAL POSITIONING SYS.NO RKN4021AHVN8177 3.5GM/GR300/GR500/GR400M10/M120/130YES3080070N01RVN4159 3.5GP60 SERIES YES PMLN4074AHVN9128 3.5GP300 & GP350RVN4152 3.5GP350 AVSRVN4150 3.5GTX YES HKN9857 (Portable)3080070N01(Mobile) HVN9025CD HT CDM/MTX/EX SERIES YES AARKN4083/AARKN4081RiblessAARKN4075RIBLESS NON-USA RKN4074RVN4098H 3.5HT1000/JT1000-VISAR YES3080371E46(VISAR CONV)RVN4151 3.5HT1000 AVSRVN4098 3.5HT1000/ VISAR CONV’L.YES RKN4035B (HT1000) HVN9084 3.5i750YES HLN-9102ARVN4156 3.5LCS/LTS 2000YES HKN9857(Portable)3080070N01(Mobile) RVN4087 3.5LORAN C LOC. RECV’R.NO RKN4021ARVN4135 3.5M100/M200,M110,M400,R100 includesHVN9173,9177,9646,9774YES3080070N01RVN4023 3.5MARATRAC YES3080070N01RVN4019 3.5MAXTRAC CONVENTIONAL YES3080070N01RVN4139 3.5MAXTRAC LS YES3080070N01RVN4043 3.5MAXTRAC TRK DUPLEX YES3080070N01RVN4178CD MC SERIES, MC2000/2500DDN6124AW/DB25 CONNECTORDDN6367AW/DB9 CONNECTOR RVN41751-CD Rib to MIC connector 1-3.5MCS2000 RKN4062BRVN41131-3.5MCS2000RVN4011 3.5MCX1000YES3000056M01RVN4063 3.5MCX1000 MARINE YES3000056M01RVN4117 3.5MDC/RDLAP DEVICESRVN4105 3.5MOBILE PROG. TOOLRVN4119 3.5MOBITEX DEVICESRVN4128 3.5MPT1327-1200 SERIES YES SEE MANUALRVN4025 3.5MSF5000/PURC/ANALOG YES0180355A30RVN4077 3.5MSF5000/10000FLD YES0180355A30RVN4017K 3.5MT 1000YES RTK4205CRVN4148 3.5MTR 2000YES3082056X02RVN4140 3.5MTRI 2000NORVN41761-CD MTS2000, MT2000*, MTX8000, MTX90001-3.5*programmed by DOS which is included in the RVN4176RVN4131 3.5MTVA CODE PLUG FIXRVN4142 3.5MTVA DOCTOR YES3080070N01RVN4131 3.5MTVA3.EXERVN4013 3.5MTX800 & MTX800S YES RTK4205CRVN4097 1-CD MTX8000/MTX9000,MTS2000,MT2000*,* programmed by DOS which is included in the RVN4176HVN9067CD MTX850/MTX8250MTX950,MTX925RVN4138 3.5MTX-LS YES RKN4035DRVN4035 3.5MX 1000YES RTK4203CRVN4073 3.5MX 800YES RKN4006BHVN9395 P100, P200 LB, P50+, P210, P500, PR3000RVN4134 3.5P100 (HVN9175)P200 LB (HVN9794)P50+ (HVN9395)P210 (HVN9763)P500 (HVN9941)PR3000 (HVN9586)YES RTK4205HVN9852 3.5P110YES HKN9755A/REX1143 HVN9262 3.5P200 UHF/VHF YES RTK4205RVN4129 3.5PDT220YVN4051 3.5PORTABLE REPEATER Portable rptr.P1820/P1821AXRVN4061C 3.5PP 1000/500NO3080385B23 & 5880385B30 RVN5002 3.5QUANTAR/QUANTRO NO3O80369E31RVN4135 3.5R100 (HVN9177)M100/M200/M110/M400YES0180358A52RVN4146 3.5RPM500/660RVN4002 3.5SABER YES RTK4203CRVN4131 3.5SETTLET.EXEHVN9007 3.5SM50 & SM120YESRVN4039 3.5SMART STATUS YES FKN5825AHVN9054 3.5SOFTWARE R03.2 P1225YES3080070N01HVN9001 3.5SOFTWARE R05.00.00 1225LS YES HLN9359AHVN9012 3.5SP50RVN4001N 3.5SPECTRA YES3080369B73 (STANDARD)0180300B10 (HIGH POWER) RVN4099 3.5SPECTRA RAILROAD YES3080369B73RVN4110 3.5STATION ACCESS MODULE NO3080369E31RVN4089A 3.5STX TRANSIT YES0180357A54RVN4051 3.5SYSTEMS SABER YES RTK4203BRVN4075 3.5T5600/T5620 SERIES NO3080385B23HVN9060CD TC3000, TS3000, TR3000RVN4123 3.5VISAR PRIVACY PLUS YES3080371E46FVN4333 3.5VRM 100 TOOLBOX FKN4486A CABLE &ADAPTORRVN4133 3.5VRM 500/600/650/850NORVN4181CD XTS 2500/5000 PORTABLES RKN4105A/RKN4106A RVN41002- 3.5XTS3000 ASTRO PORTABLE/MOBILERVN4170 3.5XTS3500YES RKN4035DRIB SET UPRLN4008E RADIO INTERFACE BOX (RIB)0180357A57RIB AC POWER PACK 120V0180358A56RIB AC POWER PACK 220V3080369B71IBM TO RIB CABLE (25 PIN) (USE WITH XT & PS2)3080369B72IBM TO RIB CABLE (9 PIN)RLN443825 PIN (F) TO 9 PIN (M) ADAPTOR (USE W/3080369B72 FOR AT APPLICATION) 5880385B308 PIN MODULAR TO 25 PIN ”D” ADAPTOR (FOR T5600 ONLY)0180359A29DUPLEX ADAPTOR (MOSTAR/TRAXAR TRNK’D ONLY)Item Disk Radio RIB Cable Number Size Product Required Number Item Disk Radio RIB Cable Number Size Product Required NumberUtilizing your personal computer, Radio Service Software (RSS)/Customer Programming Software (CPS)/CustomerConfiguration Software (CCS) enables you to add or reprogram features/parameters as your requirements change. RSS/CPS/CCS is compatible with IBM XT, AT, PS/2 models 30, 50, 60 and 80.Requires 640K RAM. DOS 3.1 or later. Consult the RSS users guide for the computer configuration and DOS requirements. (ForHT1000, MT/MTS2000, MTX838/8000/9000, Visar and some newer products —IBM model 386, 4 MEG RAM and DOS 5.0 or higher are recommended.) A Radio Interface Box (RIB) may be required as well as the appropriate cables. The RIB and cables must be ordered separately.Licensing:A license is required before a software (RVN) order is placed. The software license is site specific (customer number and ultimate destination tag). All sites/locations must purchase their own software.Be sure to place subsequent orders using the original customer number and ship-to-tag or other licensed sites; ordering software without a licensed customer number and ultimate tag may result in unnecessary delays. To obtain a no charge license agreement kit, order RPX4719. To place an order in the U.S. call 1-800-422-4210. Outside the U.S., FAX 847-576-3023.Subscription Program:The purchase of Radio ServiceSoftware/Customer Programming/Customer ConfigurationSoftware (RVN & HVN kits) entitles the buyer/subscriber to three years of free upgrades. At the end of these three years, the sub-scriber must purchase the same Radio Service Software kit to receive an additional three years of free upgrades. If the sub-scriber does not elect to purchase the same Radio Service Software kit, no upgrades will be sent. Annually a subscription status report is mailed to inform subscribers of the RSS/CPS/CCS items on our database and their expiration dates.Notes:1)A subscription service is offered on “RVN”-Radio Service Software/Customer Programming/Customer Configuration Software kits only.2)“RVN” software must only be procured through Radio Products and Services Division (RPSD). Software not procured through the RPSD will not be recorded on the subscription database; upgrades will not be mailed.3)Upgrades are mailed to the original buyer (customer number & ultimate tag).4)SP software is available through the radio product groups.The Motorola General Radio Service Software Agreement is now available on Motorola Online. If you need assistance please feel free to submit a “Contact Us” or call 800-422-4210.SMART RIB SET UPRLN1015D SMART RIB0180302E27 AC POWER PACK 120V 2580373E86 AC POWER PACK 220V3080390B49SMARTRIB CABLE (9 PIN (F) TO 9 PIN (M) (USE WITH AT)3080390B48SMARTRIB CABLE (25 PIN (F) TO 9 PIN (M) (USE WITH XT)RLN4488ASMART RIB BATTERY PACKWIRELESS DATA GROUP PRODUTS SOFTWARERVN4126 3.59100-386/9100T DEVICES MDVN4965 3.59100-WS/T CONFIG’TN RVN41173.5MDC/RDLAP DEVICESPAGING PRODUCTS MANUALS6881011B54 3.5ADVISOR6881029B90 3.5ADVISOR ELITE 6881023B20 3.5ADVISOR GOLD 6881020B35 3.5ADVISOR PRO FLX 6881032B30 3.5BR8506881032B30 3.5LS3506881032B30 3.5LS5506881032B30 3.5LS7506881033B10 3.5LS9506881035B20 3.5MINITOR III8262947A15 3.5PAGEWRITER 20008262947A15 3.5PAGEWRITER 2000X 6881028B10 3.5TALKABOUT T3406881029B35 3.5TIMEPORT P7308262947A15 3.5TIMEPORT P930NLN3548BUNIVERSAL INTERFACE KITItem Disk Radio NumberSize Product。
LG编程软件使用手册(中文)KGL-WIN_CH07_DEBUGGING
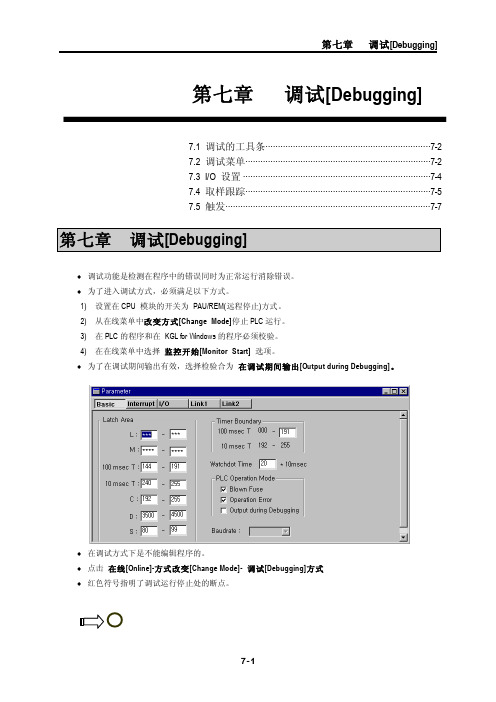
第七章 调试[Debugging]7-1第七章 调试[Debugging]7.1 调试的工具条··································································7-2 7.2 调试菜单··········································································7-2 7.3 I/O 设置 ···········································································7-4 7.4 取样跟踪··········································································7-5 7.5 触发··················································································7-7♦ 调试功能是检测在程序中的错误同时为正常运行消除错误。
KGL-WIN 教程(LG PLC指令教程3)

1.1 KGL for Windows的特征1-1
1.2与PLC的连接1-2
第一章
1.
KGL for Windows是LG Master-K系列和LG MASTER-K系列编程和调试工具。
KGL for Windows有以下相当丰富的特征。
1)在LG Master-K系列和LG MASTER-K系列程序兼容。
4)在线编辑
在在线方式下可以获得实时编辑。在在线条件下编辑的程序可以自动的下载、而不必停止PLC的硬件。
5)从PLC监视信息
用户可以轻易的监视PLC的状态如:错误状态,网络信息和系统信息。
6)调试和自诊断(LG MASTER-K系列)
在精确调试中可以得到取样跟踪,触发和强制I/O Enable。
1
LG Master-K系列和LG MASTER-K系列的RS-232C接口。
在在线菜单中选择『连接+下载+运行+监视开始』[Connect-Download-Run-Monitoring]。
详细信息请参阅LG Master-K Fnet(现场总线模块), Mnet(Mini-MAP模块),或Enet(以太模块)的用户手册。
1. 2. 3
使用调制解调器的长距离连接仅能在远程连接方式或PLC同计算机模块连接(GL-CUEA)
1. 2. 5
这种连接仅能在远程连接中获得。为了使用这种连接方法,应在PLC上安装网络模块
(Etherne模块)和在计算机上安装网络板(GOL-EUEA)。
在『连接选项[Connection Option]』菜单中选择以太(Ethernet)。
建立IP地址和槽号。
在在线菜单中选择『连接+下载+运行+监控开始』[Connect+Download+Run+Monitor Start]。
ICDPPCNEXUS MPC55xx MPC56xx In-Circuit Debugger
ICDPPCNEXUSMPC55xx / MPC56xx In-Circuit DebuggerQuick Start GuideCopyright 2009, P&E Microcomputer Systems, Inc. All rights reserved.Visit us on the web at Document Version HistoryVersion Date Notes1.0 21 Sep 2009 Initial versionCONTENTS1 Introduction (4)1.1 P&E Compatible Hardware (4)2 Getting Started (5)2.1 Connecting to your Target (5)2.2 Reset Script (6)2.3 Loading Data and Debug Information (7)2.4 CPU and Memory Windows (8)3 Debugging (10)3.1 GOTIL command (10)3.1 Stepping through C instructions (11)3.3 Setting and Reaching Breakpoints (12)3.4 Using Code Window Popup Debug Evaluation Hints (13)3.5 Using the Variables Window (15)3.6 Modifying a Variable (16)3.7 Using the Register Interpreter (17)3.8 Adding Register Field Descriptions to the Variables Window (20)1 IntroductionThis document is a step-by-step guide to using the P&E ICDPPCNEXUS in-circuit debugger software, which is compatible with Freescale MPC55xx / MPC56xx processors. This guide covers the most commonly used features of the debugger: loading binary & debug information, accessing CPU registers & memory, stepping code, setting breakpoints, and monitoring variables.1.1 P&E Compatible HardwareThe following lists the P&E hardware compatible with the ICDPPCNEXUS debugger software.P&E Part Number Interface to host PCCABPPCNEXUS Parallel (LPT) portUSB-ML-PPCNEXUS USB 2.0 (Backwards compatible with USB 1.1 ports) Cyclone MAX Serial (RS232) portUSB 1.1 (Upwards compatible with USB 2.0 ports)Ethernet2 Getting Started2.1 Connecting to your TargetUpon starting the debugger, the connection assistant dialog appears:•Use the “Interface” and “Port” drop-down menus to choose the P&E hardware interface connected between the PC and your target board.•The “Target CPU” setting can safely be left at the “Autodetect” setting for most users. If you experience problems connecting, you can try specifying the exact Freescale device that you are connecting to.• A BDM_SPEED parameter between 2 to 4 can typically be used.Processors running at slower clock speeds will require higher values.Click the Connect button, and ICDPPCNEXUS will attempt to contact the processor. Using the default debugger settings, ICDPPCNEXUS will establish communications and reset the processor.After establishing communications, the main debugger screen will appear, and a debugger reset script macro should automatically execute and complete.2.2 Reset ScriptThis section explains the initialization that the debugger, using a reset script macro file, performs on the processor. The user can view and modify all of the macro file's initialization tasks.The processor Boot Assist Module (BAM) would normally initialize the memory of the processor. However, when running the target application from the debugger, the BAM functionality is disabled. To account for this, the debugger must run a script file on reset. The script initializes the memory of the processor similar to the way in which the BAM would initialize the processor.If ICDPPCNEXUS is launched from the Freescale CodeWarrior IDE, the correct reset script file is automatically selected.If ICDPPCNEXUS is launched stand-alone, the reset script file may need to be configured. Several reset script macros are included with the ICDPPCNEXUS debugger and have a .mac extension. For detailed information, you can view each macro file using a simple text editor such as Notepad. The macro contents will contain useful comments, such as which devices are supported by that particular macro.To configure the debugger reset script macro, select the debugger Configuration menu, Automated Script Options dialog, shown here:2.3 Loading Data and Debug InformationIf ICDPPCNEXUS is launched from the Freescale CodeWarrior IDE, your code will automatically be downloaded to the processor.•RAM projects are loaded into the processor’s internal SRAM.•FLASH projects will invoke the CPROGPPCNEXUS Flash programming software to burn the code into the processor’s internal FLASH.The debug information is also automatically loaded from CodeWarrior, which will allow you to debug using your high level source code and variables.If ICDPPCNEXUS is launched stand-alone, you will need to manually download the code and debug information. Launch the Load Dialog by clicking on the High Level Load button on the debugger tool bar:This dialog allows you to specify the binary/debug file and whether to load into RAM or FLASH. Once you are satisfied with your settings, press the “Process Load Command” button to begin the download process. This step will also load the debug information.2.4 CPU and Memory WindowsThe CPU Window displays all CPU core registers, including the Program Counter (PC) and all general purpose registers.•To modify CPU register contents, double-click the register value. You will be prompted for a new value.The Memory Window displays data at any given memory address. It can be used to view RAM contents, FLASH contents, and values of peripheral registers.•To change the memory address, right-click inside the Memory Window and select “Set Base Address”. You will be prompted for a new address to begin displaying data.•To change the contents in memory, double-click the value in memory that you would like to change. You will be prompted for a new value.3 DebuggingThis section outlines the different debugging capabilities available in the ICDPPCNEXUS debugger once the debug information has been loaded.3.1 GOTIL commandAt this point, your source window will show the assembly language startup code generated by the compiler:If you do not need to debug this section and would like to run the processor until the beginning of your “main” function, you can use the “GOTIL” command.•Type “GOTIL main” in the Status window to tell the debugger to run code until it reaches the “main” function of your code.The “GOTIL” command works with any function in your code.3.1 Stepping through C instructionsStep through the initialization code, or any source code, using the high-level language source step command. Use this feature by typing “HSTEP” in the Status window or by clicking the high-level step button on the debugger tool bar:Each time the HSTEP command executes, the debugger will rapidly single step assembly instructions until it encounters the next source instruction, at which point target execution will cease. When the debugger reaches the next source instruction, all visible windows will be updated with data from the board. After reaching the main function, step through several C language instructions. Notice that some instructions will take longer to step through than others because each C instruction may consist of a greater or fewer number of underlying assembly instructions.3.3 Setting and Reaching BreakpointsIn the source code window, there will be a small red dot and a small blue arrow next to each source instruction that has underlying object code. If a large blue arrow appears on a source line, this indicates that the program counter (PC) currently points to this instruction. If a large red stop sign appears on the source line, this indicates that a breakpoint exists on this line.•Set a breakpoint at an instruction by double-clicking the tiny red dot.•To remove a breakpoint, double-click the large red stop sign.Execution will begin in real-time when you issue the HGO command or click the high-level language GO button on the debugger tool bar:If the debugger encounters a breakpoint, execution will stop on this source line. If it does not encounter a breakpoint, target execution will continue until you press a key or use the stop button on the debugger tool bar:•By double clicking the small blue arrow, you will be issuing a GOTIL command to the address of this source line.A GOTIL command will set a single breakpoint at the desired address, and the processor will begin executing code in real-time from the current program counter (PC). When the debugger encounters the GOTIL address, execution stops. If the debugger does not encounter this location, execution continues until you press akey or use the stop button on the debugger tool bar. Note that all user breakpoints are ignored when the GOTIL command is used.You may also double-click the red and blue symbols in the disassembly window. The disassembly window may display an additional symbol, a small, blue "S" enclosed in a box. This indicates that that a source code instruction begins on this disassembly instruction.3.4 Using Code Window Popup Debug Evaluation HintsWhen debugging source code, it is convenient to view the contents of a variable while viewing your source code. The in-circuit debugger has a feature, debug hints, which displays the value of a variable while the mouse cursor is held over the variable name. The hint may be displayed in any of three locations, as shown below.The three locations for the debug hints are the code window title bar, the status window caption bar, and a popup hint that appears over the variable in source code. You can configure the hints to display in any combination.•Set the locations of debug hints in the configuration menu of the debuggerThe information in the popup hint box is similar to the information displayed in the variables window.The information includes the variable name (i), value ($1), and type (signed long).3.5 Using the Variables WindowThe variables window displays the current value of application variables. The following window shows a display of variables from the example application.Variables that are pointer or reference types are displayed in red. Normal variables are displayed in black.•Add a variable by typing the VAR command, by right clicking the variables window and choosing “Add a variable”, or by hitting the "Add Variable"button in the variables window.When adding a variable using the pop-up menu, the debugger displays the following screen.In the variable field, type the address or name of the variable. Typically, set the type of the variable to “Default”, which means that the variable will be displayed as it is defined in the debugging information. When adding a variable, you may specify the numeric display base of the variable.3.6 Modifying a Variable•To modify the current value of a variable, right-click the variable name in the variables window and select “Modify Variable” to display a dialog.Check the “Modify value” checkbox, and type the variable’s new value. After you click the OK button, the debugger updates the variable value on the target, and the debugger refreshes the variable window to display the new value. Note that the debugger will not edit certain user-defined types, such as enumerated types.•You may also modify a variable’s display properties, such as the type or numeric display base using this dialog.3.7 Using the Register InterpreterThe register interpreter provides a descriptive display of bit fields within the processor’s peripheral registers. The register interpreter allows you easily to change the value of these registers. You may quickly check the current state of a peripheral and examine the configuration of the target device.When you use the register interpreter within the debugger, it reads the current value of the peripheral register, decodes it, and displays it.To launch the register interpreter in the debugger, either use the “R” command or click the view/edit register button on the tool bar:A window will appear that allows you to select a peripheral block to examine.Double clicking the module of choice will launch the register selection window.Double clicking a specific register will launch the edit/display window for that register.The window lists the keystrokes and mouse actions, allowing you to modify the values of each of the fields. After right clicking on a specific field, the register interpreter will display all options for that field.When you quit the register view/edit window by hitting the ESC key, you will be given the opportunity to write the new value into the register, as shown in the following window.3.8 Adding Register Field Descriptions to the Variables WindowAdd register bit fields to the variables window by using the “_TR” command in the debugger or by clicking the "Add Register" button in the variables window. After selecting the register field, the field appears in the debugger variables window, and the debugger will continually update its value.。
HighPoint 数据RAID配置和FnL监控软件安装指南(Windows)说明书
SRD7101P/SRD7101PB /SRD7204P /SRD7104P/ SRD7104PB/SRD7140P/SRD7140PB /CRD7104PB /CRD7101PB Driver & FnL Monitor Software Installation Guide (Windows)Version v1.00Copyright © 2021 HighPoint Technologies, Inc.All rights reservedContentsOverview (1)Prerequisites for a Data-RAID Configuration (2)Installing the Device Driver (3)1.Verify that Windows recognizes the controller (3)2.Download the Device Driver (3)3.Install the Device Driver (4)Updating the Device Driver (6)1.Check the Driver version (6)2.Download the Device Driver (7)3.Shutdown and Remove the Device (7)4.Uninstall the old Device Driver (7)5.Install the new Device Driver (9)Uninstalling the Device Driver (11)Installing the FnL Management Software (FnL Monitor & CLI) (12)Uninstalling the FnL Management Software (13)Troubleshooting (15)The FnL Monitor will not start after double-clicking the desktop icon. (15)BSOD (Blue Screen of Death) (16)How to Turn off Quick Shutdown for Windows (16)Controller and Drive Detection Issues (18)Appendix (19)How to Collect Debug View Logs (19)How to Collect INF Logs (20)How to Collect System Logs (21)Collecting Windows Dump Files (22)OverviewThis guide includes important hardware/software requirements, installation & upgrade procedures, and troubleshooting tips for using SRD7101P/SRD7101PB/SRD7204P/SRD7104P/SRD7104PB/SRD7140P/ SRD7140PB/CRD7104PB/CRD7101PB NVMe AIC RAID Drives with a Windows operating system. PrerequisitesThis section describes the base hardware and software requirements for the SRD7101P/SRD7101PB/ SRD7204P/SRD7104P/SRD7104PB/SRD7140P/SRD7140PB/CRD7104PB/CRD7101PB PCIe 3.0 NVMe AIC RAID Drives.Driver InstallationThis section covers driver installation, driver upgrade and driver uninstallation procedures for SRD7101P/ SRD7101PB/SRD7204P/SRD7104P/SRD7104PB/SRD7140P/SRD7140PB/CRD7104PB/CRD7101PB NVMe AIC RAID Drives.Management Software InstallationThis section explains how to download and install the SRD7101P/SRD7101PB/SRD7204P/SRD7104P/ SRD7104PB/SRD7140P/SRD7140PB/CRD7104PB/CRD7101PB FnL Monitor Management Software S uite for Windows operating systems. The download includes both the Web RAID Management Interface (FnL Monitor), and the CLI (Command Line Interface).TroubleshootingPlease consult this section if you encounter any difficulties installing or using the SRD7101P/ SRD7204P SRD7101PB/ SRD7104P/SRD7104PB/SRD7140P/SRD7140PB/CRD7104PB/CRD7101PBNVMe AIC RAID Drives. It includes descriptions and solutions for commonly reported technical issues.AppendixA selection of useful information and web links for the SRD7101P/SRD7101PB/SRD7204P/SRD7104P/ SRD7104PB/SRD7140P/SRD7140PB/CRD7104PB/CRD7101PB NVMe AIC RAID Drives.Prerequisites for a Data-RAID ConfigurationThe SRD7101P/SRD7101PB/SRD7204P/SRD7104P/SRD7104PB/SRD7140P/SRD7140PB/CRD7104PB/CRD7101PB NVMe AIC RAID Drives can support Data-RAID arrays. In order to usera Data-RAID array, you will need the following:1. A PCIe 3.0 slot with x8 or x16 lanes. The SRD7104P/SRD7104PB/SRD7101P/SRD7101PB/SRD7140P/SRD7140PB/CRD7104PB/CRD7101PB must be installed into a PCIe 3.0 slot with x16 dedicated lanes, The SRD7204P can be installed into a PCIe 3.0 x8 or x16 slot.2.Make sure any non-HighPoint drivers are uninstalled for any SSD’s hosted by the FnLseries RAID controllers. 3rd party software and manufacturer provided drivers may prevent the FnL from functioning properly.Warnings:1)Failing to remove the AIC Drive and SSD’s when uninstalling the driver may result in dataloss.2)Always make sure the FnL driver is installed before moving a FnL series NVMe AIC RAIDDrives & RAID array to another Windows system.Windows operating systems will always load the default NVMe support after the FnL driver has been uninstalled, or if it detects the present of a card when no driver has been loaded – this driver will only recognize the NVMe SSD’s as separate disks.If the SSD’s are recognized separately, any data they contain may be lost – this includes RAIDconfiguration data.Installing the Device DriverThe following section discusses driver installation for a non-bootable NVMe configuration.1.Verify that Windows recognizes the controllerAfter installing the FnL controller into the motherboard, power on the computer, boot the Windows operating system, and open Device Manager.A.Expand the Disk drives tab. Each NVMe SSD’s installed into the SRD7101P/SRD7101PB/SRD7204P/SRD7104P/SRD7104PB/SRD7140P/SRD7140PB/ CRD7104PB/CRD7101PBcontroller should be displayed here.B.Expand the Storage Controllers tab. You should see a “Standard NVM Express Controller”entry for each NVMe SSD that is installed into the AIC RAID Drive.Example screenshot SRD7104:AB2.Download the Device DriverDownload the appropriate FnL driver from the NVMe AIC RAID Drives Software Downloads webpage.SRD7101P/SRD7101PB:https:///srd7101p-overviewSRD7104P/SRD7104PB:https:///srd7104p-overviewSRD7204P:https:///srd7204p-overviewSRD7140P/SRD7140PB:https:///srd7140p-overviewCRD7101PB:https:///crd7101pb-overviewCRD7104PB:https:///crd7104pb-overview3.Install the Device DriverA.Locate the driver download and open the file.B.Double-click setup.Note: If installation does not start, you may have to manually start setup using AdministratorPrivileges. Right-click setup, select Run as Administrator from the menu, and confirm the pop-up window to proceed.After driver installation is complete, click OK to reboot.C.Once Windows has rebooted, open Device Manager to check the status of the driver.Expand Storage controllers and click on the HighPoint NVMe RAID Controller entry. View the properties and click the Driver tab:Example screenshot (SRD7104)Note: The driver revision shown in the screenshots may not correspond with current software releases. Please make sure to download the latest driver updates from the product’s Software Updates page.D.First, make sure the FnL Monitor has been installed (see FnL Monitor install). Open the FnLMonitor and make sure the SSD.’s / arrays are properly recognized.Note: Please refer to Appendix A to verify that your Device Manager entries correspond with the driver version you have installed.Updating the Device DriverNote: Before attempting to update the driver entry, ensure that the AIC RAID Drive is removed from the motherboard.1.Check the Driver versionOpen Device Manager to check the current driver version. Expand Storage controllers and click on the HighPoint NVMe RAID Controller entry. View the properties and click the Driver tab:Example screenshot (SRD7104)2.Download the Device DriverDownload the latest driver from the controller’s Software Downloads webpage.SRD7101P/SRD7101PB:https:///srd7101p-overviewSRD7104P/SRD7104PB:https:///srd7104p-overviewSRD7204P:https:///srd7204p-overviewSRD7140P/SRD7140PB:https:///srd7140p-overviewCRD7101PB:https:///crd7101pb-overviewCRD7104PB:https:///crd7104pb-overview3.Shutdown and Remove the DeviceA.Power down the system and remove the NVMe AIC RAID Drives from the motherboard.Note: Failing to remove the FnL controller from the motherboard during the uninstall process may result in data loss.Whenever the driver is uninstalled, Windows will attempt to install the default NVMe support,which may corrupt the RAID configurations and any data stored on SSD’s hosted by the FnLcontroller.B.Power on the system and boot Windows.4.Uninstall the old Device DriverA.Access Control Panel and select Programs→ Programs and Features, and click on the HighPointNVMe Driver entry.B.Click Uninstall/ChangeIf the HPT controller is not removed from the motherboard during the uninstall process, Windows will notify you that RAID data may be destroyed.C.After uninstalling the driver, click OK to reboot.D.After Windows has rebooted, access Control Panel to make sure the driver has been uninstalled.If there are no HighPoint NVMe RAID Driver entries present, the driver has been successfully uninstalled:5.Install the new Device DriverA.Locate the driver download and open the file.B.Double-click setup.Note: If the update does not start, you may have to manually start setup using AdministratorPrivileges. Right-click setup, select Run as Administrator from the menu, and confirm the pop-up window to proceed.C.Windows will notify you that the driver is already installed. Click OK to reboot.D.After entering the system, shut down the system.In the shutdown state, connect the FnLcontroller to the motherboard.E.Boot into the system.F.Once Windows has rebooted, open Device Manager to check the status of the driver. ExpandStorage controllers and click on the HighPoint NVMe RAID Controller entry. View theproperties and click the Driver tab:Note: The driver revision shown in the screenshots may not correspond with current software releases. Please make sure to download the latest driver updates from the product’s Software Updates page.G.First, make sure the FnL Monitor has been installed (see FnL Monitor install). Open the FnLMonitor and make sure the SSD.’s / arrays are properly recognized.For Example: SRD7204Uninstalling the Device Driver1.Power down the system and remove the NVMe AIC RAID Drives from the motherboard.Note: Failing to remove the FnL controller from the motherboard during the uninstall process may result in data loss. Whenever the driver is uninstalled, Windows will attempt to install the default NVMe support, which may corrupt the RAID configurations and any data stored on SSD’s hosted by the FnL controller.2.Power on the system and boot Windows.3.Access Control Panel and select Programs→ Programs and Features, and click on the HighPointNVMe Driver entry.4.Click Uninstall/Change5.After uninstalling the driver, click OK to reboot.6.After Windows has rebooted, access Control Panel to make sure the driver has been uninstalled. Ifthere are no HighPoint NVMe RAID Driver entries present, the driver has been successfullyuninstalledInstalling the FnL Management Software (FnL Monitor & CLI)The HighPoint FnL Management Software (FnL Monitor and CLI utilities) are used to monitor NVMe SSD’s hosted by the NVMe AIC RAID Drives. Download the latest software package from the HighPoint website:SRD7101P/SRD7101PB:https:///srd7101p-overviewSRD7104P/SRD7104PB:https:///srd7104p-overviewSRD7204P:https:///srd7204p-overviewSRD7140P/SRD7140PB:https:///srd7140p-overviewCRD7101PB:https:///crd7101pb-overviewCRD7104PB:https:///crd7104pb-overview1.Extract the package and double-click the FnL Monitor program to install the software.2.Once installed, locate the Management icon on the desktop and double-click to start the FnL Monitorinterface.Uninstalling the FnL Management Software1.Access Control Panel and select Programs→ Programs and Features, and click on the FnL Monitorentry.2.Click Uninstall/Change3.After uninstalling the driver, click Finish.TroubleshootingNote: When troubleshooting your NVMe AIC RAID Drives, make sure all of the Prerequisites have been met before proceeding.The FnL Monitor will not start after double-clicking the desktop icon.1.This is often the result of a missing driver or improperly installed driver. Open Device Managerand check under Storage Controllers.If the Driver is properly installed, you should see a HighPoint NVMe Controller entry forNVMe AIC RAID Drives, followed by HighPoint NVMe RAID Controller entry:Example screenshot (SRD7104)Note: The driver revision shown in the screenshots may not correspond with current software releases.Please make sure to download the latest driver updates from the product’s Software Updates page.2.You should also check to make sure hptsvr is running under Task Management → Services. Ifthe status of hptsvr process is Stopped, right-click on this entry and select Start from the menu:BSOD (Blue Screen of Death)There are three scenarios in which a BSOD may occur with AIC RAID DriveWindows displays a BSOD when the AIC RAID Drive is installed.If you are running Windows 10, please make sure that any Quick Shutdown options are disabled – these features can cause a BSOD when the AIC RAID Drive is installed into or removed from your motherboard. BSODs can be avoided by completely powering off your system.How to Turn off Quick Shutdown for Windowse administrator privileges to access the Command Prompt utility:b.Enter the following command and press Enter:powercfg / h offc.To make sure the setting has been disabled, enter the following command and pressEnter:powercfg / ad.Shut down the computer and remove the AIC RAID Drive from the motherboard;e.Restart the system and open the SRD7101P/SRD7101PB/SRD7204P/SRD7104P/SRD7104PB/SRD7140P/SRD7140PB/CRD7104PB/CRD7101PB driver download.f.Double-click Setup to reinstall the driver; if you are prompted to uninstall the driver, youwill need to follow the prompts and restart. After rebooting, double-click Setup once more to install the driver.After the driver installation is complete, shut down the computer. The AIC RAID Drive insert into the motherboard PCIe slot.g.Power on the system, boot Windows and access the FnL Monitor; if the FnL Monitorcan't connect, you need to restart again.h.If it fails to start the second time, please access our Online Support portal and submit asupport ticket.Note:If you are running a Server version of windows, and encounter a BSOD at bootup,please collect the following information: Windows version & build numbers, MemoryDump and System event Log1. A BSOD is encountered when installing the driver:If you experience a BSOD during driver installation, please collect the following information:Memory Dump, INF log, Debug Log, System Event log, and submit a new support ticket via our Online Support Portal.2.If Windows reports that driver installation has failed:a.Please collect these debugging information: INF log, Debug Log, DeviceManager/Storage Controller screen shot, System Event logNote:If you experience a BSOD or error when installing the driver, please ensure that any Quick Shutdown options are not enabled– Quick shutdown can cause a BSOD when removing theAIC RAID Drive from your motherboard, and plugging it back in. BSODs can be avoided bycompletely powering off your system:Controller and Drive Detection Issues•If your motherboard or Windows is unable to detect the NVMe AIC RAID Drives or NVMe SS D’s, please shutdown the system and try moving the NVMe AIC RAID Drives to another PCIeslot.•Make sure any unrelated NVMe devices are removed from the motherboard while troubleshooting the SRD7101P/SRD7101PB/SRD7204P/SRD7104P/SRD7104PB/SRD7140P/SRD7140PB/CRD7104PB/CRD7101PB NVMe AIC RAID Drives.AppendixHow to Collect Debug View LogsIf other troubleshooting steps fail to solve the problem, we suspect that the driver and management softwa re cannot establish a connection with the SRD7101P/SRD7101PB/SRD7204P/SRD7104P/SRD7104PB/ SRD7140P/SRD7140PB/CRD7104PB/CRD7101PB NVMe AIC RAID Drives. We will provide you with a Debug version of the driver to collect information about the problem you areexperiencing.To install the Debug driver, follow the standard driver installation procedure (please refer to theSRD7101P/SRD7101PB/SRD7204P/SRD7104P/SRD7104PB/SRD7140P/SRD7140PB/CRD7104PB/ CRD7101PB NVMe AIC RAID Drives User Guide). After installing the driver, follow the steps below:1.Download the DebugView utility from https:///files/DebugView.zip.2.Unzip, right-click on the icon, and run DebugView with administrator privileges. Select CaptureWin32, Capture Kernel, Enable Verbose Kernel Output, and Pass in the Capture toolbar.3.If the utility displays an “access denied” message, rename the following file:C:\Windows\System32\drivers\Dbgv.sys For example, rename it to “Dbgv.sys1”, i.e change the file type.4.Save the information printed by DebugView and send this to our support department.5.If required, we will provide management software information collection tools for the NVMeRAID Manager interface.How to Collect INF Logs1.Go to drive C→ Windows→ INF, and locate the setuppapi.dev and setupapi.setup logs:INF logs can be used to check what kind of software has been installed into the Windowssystems.2.Please access Device Manager, Storage Controllers, and check the properties for the HighPointentry. Click on Driver Details and take a screenshot – include this with the log files you submit for your support case.How to Collect System LogsIn addition to DebugView logs, System Logs can aid our Support department diagnose and resolve the support issues you have submitted. The System Log typically records errors, device failures, and software or driver related incidents. This information can help our engineers narrow down or even identify the source of the problem you are experiencing.System Log1.Click the Windows button towards the bottom left-hand corner of your desktop, and click on theSearch field.2.Type Event Viewer and click the icon as shown below:3.Expand the Windows Log folder and select System:4.Select Save All Events as… and save the .evtx file in an easy to find location.Collecting Windows Dump FilesWindows Dump files are snap shots that show which processes were running at the time of the event or failure. If possible, locate and upload the following files to your support case:•Memory.dmp•Minidump.dmpTo locate the dump files, check the C:\Windows directory and search for Memory.dmp andMinidump.dmp:。
CorrectedProblems

Ver: 5.6.2EW21532If you exited the debugger while the application was running and the option "Leave Target Running" is selected, an incorrect stack treshold exceeding warning was issued. This no longer happens.Ver: 5.6.2EW21491Adding a file to a project will now use the current case of the file name, even if it was previously included in the project with another case.Ver: 5.6.0EW21413Opening a context menu in the Editor window will no longer produce strange error entries in the Debug Log window.Ver: 5.6.0EW21154Negative values of long long type greater than (2^31)-1 (absolute) can now be entered manually in the Watch window.Ver: 5.6.0EW20856There was a problem when switching from multi-file compilation mode to single-file compilation, causing the error "Build error: Multiple tools write to the same file" to be issued. This problem has been corrected.Ver: 5.6.0EW20276Breakpoints with the path not under $PROJ_DIR$ were not saved with relative paths. Paths on the same drive are now always saved as relative to $PROJ_DIR$, regardless where the file resides (unless it is actually under$TOOLKIT_DIR$, in which case it will be relative to $TOOLKIT_DIR$).Ver: 5.5.5EW21391Dragging an expression containing a dereferenced function pointer onto the Memory window no longer causes the debugger to crash.Ver: 5.5.4EW21255The source file paths retrieved from the externally built ELF/DWARF object file are now correctly interpreted by the debugger.Ver: 5.5.3EW21331Sometimes, during downloading to flash memory, the IDE could become unresponsive. This has been corrected.Ver: 5.5.3EW21301Sometimes, while stepping in a complex C++ program, the displayed source code location did not reflect the current program counter. This has been corrected.Ver: 5.5.0EW20980A rare problem with downloading files in the Motorola S37 format into the wrong memory location has been corrected.Ver: 5.4.3EW20902In some cases, during initialization of the Stack plugin immediately after downloading the ELF/DWARF input file, the Embedded Workbench IDE exited unexpectedly. This has been corrected.Ver: 5.4.3EW20824A C/C++ macro definition containing a '#' character no longer causes the IAR Embedded Workbench IDE to exit unexpectedly.Ver: 5.4.1EW20780An '#undef' preprocessor directive not followed by a preprocessor symbol no longer causes the IAR Embedded Workbench IDE to exit unexpectedly.Ver: 5.4.0EW20752The Embedded Workbench could crash if a large selection in the text edtor was right-clicked. This has been corrected.Ver: 5.4.0EW20703It is now possible to right-click a breakpoint in the Editor and Disassembly windows to open the Edit Breakpoint dialog box.Ver: 5.4.0EW20488The ILINK checksum fields "Alignment" and "Initial value" are now correctly enabled and disabled.Ver: 5.4.0EW20486The value of bit field variables located in the anonymous structure/union could be incorrectly shown in the Live Watch window. This has been corrected.Ver: 5.4.0EW20397It is now possible to resize the Goto Function dialog of the Text Editor. The function list in the dialog is also sorted alphabetically.Ver: 5.4.0EW20269The C-SPY macro "__openFile ( input_file, "r+b" )" could fail if the input_file had the read only attribute set. This has been corrected.Ver: 5.4.0EW20237There was no way to select the checksum algorithm sum32 in "Project>Options>Linker>Checksum". This has been corrected.Ver: 5.4.0EW20108When the execution has stopped at a breakpoint, the corresponding breakpoint entry in the Breakpoints window is marked by the green arrow.Ver: 5.3.4EW20940The debugger could become inresponsive when attempting to display large floating-point values. This has been corrected.Ver: 5.3.3EW20668The "Clean" command sometimes failed to remove compiler-generated list files. This has been corrected.Ver: 5.3.3EW20660It was impossible to browse to a location in the source file when creating a new code breakpoint. This has been corrected.Ver: 5.3.3EW20546Value of 64-bits large double numbers could be incorrectly displayed when using the default display format. This has been corrected.Ver: 5.3.3EW20497An incorrect $ variable like $FILE_PATHB$ used in custom build definitions could lead to crash. This has been corrected.Ver: 5.3.3EW20202The sizes of the windows in the IAR Embedded Workbench IDE were not restored properly if the application was minimized when it was closed.Ver: 5.3.3EW19825If a debug file has changed between sessions, all absolute user breakpoints are disabled and a log is issued to this effect.Ver: 5.3.3EW19178If the IAR Embedded Workbench IDE was placed partly outside the screen or minimized when it was closed the dialog box asking for confirmation of termination of a debug session could appear outside the screen.Ver: 5.3.2EW20573The command line utility cspybat.exe downloaded code to memory after the flashloader download which could cause problems in some hardware. This has been corrected.Ver: 5.3.1EW20530The flashloader based on a previous flashloader framework could not properly be invoked from Cspybat.exe. This has been corrected.Ver: 5.3.1EW20425If an input expression in the "Linker configuration file editor" dialog box contained space or tab characters, it could be incorrectly evaluated to 0. This has been corrected.Ver: 5.3.1EW20339Opening the Code Coverage window in the Japanese language version no longer causes the Embedded Workbench IDE to exit unexpectedly.Ver: 5.3.0EW20112Circular #include preprocessor directives could make the IDE unresponsive. This has been corrected.Ver: 5.3.0EW20103A multiple failure to open a file using the 'fopen()' library function could use up all available file handles. This no longer occurs.Ver: 5.3.0EW20039C-SPY no longer crashes when accessing certain pointer-to-member variables.Ver: 5.3.0EW19869Some RealView 3.1 generated ELF/DWARF formatted files could be incompatible with C-SPY debugger. This resulted in an error:ELF/DWARF Error: Unsupported .debug_info format version:5660This has been corrected.Ver: 5.3.0EW19816An illegal instruction executed in a tight loop generated an excessive warning output to the Debug Log window. This could render the debugger unresponsive. This has been corrected.Ver: 5.3.0EW19748The fill pattern can now be of any length as long as it is composed of full bytes, but must be given in hexadecimal notation, starting with 0x.Ver: 5.2.9EW19880The Embedded Workbench IDE could terminate abnormally if the application JAWS from Freedom Scientific was running concurently. This has been corrected.Ver: 5.2.8EW20152In some cases, evaluating variables of the type complex structures, for example via ToolTip, could lead to an abnormal termination of the IDE session. This has been corrected.Ver: 5.2.7EW20133A modulo operator with a 0 divisor within preprocessor directives could cause the IDE to terminate abnormally. This has been corrected.Ver: 5.2.5EW19942The "New Breakpoint..." dialog would occasionally become too large, partially hiding window contents. This has been corrected.Ver: 5.2.5EW19806An incorrect preprocessor directive in the form of#define X(y) #xcould make the Embedded Workbench terminate abnormally. This has been corrected.Ver: 5.2.0EW20179The workspace file did not save relative paths to project files that were outside/above the workspace directory. This has been corrected.Ver: 5.2.0EW19877Builds no longer fail if the paths of any of the output directories use the $WS_DIR$ variable.Ver: 5.1.1EW19773The IAR Embedded Workbench IDE could become unresponsive if recursive macros were used in a preprocessor expression with the "Generate browse information" selected in the IDE options dialog box. This has been corrected.Ver: 5.1.1EW19771If you open the Find in Files dialog box with unsaved files open, you will be asked how to proceed with the unsaved files. Previously, if there was selected text in an editor window when you opened the Find in Files dialog box, it would be deselected after you had taken care of the unsaved files. This has now been corrected, and the selection still exists when you return to the Find in Files dialog box.Ver: 5.1.1EW19623The Build log file now contains also the file name and line number where applicable.Ver: 5.1.0EW20114Editor "Go to Function" failed in code containing "namespace". This has been corrected.Ver: 5.1.0EW19704Selecting the "Treat all warnings as errors" linker option generated multiple "--warnings_are_errors" flags to ILINK. This has been corrected.Ver: 5.1.0EW19689The project manager maintains a number of variables, such as $PROJ_DIR$ or $TOOLKIT_DIR$, which can be used in project options (and other places) and which are expanded to strings as appropriate. If you specify a variable on the form $_NAME_$, it will now be expanded to the value of the environment variable named NAME.Ver: 5.1.0EW19670A source line containing only '#define' but nothing more could cause the IAR Embedded Workbench IDE to exit abnormally. This has been corrected.Ver: 5.1.0EW19625A problem with adding additional libraries on the ILINK "Library" page has been corrected.Ver: 5.1.0EW19619If a .c file contains a time stamp, using the __TIME__ macro, it is desirable that the file is recompiled each time a project is built. One easy way to accomplish this is to render the .c file "not up to date" in the prebuild build action (in the Project>Options dialog.), for example by using 'touch' on the source file or removing the object file. A bug has been fixed which prevented this technique from working properly (it used to require two invocations of Make to bring a project up to date).Ver: 5.1.0EW19615Tooltips for variables in the editor window now reflect the global default integer format.Ver: 5.1.0EW19614When a debug session is active, files will now normally open in the built-in text editor even if an external editor has been specified.Ver: 5.1.0EW19609The pragma directive "#warning" is now correctly highlighted by the text editor.Ver: 5.1.0EW19608The __openFile C-SPY macro function can now use the value "b" for the access parameter to open files in binary mode. This makes it possible for the C-SPY macro function __writeFileByte to handle binary files correctly.Allowed __openFile access parameter combinations are:r, r+, rb, rt, rb+, rt+, r+b, r+ta, a+, ab, at, ab+, at+, a+b, a+tw, w+, wb, wt, wb+, wt+, w+b, w+tVer: 5.1.0EW19607The __openFile C-SPY macro function can now use the value "b" for the access parameter to open files in binary mode. This makes it possible for the C-SPY macro function __readFileByte to handle binary files correctly.Allowed __openFile access parameter combinations are:r, r+, rb, rt, rb+, rt+, r+b, r+ta, a+, ab, at, ab+, at+, a+b, a+tw, w+, wb, wt, wb+, wt+, w+b, w+tVer: 5.1.0EW19590Symbol #CYCLES is now also available when debugging files in intel-extended and motorola formats using simulatorVer: 5.1.0EW19576A problem with file sharing violations between the Source Browser and Find in Files has been corrected.Ver: 5.1.0EW19566Problems with entering multiple lines of text in the Check-In dialog comment field has been corrected.Ver: 5.1.0EW19562A number of key bindings issues have been fixed.Ver: 5.1.0EW19556When navigating in the Source Browser by typing the first few letters of a symbol, the topmost item (the project name) is now ignored.Ver: 5.1.0EW19552Changing output directories could temporarily result in build problems. This has been corrected.Ver: 5.1.0EW19543In some cases, references were incorrectly shown in the QuickWatch, Watch and Locals windows. This has been corrected.Ver: 5.1.0EW19532If you based a new project build configuration on an old configuration, and the project contained files that had been excluded from the old configuration, these files would incorrectly be included in the new configuration. This has been corrected.Ver: 5.1.0EW19531The editor function browser did not recognize functions within the 'namespace' block. This has been corrected.Ver: 5.1.0EW19523The text editor now reloads externally modified files correctly.Ver: 5.1.0EW19486Deselecting "Automatic runtime library selection" will now add the "--no_library_search" options to the ILINK command line.Ver: 5.1.0EW19464C-SPY no longer crashes if a C-SPY macro invoked by a breakpoint deletes the very same breakpoint.Ver: 5.1.0EW19461If there are unsaved files when the building of a project is started, you are now given a chance to save none/all/some of the files or cancel the operation.Ver: 5.1.0EW19455Division by 0 within preprocessor directives could cause IAR Embedded Workbench to terminate abnormally. This has been corrected.Ver: 5.1.0EW19448The ILINK configuration file editor no longer loses data at the end of the file each time it is edited.Ver: 5.1.0EW19371It is now possible to choose a background color for editor windows.Ver: 5.0.1EW19535While debugging, multiple instances of the same file could be opened if its path contained non-ASCII characters. This has been corrected.Ver: 5.0.1EW19459In some situations the Embedded Workbench could crash when the Find in Files dialog was opened. This has been corrected.Ver: 4.8.4EW19783Problems with entering multiple lines of text in the Check-In dialog comment field has been corrected.Ver: 4.8.4EW19235Tool-tip watch, 'Quick Watch' and 'Add to Watch' did not work unless the function or variable was marked. This has been corrected.Ver: 4.8.3EW19007In some situations, edit boxes were left unclosed when repeatedly clicking in a window with editable contents.Ver: 4.8.3EW18927Clicking the vertical scrollbar in the Disassembly window multiple times could earlier lead to incorrect behaviour.Ver: 4.8.3EW18891Floating windows placed on the secondary monitor outside the IAR Embedded Workbench IDE main window will now be centered on the primary display monitor if moving from a system with two display monitors.Ver: 4.8.3EW18726When a project file is opened, the IDE now detects if it has been modified since it was last opened, and if so, will make the next build a complete rebuild.Ver: 4.8.3EW18660In a custom build rule, the files listed in "Additional input files" were not always checked correctly when determining if the rule should be applied during a build operation. This has been corrected.Ver: 4.8.3EW18314Using nested C++ types in the following code example no longer leads to abnormal debugger termination. Example:template <class T>class A{T* data;};class B : public A<B>{};int main(void){B b;return 0;}Ver: 4.8.3EW13522The project manager now detects when open project files are modified on disk, and gives an opportunity to reload them.Ver: 4.8.1EW19018When downloading or restoring the memory contents from a Motorola S37 formatted file, the highest address byte was always set to 0. This has been corrected.Ver: 4.8.0EW18946The IAR Embedded Workbench no longer crashes when you type a colon or a semicolon followed by a return character in an otherwise empty source file.Ver: 4.8.0EW18746A very rare problem in IAR Embedded Workbench, that could delete project files if a project directory was moved, has been corrected.Ver: 4.8.0EW16369A problem where the Profiling plug-in module did not remember its state has been correctedVer: 4.7.2EW18554The debugger no longer terminates abnormally if the Profiling functionality is activated and when there are too few breakpoints available.Ver: 4.7.1EW18463Placing a variable using the '@' operator at an address outside the defined address space could cause the debugger to exit unexpectedly. This has been corrected.Ver: 4.7.1EW18358Adding a trailing semicolon to the 'File types' list box in the Find in Files dialog box, no longer causes the Embedded Workbench IDE to exit unexpectedly.Ver: 4.7.1EW18352If the debugger, when terminating a debug session, failed to stop the target execution, a crash could occur. This has been corrected.Ver: 4.7.1EW18351Missing an swtdXXX.dll file no longer causes project files to be backed up every time the project is opened.Ver: 4.7.1EW18340A problem where the Stack window could cause a crash when a debug session started has been corrected.Ver: 4.7.1EW18329Flash loader warnings in the debugger log were easy to miss among all other log output, which could make errors difficult to understand. This has been corrected.Ver: 4.7.1EW18309In some cases, stopping at a step point in highly optimized code could make the Embedded Workbench IDE exit with no warning. This has been corrected.Ver: 4.7.1EW18212The Watch window, and related windows, no longer scroll to the top of the list when stepping or expanding large structures or arrays.Ver: 4.7.1EW17411C-SPY no longer crashes when trying to load a file in the unsupported ELF/DWARF format. The file is rejected and a debug session is not started.Ver: 4.7.1EW17239Expanding an STL data structure in the Watch window of the debugger, when the data structure fits entirely in a processor register, no longer causes a crash.Ver: 4.7.1EW16661A problem with keeping user-defined key bindings has been corrected.Ver: 4.7.1EW16421A source browser filter for non-member functions and variables has been added.Ver: 4.7.1EW16393The driver SDK has been modified to allow for some more flexibility in managing threads, as follows:* The documentation now describes from which threads each driver function can be called.* The built-in critical section locks in DpDriver are now optional.* The background execution thread now gets specific sign on/off calls using DbDriverCmd.Ver: 4.7.1EW16392The driver SDK has been modified to allow for some more flexibility in managing threads, as follows:* The documentation now describes from which threads each driver function can be called.* The built-in critical section locks in DpDriver are now optional.* The background execution thread now gets specific sign on/off calls using DbDriverCmd.Ver: 4.7.0EW18077The Auto Indent function now better handles lines already indented using tabs (could also cause a crash in unusual circumstances.)Ver: 4.7.0EW18068In some cases the display of STL objects in a readable format did not work. This has been corrected.Ver: 4.7.0EW17983If the debugger is in source level stepping mode a green arrow is only shown for the current PC in the editor window. If the debugger is in assembly level stepping mode the green arrow is only shown in the disassembly window.The green arrow that points at the current source location is now only visible in one of the text editor and the disassembly window. It is in the text editor if the debugger is in statement stepping mode and in the disassembly window if it is in steppoint stepping mode.Ver: 4.7.0EW17951Specifying output directories with a path that contained an illegal drive letter could cause the IAR Embedded Workbench IDE to exit abnormally. This has been corrected.Ver: 4.7.0EW17780If a function was placed using the @ operator, the function was not present in the "Go to Function" list. This has been corrected.Ver: 4.7.0EW17651A problem with misplaced bracket match indicators and bookmarks on lines containing tabs (ASCII character 0x09) has been corrected.Ver: 4.7.0EW16793A horizontal scrollbar has been added to the MISRA C options list.Ver: 4.7.0EW16753When an example workspace was opened from the Startup screen, a different workspace that the selected could appear. This has been corrected.Ver: 4.7.0EW16235By default, the debugger used disassembly level stepping. It now uses source level stepping by default if there is source code where the execution stops for the first time.Ver: 4.7.0EW16112A problem with parsing errors producing strange error messages like:Thu May 11 11:03:17 2006: [syntax error, unexpected HEXCONSTANT, expecting IDENTIFIER] <internal> line 1, column 23orThu May 11 11:03:17 2006: [syntax error, unexpected TYPE_NAME, expecting IDENTIFIER] <internal> line 1, column 55while loading the 'custom_formats.dat' file, has been corrected.('custom_formats.dat' file contains a set of C-SPY macros used to display STL objects in a readable format).Ver: 4.7.0EW11887A new "Statics" window has been added for inspecting variables with static storage duration.Ver: 4.6.7EW18129Saving files over a network could sometimes take more than 10 seconds per file. This has been corrected.Ver: 4.6.4EW17891The Stack plugin no longer locks the debugger up when attempting to display stack variables of struct type with trailing padding or variables of certain union types.Ver: 4.6.4EW17843The settings for the Stack plugin are now saved with each project, so it is possible to maintain different settings for different projects.Ver: 4.6.4EW17826It is possible now to reset the target system without stopping the execution first. This applies only to drivers that support this feature.Ver: 4.6.4EW17824When saving project files (and some other files) file paths are made relative to either $PROJ_DIR$ (the directory where the project file resides) or $EW_DIR$ (the Embedded Workbench installation directory). $EW_DIR$ will now only be used if the path refers to a file "under" $EW_DIR$ AND the "distance" from $EW_DIR$ is shorter than the distance from $PROJ_DIR$.Ver: 4.6.2EW17747In previous versions of IAR Embedded Workbench, installing a new IAR Embedded Workbench 4.6.0 product in the same directory where a different IAR Embedded Workbench 4.0-4.5 product was already installed could in some cases cause compatibility problems when using the old product.Ver: 4.6.2EW17668Stepping over statements that generate no code bytes could lead to the unexpected termination of IAR Embedded Workbench. This has been corrected.Ver: 4.6.2EW17642When source browse information generation was enabled, the source browser could sometimes enter an infinite loop. This has been corrected.Ver: 4.6.2EW17574The Disassembly window now properly filters away certain irrelevant internal labels.Ver: 4.6.2EW17563Having a single identifier at the end of a source file could cause IAR Embedded Workbench to crash. This has been corrected.Ver: 4.6.0EW17517It is now possible to edit the search path in the Find in Files dialog box.Ver: 4.6.0EW17416Block operations, such as "trim trailing blanks" and "indent block" are performed much faster on large files now.Ver: 4.6.0EW17370Deafult selected button is "Find next" instead of "Close" so that you with "Enter" can find the next hit.Ver: 4.6.0EW17369Pressing ESC in the Incremental Search dialog used to move the cursor back to where it was before the search started. It now leaves the cursor where it is.Ver: 4.6.0EW17367A command for commenting and uncommenting blocks of code has been added.Ver: 4.6.0EW17366Workspace and project files are now (optionally) saved before a project is built.Ver: 4.6.0EW17365The file dialog now remembers the last file type selection.Ver: 4.6.0EW17251There is now a menu insertion point where plugins can register their about box menu commands.Ver: 4.6.0EW17219Previously, some hardware debugger drivers could only be used from within the IAR Embedded Workbench IDE, and not from the command line. These drivers can now be used also from the command line.Ver: 4.6.0EW17112When autoindenting, the editor now uses tabs and/or spaces as determined by editor settings.Ver: 4.6.0EW16989The iarbuild command line tool now has an option to filter build messages by severity.Ver: 4.6.0EW16858It is now possible to add custom file types in the Find in Files dialogVer: 4.6.0EW16336The text editor now indicates an appropriate line width for printing, either based on a user-settable fixed number of characters or on the current printer page width.Ver: 4.6.0EW15740The Live Watch window could be opened even if the C-SPY driver did not support it. This has been corrected but still could appear when using older drivers.Ver: 4.6.0EW14458It is now possible to toggle breakpoints by double-clicking the left margin in the text editor.Ver: 4.6.0EW13708When copying text from the ASCII part of a memory window NULL characters ('\0') were removed. They now become dots in the clipboard.Ver: 4.5.1EW17361After initially displaying "Collecting information...' the Source Browser window could show no more information. This has been corrected.Ver: 4.5.1EW17323The IDE no longer crashes if you try to split an editor window directly after the debugger has been started or stopped.Ver: 4.5.1EW17086When source browse information generation was enabled, saving a text editor file could sometimes fail. This has been corrected.Ver: 4.5.0EW16951A program error which caused incorrect Find in Files search results for files with lines exceding 255 characters has been corrected.Ver: 4.5.0EW16893Source browser data was not collected when using the '$FILE_DIR$' argument variable to specify additional include paths for the compiler.Ver: 4.5.0EW16834If you had a read-only file open in the editor and chose the Save As command from the Edit menu you were asked if you wanted to remove the read-only attributes of the file, and if you said yes the original read-only file will be overwritten without showing you a Save As dialog.Ver: 4.5.0EW16825Stepping through your application program containing multiple C/C++ statements within a single preprocessor macro could earlier cause the debugger to terminate abnormally. This has been corrected.Ver: 4.5.0EW16763When saving a workspace file failed, for example if it was write protected, an error message was not displayed.Ver: 4.5.0EW16750IAR Embedded Workbench could earlier not handle paths with more than one space.Ver: 4.5.0EW16742Source browse information for functions declared using the #pragma location directive or the @ operator was incorrectly displayed in the Source Browser window.Ver: 4.5.0EW16738In the workspace window there is a new popup menu command for adding the topmost editor document to the current project.Ver: 4.5.0EW16732Loading of large projects, or specifically projects with large dependency files (.dep), has been speeded up considerably.Ver: 4.5.0EW16728Source browse information for an #if preprocessor directive containing a macro with parameters was incorrectly displayed in the Source Browser window.Ver: 4.5.0EW16720The Auto window incorrectly displayed certain nested expressions as "TBD".Ver: 4.5.0EW16700In some cases, the debugger could earlier fail to clear temporary breakpoints set to control the execution of the flash loader. This has been correctedVer: 4.5.0EW16650The build log and the text editor have now different images for errors and warnings.Ver: 4.5.0EW16605If you selected a cursive font like "Monotype Corsiva", all fonts selected thereafter also became cursive.Ver: 4.5.0EW16578There is now a context menu command for opening a file included with an include statement in c/cpp code. It is also be possible to jump between source and include files with the same name.Ver: 4.5.0EW16540When a bracket is entered or the caret is placed after a bracket in the text editor the matching bracket is highlighted.Ver: 4.5.0EW16265When closing a workspace file containing a read-only project file, an error message was displayed but without the possibility to save the project file.Ver: 4.5.0EW14776。
- 1、下载文档前请自行甄别文档内容的完整性,平台不提供额外的编辑、内容补充、找答案等附加服务。
- 2、"仅部分预览"的文档,不可在线预览部分如存在完整性等问题,可反馈申请退款(可完整预览的文档不适用该条件!)。
- 3、如文档侵犯您的权益,请联系客服反馈,我们会尽快为您处理(人工客服工作时间:9:00-18:30)。
第五章编辑程序5-1 第五章编辑程序5.1编辑梯级图程序························································ 5-15.2 编辑助记忆程序······················································· 5-25.3 编辑菜单·································································· 5-35.4 弹出菜单 ································································ 5-45.5 视图菜单 ································································ 5-45.6 管理文件·································································· 5-7♦程序被用做编辑和命令去控制机器或过程。
这一章说明了创建,保存和编辑程序的方法。
5. 1 编辑梯级图程序♦程序是包含在工程中的一个项目且在工程中自动的创建。
♦打开在章3.1中的Test .prj工程。
♦工具条♦梯级图工具条仅在梯级图程序编辑方式下,这个工具条才是可见的。
在使用梯级图编辑工具条的情况下,用户可以从主下拉菜单中工具菜单中找到相同的功能。
梯级图编辑工具条缩小/放大视图助记忆程序细节条设备参考使用的设备列数目的改变选择器第五章编辑程序5-3♦ 细节条→ 这个细节条显示在光标点到出的使用设备的命令和注释。
♦ 指令清单条→ 为了选择指令清单条,在下面的指令清单区域内移动鼠标箭头,然后,在工具条内 点击鼠标的右键。
→ 用户可以把经常使用的指令安装在指令清单条内。
使用在指令清单条内注册的指令,仅需要点击特殊的指令清单条。
指令就会进入指定的位置。
5. 2 编辑助记忆程序♦ 助记忆程序使用输入条作为指令输入。
♦♦输入条→ 输入条显示了光标所在位置的指令和用户可以使用插入和交叠方式插入和编辑程序。
点击 显示注释显示变量浏览梯级图程序设备参考♦ 指令清单条→ 执行与在梯级图程序一样的功能。
5. 3 编辑菜单♦ 块菜单→ 只有在选择了块之后才可以得到剪切(Ctrl+X), 拷贝(Ctrl+C)和粘贴(Ctrl+V) 功能。
♦ 行编辑菜单→ 在光标处插入和删除一行。
♦ 编辑Rung 注释[Edit Rung Comment]→在指定的行编辑Rung 注释。
♦ 块选择[Block Selection ]…→ 通过步数选择块。
♦ 优化程序[Optimize a Program]→ 通过删除NOP 或不需要的行使程序达到最优化。
♦ 查找… &替换… [Find … & Replace … ]菜单→ 用来查找或替换指定的操作对象。
块菜单行编辑菜单查找 & 替换菜单历史键第五章编辑程序5-55. 4 弹出菜单♦ 点击鼠标的右键去查看弹出菜单♦ 弹出菜单根据鼠标的位置不同而不同。
♦ 功能与主菜单几乎一致。
但是强制I/O Enable 的运算不同。
5. 5 视图[View]菜单♦ 在下拉菜单选择 菜单 – 视图[View]5. 5. 1 视图设备用户仅能在4种类型中选择一种。
♦ 显示了在程序中使用的设备和变量/注释。
→ 设备名: 在屏幕上显示设备名。
( 例如:P0010, D0100 )→ 变量名: 显示在变量/注释项中注册的变量名。
→ 设备+ 变量名 :显示设备名和变量名。
→ 设备 + 注释 : 显示设备名和注释5. 5. 2 视图设备信息♦ 在下拉菜单中选择 菜单- 视图 – 使用的设备[View – Used Device] ()。
选项选择♦区域条是用来选择被监控和更新的设备区域。
♦为了获取使用设备的细节信息,把鼠标的光标移到用户想要监控的位置,然后点击鼠标的右键。
然后出现了指定设备的设备参考对话框。
♦设备参考对话框显示了步数,命令和使用设备的状态。
♦用户可以通过选择下拉菜单中的菜单–视图[view]–设备参考[Device Reference]( )选择此项功能。
这显示了每个使用的设备。
第五章编辑程序5-75. 5. 3 检查程序…♦ 程序检查功能具有逻辑错误,操作数错误,dual coil 错误等等。
♦在下拉菜单中选择 菜单- 视图[view]– 检查程序[Check Program]…。
♦ 用户可以选择在对话框中要检查的项目。
然后按下‘OK ’按钮执行检查。
♦ 检查之后出现检查结果消息。
如果有错误出现,则消息窗体会显示详细的信息给用户。
5. 5. 4 改变列数目♦ 改变在梯级图一行中输入数目。
选择在下拉菜单中 菜单 – 视图[view] – 改变列数目[Change Number of Column ]( , )选择输入触点的数目。
5. 5. 5 缩小/放大♦ 用户可以放大或减小屏幕。
这是通过点击 或 完成的。
(兰色的。
)♦ 用户也可以选择在下拉菜单中的菜单 – 视图 – 缩小/放大[Zoom In/Out]来改变缩放比例。
5. 6 管理文件♦当创建一个工程,3个项目(程序,参数和变量/注释) 在同时被自动的创建。
♦这些项目都存储在一个工程中。
如果用户想把它们存为独立的文件,在下拉菜单中选择工程[Project] –保存项[Save Item]。
♦一个项目意味着一个程序或参数或变量/注释。
要在其他的工程中使用这些项目,项目应被保存为每个独立的文件。
♦文件表示的是一个程序,参数或变量/注释,但它们不是工程中的项目。
如果用户想要在工程中使用文件,则文件会变成工程中的一个项目。
5. 6. 1新建…♦为了创建一个新的文件,在下拉菜单中选择菜单–文件[File]–新建[New]…( )。
♦选择要创建的项目(程序)同时按下‘OK’按钮。
♦设置PLC类型和编程语言同时按下‘OK’按钮。
第五章编辑程序5-9 5. 6. 2 打开[Open]…♦ 为打开一个文件,在下拉菜单中选择菜单 – 文件[File] – 打开[Open] ( ) 。