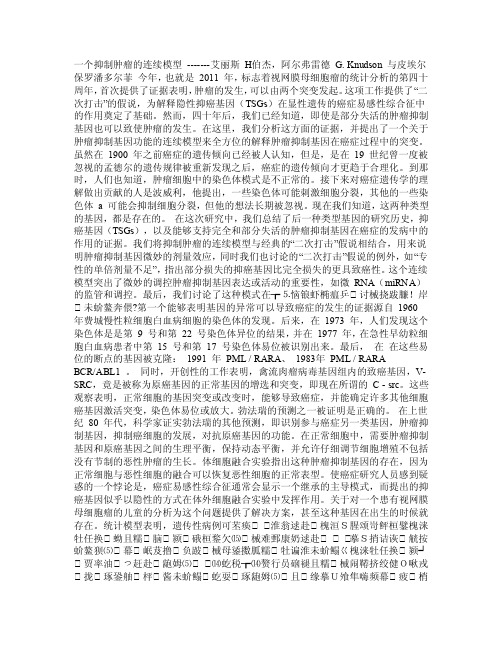
Association between winter anthocyanin production and
【精品】翻译综合
一个抑制肿瘤的连续模型-------艾丽斯H伯杰,阿尔弗雷德G. Knudson 与皮埃尔保罗潘多尔菲今年,也就是2011 年,标志着视网膜母细胞瘤的统计分析的第四十周年,首次提供了证据表明,肿瘤的发生,可以由两个突变发起。
这项工作提供了“二次打击”的假说,为解释隐性抑癌基因(TSGs)在显性遗传的癌症易感性综合征中的作用奠定了基础。
然而,四十年后,我们已经知道,即使是部分失活的肿瘤抑制基因也可以致使肿瘤的发生。
在这里,我们分析这方面的证据,并提出了一个关于肿瘤抑制基因功能的连续模型来全方位的解释肿瘤抑制基因在癌症过程中的突变。
虽然在1900 年之前癌症的遗传倾向已经被人认知,但是,是在19 世纪曾一度被忽视的孟德尔的遗传规律被重新发现之后,癌症的遗传倾向才更趋于合理化。
到那时,人们也知道,肿瘤细胞中的染色体模式是不正常的。
接下来对癌症遗传学的理解做出贡献的人是波威利,他提出,一些染色体可能刺激细胞分裂,其他的一些染色体 a 可能会抑制细胞分裂,但他的想法长期被忽视。
现在我们知道,这两种类型的基因,都是存在的。
在这次研究中,我们总结了后一种类型基因的研究历史,抑癌基因(TSGs),以及能够支持完全和部分失活的肿瘤抑制基因在癌症的发病中的作用的证据。
我们将抑制肿瘤的连续模型与经典的“二次打击”假说相结合,用来说明肿瘤抑制基因微妙的剂量效应,同时我们也讨论的“二次打击”假说的例外,如“专性的单倍剂量不足”,指出部分损失的抑癌基因比完全损失的更具致癌性。
这个连续模型突出了微妙的调控肿瘤抑制基因表达或活动的重要性,如微RNA(miRNA)的监管和调控。
最后,我们讨论了这种模式在┲⒌恼锒虾椭瘟乒 讨械挠跋臁!岸 未蚧鳌奔偎?第一个能够表明基因的异常可以导致癌症的发生的证据源自1960 年费城慢性粒细胞白血病细胞的染色体的发现。
后来,在1973 年,人们发现这个染色体是是第9 号和第22 号染色体异位的结果,并在1977 年,在急性早幼粒细胞白血病患者中第15 号和第17 号染色体易位被识别出来。
小学上册第十三次英语第一单元期中试卷

小学上册英语第一单元期中试卷英语试题一、综合题(本题有100小题,每小题1分,共100分.每小题不选、错误,均不给分)1.What is the capital city of Italy?A. ParisB. RomeC. MadridD. BerlinB2.I can ______ (与他人合作) on projects.3.What is the name of the bear that loves honey?A. PandaB. Polar BearC. Winnie-the-PoohD. Grizzly BearC4.What is the name of the fairy tale about a girl who loses her glass slipper?A. Snow WhiteB. CinderellaC. Sleeping BeautyD. Little Red Riding HoodB5.Can you help me _______ (找到) my book?6.The butterfly is ___. (flying)7.She has a ________ (beautiful) smile.8.The ______ is known for her charitable work.9. A __________ is a tool used to measure temperature.10.The chemical symbol for chlorine is ______.11.What is the name of the famous painting by Leonardo da Vinci?A. The Last SupperB. Mona LisaC. The Starry NightD. The ScreamB12.The ______ is known for her unique fashion sense.13.The __________ is a famous area for hiking and outdoor activities.14.What do you call a place where you can buy food and drinks?A. MarketB. RestaurantC. Grocery storeD. All of the aboveD15.The ______ (组织) in plants helps with nutrient transport.16.The _____ is the area around a star where planets can form.17.The _______ (NATO) alliance was formed for mutual defense.18.The chemical symbol for cesium is ______.19.The bat flies at ______.20.I have a _____ (passport) for travel.21.What is 20 8?A. 10B. 12C. 15D. 8B22.Which of these is a type of tree?A. RoseB. OakC. DaisyD. Tulip23.My dog loves to dig ______ (洞) in the sand.24.Which of these is a dessert?A. SoupB. SaladC. Ice CreamD. RiceC25. A frog can change color to blend in with its ______ (环境).26.The chemical symbol for lead is _____.27.Which month has Halloween?A. OctoberB. NovemberC. SeptemberD. AugustA28.What is the largest continent?A. AfricaB. AsiaC. North AmericaD. EuropeB29. A ____(community coalition) unites diverse stakeholders.30.In a chemical reaction, reactants turn into _____.31.The ________ was a major event in the history of the Americas.32.What is the capital of Fiji?A. SuvaB. NadiC. LautokaD. LabasaA33.I like to listen to ______ (音乐) while I study. It makes me feel ______ (放松).34.What is the name of the famous American singer known as the "King of Pop"?A. Elvis PresleyB. Michael JacksonC. Frank SinatraD. Whitney HoustonB Michael Jackson35.The __________ (二战后的重建) focused on rebuilding Europe.36.The invention of the internet has transformed global _____.37.What do we call a young female rabbit?A. KitB. BunnyC. PupD. LeveretA38.Earth's atmosphere protects us from ______.39.The ________ was a famous document in the history of Britain.40.Fossil fuels are a source of ______ energy.41.What do you call a story that has been passed down through generations?A. FolkloreB. LegendC. MythD. All of the aboveD42.What do you call the main character in a story?A. AntagonistB. ProtagonistC. NarratorD. VillainB43.Heat can speed up ________ reactions.44.What is the name of the fairy tale character who left a glass slipper?A. Snow WhiteB. CinderellaC. RapunzelD. Sleeping BeautyB45.What is the name of the first man to walk on the moon?A. Buzz AldrinB. Neil ArmstrongC. Yuri GagarinD. John Glenn46.My mom enjoys making homemade ____ (pizzas).47.What do we call a person who writes stories?A. AuthorB. ArtistC. MusicianD. ActorA48.My mom enjoys __________ (与朋友聚会) and socializing.49.I appreciate my family’s love for ____.50.I want to _______ (学习) about marine life.51.The rainbow has many _____ (colors/shapes).52.What color are polar bears?A. WhiteB. BrownC. BlackD. GrayA White53.I see a ___ (cloud/sky) up above.54.The _____ (生态系统服务) includes clean air and water.55.I have a beautiful _____ (花瓶) that holds fresh flowers. 我有一个漂亮的花瓶,里边插着新鲜的花。
10月份违反日本食品卫生法的企业
第18条第2項
GUSTAVSBERGS PORSLINSFABRIK
Hale Waihona Puke 飲食器具(磁器製):皿 (RED ASTER PLATE)
第18条第2項
GUSTAVSBERGS PORSLINSFABRIK
生鮮ピスタチオナッツ
第6条第2号
SHOEI FOODS (U.S.A.), INC
食品製造用機械の部品(ゴム 製):SCREENER DA650 第18条第2項 AZO GMBH + CO. KG BAFFLE PLATE
菜種油(FRESH ASH OIL)
第10条
YOUJIA FOODSTUFFS CO., LTD. SICHUAN
生鮮きのこ類:ゕンズタケ (FRESH GOLDEN CHANTERELLE 第11条第2項 (CANTHARELLUS CIBARIUS)) その他の菓子類:カリプソ STELLA MEDITERRANEA (干しチジクとゕーモンド 第6条第2号 D. O. O のデザート)
生鮮コーヒー豆
第6条第1号
無加熱摂取冷凍食品:煮あな 第11条第2項 HAEBOK CO., LTD. ご(FROZEN KIZAMINIANAGO) 加熱後摂取冷凍食品(凍結直 前未加熱):ロース豚串カツ RONGCHENG RONGDONG 第11条第2項 (FROZEN BREADED PORK FOODSTUFF CO.,LTD. STRING)
WELDEYESUS BUSINESS P. L. C.
無加熱摂取冷凍食品:えだま DA-YUE (CIXI) め(FROZEN SOY BEANS(SALT 第11条第2項 FOODSTUFF INDUSTRY WATER BOILED)) CO.,LTD. COCAPEC COOPERATIVA DE CAFEICULTORES E AGROPECUARISTAS
高二英语extensive-readingA

高三英语人类学研究单选题40题
高三英语人类学研究单选题40题1. In the field of anthropology, a "clan" is a group of related families, but a "tribe" is a much larger _____.A. organizationB. communityC. institutionD. association答案:B。
“organization”意为“组织”;“community”意为“社区,团体”,更能体现比“clan”更大的群体;“institution”意为“机构”;“association”意为“协会”。
在人类学领域,“tribe”指更大的“团体”,所以选B。
2. Anthropologists study the customs and ____ of different cultures.A. traditionsB. habitsC. practicesD. manners答案:A。
“traditions”指“传统”;“habits”侧重个人习惯;“practices”意为“实践”;“manners”指“礼貌,方式”。
研究不同文化的应是“传统”,故选A。
3. The ____ of anthropology includes the study of human evolution and social behavior.A. rangeB. scopeC. fieldD. area答案:B。
“range”表示范围、幅度;“scope”指范围、领域,更强调内容和活动的范围;“field”常指实地、领域;“area”侧重面积。
这里说的是人类学的“领域”,用“scope”更恰当,选B。
4. Cultural anthropology focuses on the ____ and values of different societies.A. beliefsB. opinionsC. thoughtsD. ideas答案:A。
托福阅读:2009.3.7托福阅读考试机经回顾
1.植物随着冰川周期变化而不断expand或retreat。
2. 十二世纪的时候欧洲分成了两个阵营:North的比较集权都是政治国家,有强大的国家机器,hierarchy严重,人们的社会价值观取决于role in the community(题);South 有很高尚的文化、教育,国家虽然比较小,但是都很富裕。
也提到了北边要从武力侵略南方,并获得profit;南方在education、science 以及教堂建设等等影响了北方。
整片文章一直用comparison的方法在叙述,但是不是一个一个detail compare,是先说完北方的特点再说南方的特点(题)。
考到Proliferation 什么意思(increase)。
Urbane 什么意思(cultivated)3.讲了一种研究geology的方法叫做Acltruism(类似这个拼法)的方法。
A这种方法只可以用现在可以观察到的现象去解释以前的rock的形成。
提到Iron ore。
然后由于A这种方法无法确认恐龙的extinction是由于陨石impact造成的,也没法完全解释rock的形成过程。
后来科学家们就在lab里面模拟inside地球里面的环境来研究rock的形成。
考 duplicate(repeat)。
【部分词汇题:surmise=infer Proliferation 什么意思(increase)。
Urbane: 什么意思(cultivated)equilibrium invoilableproliferation=increase duplicate=repeatequilibrium=balance urbane=cultivated】[另一版本阅读阅读一:感谢渣七的友情支持。
以下来自渣七语录:“若干个冰川时代中间夹杂着短暂的回暖时期,一些很贱的植物就是在那时活下来的。
可以通过植物分布判断地质时期,虽然有些植物区会在冰川时期大幅缩减,但是还能看出来。
2024年贵州省高考英语模拟试题及参考答案
2024年贵州省高考英语模拟试题及参考答案考生须知:1.全卷分选择题和非选择题两部分,全部在答题纸上作答。
选择题必须用2B铅笔填涂;非选择题的答案必须用黑色字迹的钢笔或答字笔写在“答题纸”相应位置上。
2.请用黑色字迹的钢笔或答字笔在“答题纸”上先填写姓名和准考证号。
3.保持卡面清洁,不要折叠,不要弄破、弄皱,在草稿纸、试题卷上答题无效。
第一部分(共20小题,每小题1.5分,满分30分)1.Don’t leave the water ______while you brush your tee th.A.racing B.rushingC.running D.rolling2.—Excuse me, I wonder if you can help me?— Sure. ______ ?A.What help B.What is this C.What is it D.What do you want3.He let me write down his instructions sure that I would know what was after he went away. A.making; doing B.making; to doC.to make; to do D.to make; to be done4.She was such a proud person that she would die she would admit she was wrong.A.since B.whenC.unless D.before5.It is so difficult a question_______ none of the kids could work it out.A.as B.that C.which D.X6.I didn t see your sister at the meeting. If she , she would have met my brother.A.has come B.did comeC.came D.had come7.—Peter has spent too much time on novels recently.—That may ____ his poor grade in the exam.A.account for B.answer forC.apply for D.stand for8.—I have got a headache.—No wonder.You___in front of that computer too long.A.work B.are workingC.have been working D.worked9.— You could always put the decision off a little bit longer.— __________ If I leave it much longer I might miss my chance.A.That’s reasonable.B.Isn’t it a good idea?C.Do you think so? D.I can’t agree more.10.— Joe, what about going to Belgium for our coming holiday?—Sorry, honey, I _________ on the newly discovered dinosaur site in Argentina.There are remains of what is thought to be the largest creature ever to walk the earth.A.was working B.workC.will be working D.worked11.— Can you do me a favour, Mr. Smith? My car ______ start.— No problem. You can count on it.A.won’t B.mustn’tC.needn’t D.shouldn’t12.Those successful deaf dancers think that dancing is an activity ________ sight matters more than hearing. A.when B.whose C.which D.where13.--- Do you know what Tom does all day ?---- I know he spends at least as much time watching TV as he ____________his lessons.A.is doing B.does C.spends to do D.does doing14.We completed one third of the project, and the loan _______ in place, we had to delay the rest till the next month.A.not arranged B.was not arrangedC.not arranging D.had not been arranged15.Many people complained about the stones lying on a road, but _______ did anything about getting the stones out of the way.A.both B.no one C.none D.all16.It was not until she got home____Jennifer realized she had lost her keys.A.when B.thatC.where D.before17.---Hi, Johnson, any idea where Susan is?---It is class time, so she __________ in the classroom now.A.can be B.must have beenC.might have been D.should be18.Between the two generations, it is often not their age, _________ their education that causes misunderstanding.A.like B.as C.or D.but19.—How do you find the health club?—I would rather I ______ it. I feel its management is going from bad to worse.A.haven’t joined B.hadn’t joinedC.didn’t join D.had joined20.Considered to be a less dangerous to tobacco, "e-cigs" are taking over the West as more and more people switch over when trying to kick the habit.A.adjustment B.alternativeC.advertisement D.amusement第二部分阅读理解(满分40分)阅读下列短文,从每题所给的A、B、C、D四个选项中,选出最佳选项。
3月SAT亚太考试内容回顾阅读三精编版
2018年3月SAT亚太考试内容回顾阅读三第三篇:科学类鸟类协作可以抵御异种鸟类在自己鸟窝里面下蛋影响自身繁殖。
然后需要补充的细节是如果不小心异种鸟繁殖,会影响自己的繁殖。
所以一开始就要把成人的鸟赶出去,这个过程中socially 很重要。
原文:In the spring of 1879, Hermann Lau shot two white-winged choughs,Corcorax melanorhamphos, off their nest in Queensland, Australia. He watched asadditional choughs continued to attend the nest, proving that a cooperativegroup shared parental care ( 1). Since then, cooperatively breeding birds havehad a starring role in efforts to explain the evolution of complex animalsocieties. We now know that “helpersat-the-nest”who forgo reproduction areoften relatives of the breeding pair. Genetic payoff is, thus, one of severaladvantages that helpers can gain from their superfi cially altruistic behavior (2). On page 1506 of this issue, Feeney et al. ( 3) show that collective defenseagainst brood parasites (see the figure) can enhance such benefi ts ofcooperation. Why do some bird species cooperate and others do not? Globalanalyses have shown that cooperative breeding (now known from 9% of species) isassociated with a slow pace of life (characterized by high survival rates andlow turnover of breeding territories) ( 4), monogamy (which facilitates kinselection within families) ( 5), and unpredictable environments (such as aridzones) that might favor cooperation as a bet-hedging strategy ( 6). But thesefactors often fail to predict the incidence of cooperation among relatedspecies or within geographical regions ( 7). Feeney et al.’s study is built onthe premise that brood parasitism—reproductive cheating by species such ascuckoos and cowbirds, which exploit other birds to raise their young—is asevere selection pressure on their hosts’ breedingstrategies. Parasitizedparents typically not only lose their current offspring but also waste a wholebreeding season raising a demanding impostor. The best way to avoid parasitismis to repel adult parasites from the nest. Feeney et al. show that socialitycan be pivotal to this process. The authors begin by unfolding a new map. Usingdata compiled by BirdLife International, they show that the global distributionof cooperatively breeding birds overlaps strikingly with that of broodparasites. This overlap need not refl ect a causal relationship: The same unpredictable environments thatfavor cooperation could also favor alternative breeding strategies such asparasitism. However, the authors go on to show that even within geographicalregions rich in both parasites and cooperators—Australia and southern Africa—cooperativebreeders are much more likely than noncooperative species to be targeted bybrood parasites. To determine the reasons for this correlation, Feeney et al.studied cooperative breeding in superb fairy-wrens (Malurus cyaneus) inAustralia. Horsfield’s bronze-cuckoos (Chalcites basalis) should benefi t fromtargeting larger groups of fairy-wrens because more helpers mean faster chickgrowth. Yet, data from a 6-year field study show that in practice, cuckoosrarely experience this advantage, because larger groups of fairywrens much moreeffectively detect and repel egg-laying intrusions by cuckoo females,mobilizing group defenses with a cuckoospecifi c alarm call. Thus, cooperationand parasitism could reciprocally infl uence one another: Cooperators might bemore attractive targets because they make better foster parents, but once exploited by parasites, they are alsobetter able to fi ght back, helping cooperation to persist ( 8). Feeney et al. find that superior anticuckoo defenses in larger groups account for 0.2 moreyoung fl edged per season on average than smaller groups—a substantial boostgiven the fairy-wrens’ low annual fecundity. These results show convincinglythat defense against brood parasites augments the benefi ts of helping, promotingthe persistence of cooperation. But as the authors note, they cannot revealwhat caused cooperation to evolve initially. Brood parasitism alone cannotresolve the question of why some birds breed cooperatively. For example,cooperative kingfi shers and bee-eaters areheavily parasitized in Africa butnot in Australasia, showing that other advantages of helping behavior are sufficient for cooperation to persist. But we should take parasitism seriously as animportant force in a cooperative life. Indeed, it may provide a mechanismcontributing to the previously discovered global correlates of cooperation (4–6). Some insight into the likely order of evolution might come from furthercomparative predictions. For instance, if cooperation arose fi rst as a defenseagainst parasitism, cooperators may be most prevalent among hosts that relyheavily on repelling adult parasites, rather than on antiparasite strategies atlater reproductive stages, such as egg or chick discrimination ( 9). Incontrast, if parasites target existing cooperators because they providesuperior care, this should be especially true of parasites whose chicks havethe most pressing needs—for instance, those in parasitic families with largebody size relative to their hosts or those whose chicks do not kill host youngand therefore must share their foster parents’ care. Could there be a similarassociation between cooperation and parasitism among other highly socialanimals? Cooperation in mammals clearly persists irrespective of parasitism, giventhat there are no known brood-parasitic mammals (perhaps because it would bediffi cult for a mammal to insert live young into another’s care). Butrepelling parasitic egg-laying intrusions is crucial to many hosts of sociallyparasitic insects and has shaped sophisticated adaptations and counterdefensesfor and against brute force and secrecy ( 10). It will be fascinating toexplore how selection for antiparasitic defense has interacted with monogamyand defensible resources as forces favoring kin-selected cooperation ininvertebrates, touching on an active debate in evolutionary biology. Answers tosuch comparative questions will ultimately be limited by our knowledge ofnatural history. The work by Feeney et al. is testament to the evolutionaryinsights enabled by careful long-term fi eld studies, together with thecumulative legacy of those naturalists who made the unglamorous effort torecord and publish observations of real animals in real places.。
- 1、下载文档前请自行甄别文档内容的完整性,平台不提供额外的编辑、内容补充、找答案等附加服务。
- 2、"仅部分预览"的文档,不可在线预览部分如存在完整性等问题,可反馈申请退款(可完整预览的文档不适用该条件!)。
- 3、如文档侵犯您的权益,请联系客服反馈,我们会尽快为您处理(人工客服工作时间:9:00-18:30)。
Journal of Experimental Botany,Vol.61,No.6,pp.1699–1709,2010 doi:10.1093/jxb/erq042Advance Access publication4March,2010This paper is available online free of all access charges(see /open_access.html for further details)RESEARCH PAPERAssociation between winter anthocyanin production and drought stress in angiosperm evergreen speciesNicole M.Hughes1,*,Keith Reinhardt1,Taylor S.Feild2,Anthony R.Gerardi3and William K.Smith11Wake Forest University,Department of Biology,PO Box7325Reynolda Station,Winston-Salem,North Carolina27106-7325,USA2University of Tennessee,Department of Ecology and Evolutionary Biology,University of Tennessee,Knoxville TN,37996,USA3Wake Forest University,Department of Chemistry,PO Box7468Reynolda Station,Winston-Salem,North Carolina27106-7325,USA *To whom correspondence should be addressed:E-mail:nikymhughes@Received15October2009;Revised13January2010;Accepted2February2010AbstractLeaves of many evergreen angiosperm species turn red under high light during winter due to the production of anthocyanin pigments,while leaves of other species remain green.There is currently no explanation for why some evergreen species exhibit winter reddening while others do not.Conditions associated with low leaf water potentials (W)have been shown to induce reddening in many plant species.Because evergreen species differ in susceptibility to water stress during winter,it is hypothesized that species which undergo winter colour change correspond with those that experience/tolerate the most severe daily declines in leaf W during winter.Six angiosperm evergreen species which synthesize anthocyanin in leaves under high light during winter andfive species which do not were studied. Field W,pressure/volume curves,and gas exchange measurements were derived in summer(before leaf colour change had occurred)and winter.Consistent with the hypothesis,red-leafed species as a group had significantly lower midday W in winter than green-leafed species,but not during the summer when all the leaves were green. However,some red-leafed species showed midday declines similar to those of green-leafed species,suggesting that low W alone may not induce reddening.Pressure–volume curves also provided some evidence of acclimation to more negative water potentials by red-leafed species during winter(e.g.greater osmotic adjustment and cell wall hardening on average).However,much overlap in these physiological parameters was observed as well between red and green-leafed species,and some of the least drought-acclimated species were red-leafed.No difference was observed in transpiration(E)during winter between red and green-leaved species.When data were combined,only three of the six red-leafed species examined appeared physiologically acclimated to prolonged drought stress,compared to one of thefive green-leafed species.This suggests that drought stress alone is not sufficient to explain winter reddening in evergreen angiosperms.Key words:Anthocyanin,carbohydrates,drought,evergreen,osmolarity,photosynthesis,sugars,winter,water relations. IntroductionThe question of a functional significance of anthocyanin pigments in leaves has received substantial attention in the recent literature(see reviews by Chalker-Scott,1999;Manetas, 2006;Archetti et al.,2009).Comparatively little attention has been given to the question of why only certain species change leaf colour from green to red during certain ontogenetic stages or seasons while others do not.During winter,the leaves of many evergreen angiosperms turn a range of red to purple colours in response to high sunlight exposure,due to the synthesis of anthocyanin pigments(Oberbauer and Starr, 2002;Hughes and Smith,2007;Kytridis et al.,2008).In some species,leaf colour change may be winter-transient,with le-aves metabolizing anthocyanins to become green again with the return of springtime warming.Leaves of other winter-redAbbreviations:ROS,reactive oxygen species;VPD,vapour pressure deficit;W,water potential;W p,100,osmotic potential at full turgor;W p,0,osmotic potential at the turgor loss point;%RWC0,relative water content at the turgor loss point;SWF,symplastic water fraction;e,bulk modulus of elasticity;A,photosynthesis;g s,stomatal conductance;E,transpiration.ª2010The Author(s).This is an Open Access article distributed under the terms of the Creative Commons Attribution Non-Commercial License(/licenses/by-nc/2.5),which permits unrestricted non-commercial use,distribution,and reproduction in any medium,provided the original work is properly cited. by guest on December 14, 2010 Downloaded fromspecies senesce while still red at winter’s end,concomitant with a flush of new,green leaves.By contrast,other ever-green angiosperms maintain leaves that are entirely green throughout the winter.Many of these winter-green species do synthesize anthocyanins in other tissues or during different ontogenetic stages,such as in juvenile leaves,flowers,stems,roots,senescing leaves,and/or in response to pathogen in-fection.Their lack of anthocyanin in winter leaves suggests that anthocyanins are not beneficial for these species during the winter season.However,this assumption remains un-tested,and why some evergreen species synthesize anthocya-nin in winter leaves,while others do not,is currently unknown (Hughes and Smith,2007).An explanation for redness versus greenness during winter is complicated by a lack of consensus among plant physiologists regarding the physiological function of anthocyanins in leaf tissues (see reviews by Manetas,2006;Archetti et al.,2009).Most research seeking to determine a functional role of an-thocyanins in evergreen leaves has focused on their putative roles in photoprotection (Hughes et al.,2005;Hughes and Smith,2007;Kytridis et al.,2008).Winter leaves are es-pecially vulnerable to high light stress,as low temperatures reduce the rate at which leaves may process sunlight for pho-tosynthesis,thereby resulting in an imbalance of energy ca-pture versus processing.This imbalance may lead to an increase in light energy that is transferred from chlorophyll to oxygen,resulting in the production of reactive oxygen species (ROS)and tissue damage (Powles,1984;Hu ¨ner et al.,1998;Adams et al.,2004).Anthocyanins are thought to minimize photo-oxidative damage by either absorbing green light,thereby reducing the amount of light absorbed by photopig-ments (Feild et al.,2001;Lee and Gould,2002;Hughes et al.,2005),and/or through neutralizing ROS directly as antiox-idants (Gould et al.,2002;Nagata et al.,2003;Kytridis and Manetas,2006).The idea that winter redness reflects an in-creased need for photoprotection has been supported in some studies (Kytridis et al.,2008),but not others (Hughes and Smith,2007).Much evidence also exists counter to a photo-protective function in senescing (Lee et al.,2003),young (Dodd et al.,1998;Manetas et al.,2003;Karageorgou and Manetas,2006),and mature (Kyparissis et al.,2007;Kytridis et al.,2008)leaves,rendering additional explanations for win-ter colour change timely and necessary.In addition to the well-described relationship between an-thocyanins and high light stress,there also exists some cor-relative evidence for a relationship between anthocyanins and osmotic stress (Chalker-Scottt,1999,2002).Specifically,anthocyanin synthesis is known to be inducible under high salinity (Dutt et al.,1991;Ramanjulu et al.,1993;Kaliamoorthy and Rao,1994;Eryilmaz,2006),drought (Spyropoulos and Mavrommatis,1978;Balakumar et al.,1993;Sherwin and Farrant,1998;Yang et al.,2000),and sugar treatments (Sakamoto et al.,1994;Suzuki,1995;Tholakalabavi et al.,1997).Furthermore,species with high levels of foliar anthocyanin seem to be common in environ-ments characterized by low soil moisture (Spyropoulos and Mavormmatis,1978),and are more tolerant of drought conditions (Diamantoglou et al.,1989;Knox,1989;Beeson,1992;Paine et al.,1992).Because winter conditions are often accompanied by environmental and physiological factors that promote drought stress [e.g.low vapour pressure deficit (VPD )of air,low soil moisture,freezing of apoplastic water in leaves,and reduced hydraulic conductivity of xylem due to freeze–thaw embolisms],it is possible that anthocyanin synthesis during winter may correspond with relative differences in water stress in some species compared to others.Indeed,evergreen species are known to differ significantly in vulnera-bility to water stress during the winter months,due to differences in xylem cavitation,solute accumulation,cell wall hardening,freezing damage,and transpirational and cuticular water loss (Davis et al.,1999;Uemera and Steponkus,1999;Taneda and Tateno,2005).Because anthocyanin synthesis is known to be inducible by lower leaf water potentials,perhaps those species experiencing the greatest leaf water deficits during the day (due to any combination of the above)would correspond with those that synthesize anthocyanin.Within a functional context,a light-attenuating or antioxidant func-tion of anthocyanin would be suitable under such conditions,as low leaf water potentials have been linked with the degradation of chlorophyll (Eryilmaz,2006),increased photorespiration,and an increase in free radicals (Halliwell and Gutteridge,1986;Xiong and Zhu,2002),resulting in damage to structural and functional proteins,membrane lipids,and nucleic acids (Fridovich,1986;Smirnoff,1998;Xiong and Zhu,2002).The objective of this study was to test the hypothesis that species which synthesize anthocyanin during winter are those which experience (i.e.tolerate)the most extreme declines in daily water potentials.First,this hypothesis was tested di-rectly by measuring seasonal predawn and midday water potentials (W )in the field,and,secondly,by examining cell characteristics indicative of acclimation to prolonged water stress (e.g.osmotic adjustment and cell wall hardening).Materials and methodsSix winter-red evergreen angiosperm species and five winter-green species were measured for field leaf W to determine whether winter-red species had the greatest declines in leaf W during the day.Pressure–volume methodology was also carried out on these species in the laboratory to assess relative physiological acclimation to water stress (e.g.osmotic adjustment and cell wall hardening),to determine whether red-leafed species exhibited physiological adjust-ments indicative of acclimation to prolonged drought stress.Sites and speciesWinter red-leafed species included:Galax urceolata (Poir.)Brummitt,Lonicera japonica (Thunb.),Gaultheria procumbens (L.),Leucothoe fontanesiana (Steud.)Sleumer,Hedera helix (L.),Rhododendron spp.(a horticultural azalea);winter green-leafed species included:Vinca minor (L.),Rhododendron catawbiense (Michx.),Kalmia latifolia (L.),Rhododendron maximum (L.),and Rhododendron spp.(a horticultural azalea).Study plants were mature individuals growing in sun-exposed embankments 5–20m from roadsides in Jonas Ridge,NC,USA (35°57#20##N,81°53#55##W;altitude:c .1200m)on south-or south-east-facing sites receiving >6h full sunlight (i.e.>1350l mol m À2s À1on a horizontal surface at solar noon)per day during both summer and winter months.Measurements were taken on clear sunny days,on sun-exposed,south-facing,first-year leaves.Detailed descriptions1700|Hughes et al.by guest on December 14, 2010 Downloaded fromof most of these species are given in Hughes and Smith(2007).Most growth forms used were vines and herbs,in which case leaves were randomly sampled.In the case of shrubs,first-year leaves(i.e.apical leaves for all Rhododendron spp.and tifolia)were sampled at roughly1–1.5m above the ground.Field temperatures were derived from a localfield station,approximately8km from the study site, archived online at /weatherstation/ WXDailyHistory.asp?ID¼KNCCROSS1.Field W measurementsLeaf water potentials(W)were measured on four winter days:14 December2007(max:13°C;min:6°C),17January2008(max:3°C; min:–3°C),15February2008(max:14°C;min:0°C),and2March 2008(max:13°C;min:–4°C),and one autumn day before leaves had changed colour,30September2008(max:21°C;min:6°C).Since V. minor and L.japonica(green and red-leafed species,respectively) lacked petioles,stem W withfive attached leaves were substituted. First-year,sun-exposed leaves or stems from at leastfive separate individuals of each species were excised in thefield at predawn (05.00–07.00h)and midday(11.00–13.00h,kept in plastic bags from which air had been removed,and stored on ice until me-asurement within4h.W values were derived using a Scholander-type pressure chamber(Model1000,PMS Instrument Company, Corvallis,OR)with nitrogen gas(Turner,1981).Field measure-ments were compared with measurements after4h storage on ice, and no significant changes in W were observed.It should be noted that measurements on leaves that still appeared to be frozen(i.e. initial W values<–6MPa,with W becoming substantially less negative after2–5min of warming)were not used in the analyses. However,these potentially frozen leaves were only observed during the January predawn measurement of H.helix and G.urceolata. Because freezing could not be empirically verified for these leaves, statistical tests were run both with and without‘frozen’leaf values. Statistics were also run with and without the January measurement day entirely,as,even when frozen data were excluded,predawn W of all species were suspiciously low(with W for half of the species being more negative than the subsequent midday measurements). Unfortunately,because no W measurements were made during the previous day,it was not possible to determine whether these low predawn values were due to an inability to recharge(which can be caused by a variety of factors known to limit water uptake under freezing or near-freezing temperatures),further declines in W during the night,or measurement error.Pressure–volume curvesPressure–volume curves were plotted for each species using leaf or stem material excised one month before colour change(October)and one month after(December).First-year leaves were used in all cases. Three tofive leaves were excised from separate individuals in thefield, stored in sealed plastic bags,and transported on ice.Petioles were recut underwater,and leaves were hydrated overnight.The following day,pressure–volume curves were derived using methodology de-scribed in Turner(1981).Briefly,leaf W was measured periodically as leaves transpired freely;leaf mass was determined immediately fo-llowing each measurement.At leastfive points on the curve were derived for each leaf,and at leastfive points on the line following turgor loss.Dry mass was determined following completion of the curve by drying leaves in an oven at80°C until a constant mass was achieved.Water relations parameters derived from graphical and linear regression analyses included:osmotic potential at full turgor (W p,100),osmotic potential at the turgor loss point(W p,0),relative water content at the turgor loss point(%RWC0),symplastic water fraction(SWF),and the bulk modulus of elasticity(e)between95% and98%RWC(Turner,1981).Leaf gas exchangeMaximum photosynthesis,A max;stomatal conductance,g s;and transpiration,E,were measured from4December2005until4March2006,and between15–17December2007.Onlyfirst-year leaves under full ambient sunlight(>1350l mol mÀ2sÀ1)were measured at midday(11.00h until15.00h)on warm days(dailyhigh temperature>18°C),in order to obtain maximum winter gas exchange values.The on-board CO2mixer was set at400ppm,andVPD was adjusted to ambient conditions(c. 2.3).Plants were sampled via a standard random-walk procedure.A Li-Cor modelLi-6400(Li-Cor Inc.,Lincoln,NE,USA)equipped with an LED chamber(model Li-6400-02B)was used to measure leaf gas exchange,with the LED light source set to1500l mol mÀ2sÀ1 (simulating high light ambient conditions).Chamber temperatureand relative humidity were matched to ambient conditions.SugarsSugar concentrations in leaves were determined by High PressureLiquid Chromatography(HPLC),using a Waters Alliance2695 system.Two hundred milligrams of freeze-dried leaf tissue was weighed into a10ml disposable borosilicate test tube.Four millilitresof deionized water was added and the test tube was shaken at350rpm on an orbital shaker for30min.Standard reagentsofFig.1.(A)Mean predawn and midday summer water potentialsfor species that either turn red(left half)or remain green(right half)during winter.(B)Delta water potential between predawn andmidday.Bars represent means of5–10replicates;error barsrepresent standard deviation.Measurements were derived on30September,2008(High:21°C,Low5°C).Drought stress and winter colour change|1701by guest on December 14, 2010Downloaded fromsucrose,glucose,and fructose were obtained from Sigma Aldrich and were dissolved in distilled,deionized water to a concentration of 3.0mg mlÀ1.Subsequent dilutions of the stock were prepared to1.5, 0.9,and0.3mg mlÀ1for4-point quadratic calibration curves. Separations were carried out on a7353mm Altech Prevail Carbohydrate ES Rocket column maintained at50°C,using an isocraticflow of2.0ml minÀ1,an injection volume of2l l,and an analysis time of6min.The mobile phase consisted of75%acetonitrile and25%water. Sugars were detected with a Waters2420evaporative light scattering detector(ELSD)with a drift tube temperature of50°C;N2as the nebulizer gas at50psi;and the nebulizer heater set to40%. StatisticsAll data except sugar analyses were transformed by log10for nor-mality(determined as P>0.05by the Shapiro–Wilks test).The association between leaf colour and predawn and midday W were assessed for each measurement month separately using a random-effects,nested MANOVA with identity contrast(with species nested within colour,and species being the random effect).The change in winter W between predawn and midday was calculated for each species as(average winter predawn W–average winter mid-dawn W); red and green species values were pooled and compared using a one-tailed Student’s t test with unequal variance.The effects of leaf colour on W p,100,W p,0,RWC0,SWF,and e were analysed using a nested,random-effects MANOVA with identity contrast.The effects of leaf colour on sucrose,glucose,fructose,and total soluble sugars were analysed using a nested standard least squares test for each sugar type separately.Significance was determined as P<0.05 for all tests.Seasonal comparisons(i.e.summer versus winter)for soluble sugars and pressure–volume curve measurements for in-dividual species were compared using a one-tailed Student’s t test with equal variance.Winter gas exchange parameters(photosynthe-sis,stomatal conductance,and transpiration)for red and green-leafed species were compared by random-effects,nested MANOVA. ResultsSeasonal WDuring September(before colour change had occurred), summer green leaves of winter-red species had significantly lower predawn W compared with those of perennially green-leafed species( x¼–0.45MPa for red,–0.38MPa for green; P¼0.04);during midday the reverse was observed—leaves of green-leafed species had significantly lower W than those of red-leafed species( x¼–0.88MPa for red,–1.03MPa for green;P<0.01)(Fig.1A).There was no significantdifferenceFig.2.Mean predawn(A)and midday(B)water potential values of red-leafed species(solid lines,black symbols)and green-leafedspecies(dashed lines,white symbols)from September through March.Note that during September,leaves of all species were green.Points represent means of5–10replicates;error bars represent standard deviation.For dates and temperature details,refer to‘Fieldwater potential measurements’in the Materials and methods.1702|Hughes et al.by guest on December 14, 2010Downloaded fromin mean change in W between predawn and midday in September between the two groups (P >0.05)(Fig.1B ).Winter predawn W in December,January,and February showed no difference between red and green-leafed species (P ¼0.56,0.25,and 0.52,respectively);during March,green-leafed species had significantly lower predawn W compared to red (P <0.0001)(Figs 2,3).When data for all winter months were pooled,red and green-leafed species did not significantly differ with regards to predawn W (P ¼0.24).During midday,red-leafed species had significantly lower W values compared to green-leafed species during December,January,and March (P <0.0001for all)but not during February (P ¼0.37).When all data for the winter months were pooled,red-leafed species had significantly lower midday W values compared to green-leafed species (P <0.0001).There was no significant change in daily W between red and green-leafed species in December,January,or February (P ¼0.15,0.48,0.35).In March,red-leafed species had a significantly greater mean decline in Wcompared to green-leafed species ( x¼1.2MPa for red,0.13MPa for green;P ¼0.01).When all winter months were pooled,red-leafed species showed marginally greater decline in mean W (P ¼0.09)(Fig.3D ).Most species had significantly lower predawn and midday W during winter compared to summer (P <0.05)with exceptions including the winter green-leafed V .minor ,which had similar predawn and midday W values during summer and winter (P ¼0.45for predawn;0.16for midday);L .japonica ,which had significantly less negative predawn W during winter compared to summer (P ¼0.04);and the red-leafed Rhododendron sp.,which had similar midday W values between summer and winter (P ¼0.14)(Fig.2).Including potentially ‘frozen’leaf W measurements for H .helix and G .urceolata in January resulted in red-leafed species having significantly more negative predawn values compared to green-leafed species (with ‘frozen’data,P ¼0.0001;without,P ¼0.25).However,when all winter measurements were pooled,inclusion or exclusion of the ‘frozen’tissue did not affect the overall significance of predawn comparisons (without ‘frozen’tissue:P ¼0.24;with P ¼0.77).Also,the inclusion or exclusion of these data did not affect the statistical significance of the mean change in W between predawn and midday during January (P ¼0.48both with and without ‘frozen’data),or when all winter months were pooled (P ¼0.09both with and without).Inclusion or ex-clusion of the January data for all species (as measurement error might have been responsible for very low predawn values observed in general)also did not affect the overall results (red versus green-leaf predawn W with January data:P ¼0.83;without January data:P ¼0.21;midday W with January data:P <0.0001;without:P ¼0.0012).Fig.3.Winter water potential values for red (left half of graphs)and green-leafed species (right half).Monthly mean predawn (A)and midday (B)water potentials;(C)average winter predawn andmidday water potential values;(D)average delta water potentials between predawn and midday.Bars represent means of 5–10replicates;error bars depict standard deviation (A,B,D)andstandard error (C).For dates and temperature details,refer to ‘Field water potential measurements’in the Materials and methods.Drought stress and winter colour change |1703by guest on December 14, 2010 Downloaded fromPressure–volume curvesPressure–volume curves revealed no significant difference in W p ,100of summer leaves of green versus red species (P ¼0.29),but during winter,W p ,100of red-leafed species were morenegative ( x¼–1.6MPa for green and –2.0MPa for red;P <0.01);Figs 4,5D ;Table 1.SWF at full turgor,and bulk modulus of elasticity at 96.5%RWC were significantly higher for red-leafed species compared to green during both summer (SWF ¼0.57MPa for green and 0.66for red;e ¼12.9MPa for green and 16.5for red;P <0.05in both cases)and winter (SWF ¼0.34and 0.42for green and red;e ¼15.3MPa and 19.1MPa for red and green,respectively;P <0.01for both).During summer,W p ,0was more negative and RWC 0lower in leaves of species that remain green during winter than inleaves that turned red (W p ,0 x¼–2.1MPa for green,–1.8MPa for red;P <0.0001;%RWC 0 x¼0.87for green,0.91for red P <0.0001).However,these two groups did not differ duringwinter after colour change had occurred (W p ,0 x¼–2.6MPa and –2.7MPa for green and red,respectively,P ¼0.23;%RWC 0¼0.87for green,0.89for red;P ¼0.1).SugarsAll red and green-leafed species showed significant increases in the combined amounts of glucose+fructose+sucrose during winter,with the exception of the red-leafed G .procumbens (Table 1;Fig.6).Seasonal levels of total sugars (glucose+fructose+sucrose)were not significantly different between red and green-leafed species during summer(P ¼0.66)or winter (P ¼0.23).All red-leafed species increased the glucose content during winter (significant at P <0.05for all but H .helix ),and most increased the fructose and sucrose contents as well (Table 1).Half of the green-leafed species measured did not show significant increases in fructose or sucrose contents during winter,although most significantly increased glucose (the only exception being K .latifolia ).Red-leaved species had significantly higher sucrose contentsduring the summer than green-leafed species ( x¼9.7mg g À1for green,22mg g À1for red;P <0.0001),but during winter,green-leafed species had significantly higher sucrose content ( x¼53mg g À1for green,39mg g À1for red;P <0.0001)(Fig.6;Table 1).Green-leaved species had significantly higher glucose and fructose contents during summer than red leaves (P <0.0005for both),but red-leaved species had significantly higher glucose during winter (P <0.01);red and green-leafed species did not differ in fructose content during winter (P ¼0.78).Leaf gas exchangeRed and green-leaved species did not significantly differ in any gas exchange parameters during winter (Fig.7).Mean winter photosynthesis was 4.2l mol CO 2m À2s À1for red and 3.6l mol CO 2m À2s À1for green (P ¼0.14);mean winter stomatal conductance (g s )was 0.043mol m À2s À1for red and 0.049mol m À2s À1for green (P ¼0.12);and mean winter transpiration (E )was 79mmol m À2s À1for red and 93mmol m À2s À1for green (P ¼0.16).Fig.4.(A,B)Seasonal pressure–volume curves for winter red-leafed (A)and green-leafed (B)angiosperm evergreen species.Open circles with dashed lines represent winter measurements (after leaf colour change had occurred),solid circles represent summer measurements (prior to leaf colour change).Curves were derived from leaves of 3–5separate individuals.1704|Hughes et al.by guest on December 14, 2010 Downloaded fromDiscussionConsistent with our hypothesis,red-leafed species had sig-nificantly more negative midday W during winter compared to green-leafed species during three of the four winter measurement days(Figs2,3),as well as when all winter days were pooled(Fig.3C).Furthermore,pressure–volume curves showed that red-leafed species,as a group,were more likely to exhibit physiological features characteristic of acclimation to prolonged drought stress,i.e.significantly more negative osmotic potential at full turgor(W p,100)and greater cell wall hardening(e)than green-leafed species (Table1;Fig.5B,D);the two groups did not differ in these characteristics during the summer when all leaves were green(Table1;Fig.1).Low osmotic potential at full turgor is generally indicative of an increased accumulation of solutes(osmotic adjust-ment),which is a physiological strategy for retaining water osmotically during periods of water stress(Verslues et al.,Fig.5.Data derived from winter pressure–volume curves.Left column,from top to bottom:(A)per cent relative water content at turgorloss point,(B)symplastic water fraction at full turgor,and(C)bulk modulus of elasticity between95%and98%RWC.Right column,fromtop to bottom:(D)osmotic potential at full turgor,(E)osmotic potential at turgor loss point.Bars represent means of3–5replicates,errorbars are standard deviation.Drought stress and winter colour change|1705by guest on December 14, 2010Downloaded from。