Lens binarity vs limb darkening in close-impact galactic microlensing events
Learning to detect natural image boundaries using local brightness, color, and texture cues

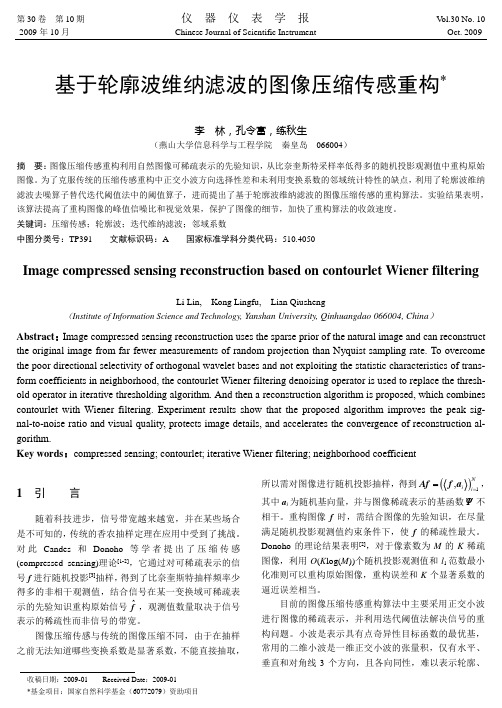
David R.Martin Charless C.Fowlkes Jitendra MalikComputer Science Division,EECS,U.C.Berkeley,Berkeley,CA94720dmartin,fowlkes,malik@AbstractThe goal of this work is to accurately detect and localize boundaries innatural scenes using local image measurements.We formulate featuresthat respond to characteristic changes in brightness and texture associatedwith natural boundaries.In order to combine the information from thesefeatures in an optimal way,a classifier is trained using human labeledimages as ground truth.We present precision-recall curves showing thatthe resulting detector outperforms existing approaches.1IntroductionConsider the image patches in Figure1.Though they lack global context,it is clear which contain boundaries and which do not.The goal of this paper is to use features extracted from the image patch to estimate the posterior probability of a boundary passing through the center point.Such a local boundary model is integral to higher-level segmentation algo-rithms,whether based on grouping pixels into regions[21,8]or grouping edge fragments into contours[22,16].The traditional approach to this problem is to look for discontinuities in image brightness. For example,the widely employed Canny detector[2]models boundaries as brightness step edges.The image patches show that this is an inadequate model for boundaries in natural images,due to the ubiquitous phenomenon of texture.The Canny detector willfire wildly inside textured regions where high-contrast contours are present but no boundary exists.In addition,it is unable to detect the boundary between textured regions when there is only a subtle change in average image brightness.These significant problems have lead researchers to develop boundary detectors that ex-plicitly model texture.While these work well on synthetic Brodatz mosaics,they have problems in the vicinity of brightness edges.Texture descriptors over local windows that straddle a boundary have different statistics from windows contained in either of the neigh-boring regions.This results in thin halo-like regions being detected around contours. Clearly,boundaries in natural images are marked by changes in both texture and brightness. Evidence from psychophysics[18]suggests that humans make combined use of these two cues to improve detection and localization of boundaries.There has been limited work in computational vision on addressing the difficult problem of cue combination.For example, the authors of[8]associate a measure of texturedness with each point in an image in order to suppress contour processing in textured regions and vice versa.However,their solution is full of ad-hoc design decisions and hand chosen parameters.The main contribution of this paper is to provide a more principled approach to cue com-bination by framing the task as a supervised learning problem.A large dataset of natural images that have been manually segmented by multiple human subjects[10]provides theground truth label for each pixel as being on-or off-boundary.The task is then to model the probability of a pixel being on-boundary conditioned on some set of locally measured image features.This sort of quantitative approach to learning and evaluating boundary detectors is similar to the work of Konishi et al.[7]using the Sowerby dataset of En-glish countryside scenes.Our work is distinguished by an explicit treatment of texture and brightness,enabling superior performance on a more diverse collection of natural images. The outline of the paper is as follows.In Section2we describe the oriented energy and texture gradient features used as input to our algorithm.Section3discusses the classifiers we use to combine the local features.Section4presents our evaluation methodology along with a quantitative comparison of our method to existing boundary detection methods.We conclude in Section5.2Image Features2.1Oriented EnergyIn natural images,brightness edges are more than simple steps.Phenomena such as spec-ularities,mutual illumination,and shading result in composite intensity profiles consisting of steps,peaks,and roofs.The oriented energy(OE)approach[12]can be used to detect and localize these composite edges[14].OE is defined as:where and are a quadrature pair of even-and odd-symmetricfilters at orientation and scale.Our even-symmetricfilter is a Gaussian second-derivative,and the corre-sponding odd-symmetricfilter is its Hilbert transform.has maximum response for contours at orientation.We compute OE at3half-octave scales starting atthe image diagonal.Thefilters are elongated by a ratio of3:1along the putative boundary direction.2.2Texture GradientWe would like a directional operator that measures the degree to which texture varies at a location in direction.A natural way to operationalize this is to consider a disk of radius centered on,and divided in two along a diameter at orientation.We can then compare the texture in the two half discs with some texture dissimilarity measure. Oriented texture processing along these lines has been pursued by[19].What texture dissimilarity measure should one use?There is an emerging consensus that for texture analysis,an image shouldfirst be convolved with a bank offilters tuned to various orientations and spatial frequencies[4,9].Afterfiltering,a texture descriptor is then constructed using the empirical distribution offilter responses in the neighborhood of a pixel.This approach has been shown to be very powerful both for texture synthesis[5]as well as texture discrimination[15].Puzicha et al.[15]evaluate a wide range of texture descriptors in this framework.We choose the approach developed in[8].Convolution with afilter bank containing both even and oddfilters at multiple orientations as well as a radially symmetric center-surround filter associates a vector offilter responses to every pixel.These vectors are clustered using k-means and each pixel is assigned to one of the cluster centers,or textons.Texture dissimilarities can then be computed by comparing the histograms of textons in the two disc halves.Let and count how many pixels of texton type occur in each half disk.Image IntensityN o n -B o u n d a r i e sB o u n d a r i e sFigure 1:Local image features.In each row,the first panel shows the image patch.The followingpanels show feature profiles along the line marked in each patch.The features are raw image intensity,raw oriented energy ,localized oriented energy ,raw texture gradient ,and localized texture gradient .The vertical line in each profile marks the patch center.The challenge is to combine these features in order to detect and localize boundaries.We define the texture gradient (TG)to be the distance between these two histograms:The texture gradient is computed at each pixelover 12orientations and 3half-octavescales starting at of the image diagonal.2.3LocalizationThe underlying function we are trying to learn is tightly peaked around the location of image boundaries marked by humans.In contrast,Figure 1shows that the features we have discussed so far don’t have this structure.By nature of the fact that they pool information over some support,they produce smooth,spatially extended outputs.The texture gradient is particularly prone to this effect,since the texture in a window straddling the boundary is distinctly different than the textures on either side of the boundary.This often results in a wide plateau or even double peaks in the texture gradient.Since each pixel is classified independently,these spatially extended features are partic-ularly problematic as both on-boundary pixels and nearby off-boundary pixels will have large OE and TG.In order to make this spatial structure available to the classifier we trans-form the raw OE and TG signals in order to emphasize local maxima.Given a featuredefined over spatial coordinate orthogonal to the edge orientation,consider the derived feature,where is thefirst-order approximation of the distance to the nearest maximum of.We use the stabilized version1Windowed parabolicfitting is known as2nd-order Savitsky-Golayfiltering.We also considered Gaussian derivativefilters to estimate with nearly identical results.2Thefitted values are=0.1,0.075,0.013and=2.1,2.5,3.1for OE,and=.057,.016,.005 and=6.66,9.31,11.72for TG.is measured in pixels.00.250.50.75100.250.50.751P r e c i s i o nRecall Raw Featuresall F=.65oe0 F=.59oe1 F=.60oe2 F=.61tg0 F=.64tg1 F=.64tg2 F=.610.250.50.75100.250.50.751P r e c i s i o nRecall Localized Featuresall F=.67oe0 F=.60oe1 F=.62oe2 F=.63tg0 F=.65tg1 F=.65tg2 F=.63Figure 2:Performance of raw (left)and localized features (right).The precision and recall axes aredescribed in Section 4.Curves towards the top (lower noise)and right (higher accuracy)are more desirable.Each curve is scored by the F-measure,the value of which is shown in the legend.In all the precision-recall graphs in this paper,the maximum F-measure occurs at a recall of approximately 75%.The left plot shows the performance of the raw OE and TG features using the logistic regression classifier.The right plot shows the performance of the features after applying the localization process of Equation 1.It is clear that the localization function greatly improves the quality of the individual features,especially the texture gradient.The top curve in each graph shows the performance of the features in combination.While tuning each feature’sparameters individually is suboptimal,overall performance still improves.consider small binary trees up to a depth of 3(8experts).The model is initialized in a greedy,top-down manner and fit with EM.Support Vector Machines We use the SVM package libsvm [3]to do soft-margin clas-sification using Gaussian kernels.The optimal parameters were =0.2and =0.2.The ground truth boundary data is based on the dataset of [10]which provides 5-6human segmentations for each of 1000natural images from the Corel image database.We used 200images for training and algorithm development.The 100test images were used only to generate the final results for this paper.The authors of [10]show that the segmentations of a single image by the different subjects are highly consistent,so we consider all human-marked boundaries valid.We declare an image location to be on-boundary if it is within =2pixels and =30degrees of any human-marked boundary.The remainder are labeled off-boundary.This classification task is characterized by relatively low dimension,a large amount of data (100M samples for our 240x160-pixel images),and poor separability.The maximum fea-sible amount of data,uniformly sampled,is given to each classifier.This varies from 50M samples for density estimation to 20K samples for the SVM.Note that a high degree of class overlap in any local feature space is inevitable because the human subjects make use of both global constraints and high-level information to resolve locally ambiguous bound-aries.4ResultsThe output of each classifier is a set of oriented images ,which provide the probability of a boundary at each image location based on local information.For several of the00.250.50.75100.250.50.751P r e c i s i o nRecall (a) Feature Combinationsall F=.67oe2+tg1 F=.67tg* F=.66oe* F=.6300.250.50.75100.250.50.751P r e c i s i o n Recall (b) ClassifiersDensity Estimation F=.68Classification Tree F=.68Logistic Regression F=.67Quadratic LR F=.68Boosted LR F=.68Hier. Mix. of Experts F=.68Support Vector Machine F=.66Figure 3:Precision-recall curves for (a)different feature combinations,and (b)different classifiers.The left panel shows the performance of different combinations of the localized features using the logistic regression classifier:the 3OE features (oe*),the 3TG features (tg*),the best performing single OE and TG features (oe2+tg1),and all 6features together.There is clearly independent infor-mation in each feature,but most of the information is captured by the combination of one OE and one TG feature.The right panel shows the performance of different classifiers using all 6features.All the classifiers achieve similar performance,except for the SVM which suffers from the poor sep-aration of the data.Classification trees performs the best by a slim margin.Based on performance,simplicity,and low computation cost,we favor the logistic regression and its variants.classifiers we consider,the image provides actual posterior probabilities,which is par-ticularly appropriate for the local measurement model in higher-level vision applications.For the purpose of evaluation,we take the maximum over orientations.In order to evaluate the boundary model against the human ground truth,we use the precision-recall framework,a standard evaluation technique in the information retrieval community [17].It is closely related to the ROC curves used for by [1]to evaluate bound-ary models.The precision-recall curve captures the trade-off between accuracy and noise as the detector threshold is varied.Precision is the fraction of detections which are true pos-itives,while recall is the fraction of positives that are detected.These are computed using a distance tolerance of 2pixels to allow for small localization errors in both the machine and human boundary maps.The precision-recall curve is particularly meaningful in the context of boundary detection when we consider applications that make use of boundary maps,such as stereo or object recognition.It is reasonable to characterize higher level processing in terms of how much true signal is required to succeed,and how much noise can be tolerated.Recall provides the former and precision the latter.A particular application will define a relative cost between these quantities,which focuses attention at a specific point on the precision-recall curve.The F-measure ,defined as ,captures this trade-off.The location of the maximum F-measure along the curve provides the optimal threshold given ,which we set to 0.5in our experiments.Figure 2shows the performance of the raw and localized features.This provides a clear quantitative justification for the localization process described in Section 2.3.Figure 3a shows the performance of various linear combinations of the localized features.The com-bination of multiple scales improves performance,but the largest gain comes from using OE and TG together.00.250.50.75100.250.50.751P r e c i s i o n Recall (a) Detector ComparisonHuman F=.75Us F=.67Nitzberg F=.65Canny F=.570.40.50.60.70.8F -M e a s u r e Tolerance (in pixels)(b) F-Measure vs. Tolerance Figure 4:The left panel shows precision-recall curves for a variety of boundary detection schemes,along with the precision and recall of the human segmentations when compared with each other.The right panel shows the F-measure of each detector as the distance tolerance for measuring precision and recall varies.We take the Canny detector as the baseline due to its widespread use.Our detector outperforms the learning-based Nitzberg detector proposed by Konishi et al.[7],but there is still a significant gap with respect to human performance.The results presented so far use the logistic regression classifier.Figure 3b shows the per-formance of the 7different classifiers on the complete feature set.The most obvious trend is that they all perform similarly.The simple non-parametric models –the classification tree and density estimation –perform the best,as they are most able to make use of the large quantity of training data to provide unbiased estimates of the posterior.The plain logistic regression model performs extremely well,with the variants of logistic regression –quadratic,boosted,and HME –performing only slightly better.The SVM is a disap-pointment because of its lower performance,high computational cost,and fragility.These problems result from the non-separability of the data,which requires 20%of the training examples to be used as support vectors.Balancing considerations of performance,model complexity,and computational cost,we favor the logistic model and its variants.3Figure 4shows the performance of our detector compared to two other approaches.Be-cause of its widespread use,MATLAB’s implementation of the classic Canny [2]detector forms the baseline.We also consider the Nitzberg detector [13,7],since it is based on a similar supervised learning approach,and Konishi et al.[7]show that it outperforms pre-vious methods.To make the comparisons fair,the parameters of both Canny and Nitzberg were optimized using the training data.For Canny,this amounts to choosing the optimal scale.The Nitzberg detector generates a feature vector containing eigenvalues of the 2nd moment matrix;we train a classifier on these 2features using logistic regression.Figure 4also shows the performance of the human data as an upper-bound for the algo-rithms.The human precision-recall points are computed for each segmentation by com-paring it to the other segmentations of the same image.The approach of this paper is a clear improvement over the state of the art in boundary detection,but it will take the addi-tion of high-level and global information to close the gap between the machine and human performance.5ConclusionWe have defined a novel set of brightness and texture cues appropriate for constructing a local boundary model.By using a very large dataset of human-labeled boundaries in natural images,we have formulated the task of cue combination for local boundary detection as a supervised learning problem.This approach models the true posterior probability of a boundary at every image location and orientation,which is particularly useful for higher-level algorithms.Based on a quantitative evaluation on100natural images,our detector outperforms existing methods.References[1]K.Bowyer,C.Kranenburg,and S.Dougherty.Edge detector evaluation using empirical ROCcurves.Proc.IEEE put.Vision and Pattern Recognition,1999.[2]J.Canny.A computational approach to edge detection.IEEE Trans.Pattern Analysis andMachine Intelligence,8:679–698,1986.[3] C.Chang and C.Lin.LIBSVM:a library for support vector machines,2001.Software availableat .tw/˜cjlin/libsvm.[4]I.Fogel and D.Sagi.Gaborfilters as texture discriminator.Bio.Cybernetics,61:103–13,1989.[5] D.J.Heeger and J.R.Bergen.Pyramid-based texture analysis/synthesis.In Proceedings ofSIGGRAPH’95,pages229–238,1995.[6]M.I.Jordan and R.A.Jacobs.Hierarchical mixtures of experts and the EM algorithm.NeuralComputation,6:181–214,1994.[7]S.Konishi,A.L.Yuille,J.Coughlan,and S.C.Zhu.Fundamental bounds on edge detection:an information theoretic evaluation of different edge cues.Proc.IEEE put.Vision and Pattern Recognition,pages573–579,1999.[8]J.Malik,S.Belongie,T.Leung,and J.Shi.Contour and texture analysis for image segmenta-tion.Int’l.Journal of Computer Vision,43(1):7–27,June2001.[9]J.Malik and P.Perona.Preattentive texture discrimination with early vision mechanisms.J.Optical Society of America,7(2):923–32,May1990.[10] D.Martin,C.Fowlkes,D.Tal,and J.Malik.A database of human segmented natural imagesand its application to evaluating segmentation algorithms and measuring ecological statistics.In Proc.8th Int’puter Vision,volume2,pages416–423,July2001.[11]M.Meil˘a and J.Shi.Learning segmentation by random walks.In NIPS,2001.[12]M.C.Morrone and D.C.Burr.Feature detection in human vision:a phase dependent energymodel.Proc.R.Soc.Lond.B,235:221–45,1988.[13]M.Nitzberg,D.Mumford,and T.Shiota.Filtering,Segmentation and Depth.Springer-Verlag,1993.[14]P.Perona and J.Malik.Detecting and localizing edges composed of steps,peaks and roofs.Inputer Vision,pages52–7,Osaka,Japan,Dec1990.[15]J.Puzicha,T.Hofmann,and J.Buhmann.Non-parametric similarity measures for unsupervisedtexture segmentation and image retrieval.In Computer Vision and Pattern Recognition,1997.[16]X.Ren and J.Malik.A probabilistic multi-scale model for contour completion based on imagestatistics.Proc.7th put.Vision,2002.[17] C.Van rmation Retrieval,2nd ed.Dept.of Comp.Sci.,Univ.of Glasgow,1979.[18]J.Rivest and P.Cavanagh.Localizing contours defined by more than one attribute.VisionResearch,36(1):53–66,1996.[19]Y.Rubner and C.Tomasi.Coalescing texture descriptors.ARPA Image Understanding Work-shop,1996.[20]R.E.Schapire and Y.Singer.Improved boosting algorithms using confidence-rated predictions.Machine Learning,37(3):297–336,1999.[21]Z.Tu,S.Zhu,and H.Shum.Image segmentation by data driven markov chain monte carlo.InProc.8th Int’puter Vision,volume2,pages131–138,July2001.[22]L.R.Williams and D.W.Jacobs.Stochastic completionfields:a neural model of illusory contourshape and salience.In Proc.5th puter Vision,pages408–15,June1995.。
基于轮廓波维纳滤波的图像压缩传感重构.
第30卷第10期仪器仪表学报V ol.30 No. 10 2009年10月Chinese Journal of Scientific Instrument Oct. 2009 基于轮廓波维纳滤波的图像压缩传感重构*李林,孔令富,练秋生(燕山大学信息科学与工程学院秦皇岛066004)摘要:图像压缩传感重构利用自然图像可稀疏表示的先验知识,从比奈奎斯特采样率低得多的随机投影观测值中重构原始图像。
为了克服传统的压缩传感重构中正交小波方向选择性差和未利用变换系数的邻域统计特性的缺点,利用了轮廓波维纳滤波去噪算子替代迭代阈值法中的阈值算子,进而提出了基于轮廓波维纳滤波的图像压缩传感的重构算法。
实验结果表明,该算法提高了重构图像的峰值信噪比和视觉效果,保护了图像的细节,加快了重构算法的收敛速度。
关键词:压缩传感;轮廓波;迭代维纳滤波;邻域系数中图分类号:TP391文献标识码:A国家标准学科分类代码:510.4050Image compressed sensing reconstruction based on contourlet Wiener filteringLi Lin, Kong Lingfu, Lian Qiusheng(Institute of Information Science and Technology,Yanshan University, Qinhuangdao 066004, China)Abstract:Image compressed sensing reconstruction uses the sparse prior of the natural image and can reconstruct the original image from far fewer measurements of random projection than Nyquist sampling rate. To overcome the poor directional selectivity of orthogonal wavelet bases and not exploiting the statistic characteristics of trans-form coefficients in neighborhood, the contourlet Wiener filtering denoising operator is used to replace the thresh-old operator in iterative thresholding algorithm. And then a reconstruction algorithm is proposed, which combines contourlet with Wiener filtering. Experiment results show that the proposed algorithm improves the peak sig-nal-to-noise ratio and visual quality, protects image details, and accelerates the convergence of reconstruction al-gorithm.Key words:compressed sensing; contourlet; iterative Wiener filtering; neighborhood coefficient1引言随着科技进步,信号带宽越来越宽,并在某些场合是不可知的,传统的香农抽样定理在应用中受到了挑战。
基于邻域相似性的暗原色先验图像去雾方法

2 1 年 5月 01
计 算 机 应 用
J un lo o ue piain o ra fC mp trAp l t s c o
V 13 . o . 1 No 5 Ma 0 1 y2 1
文 章 编 号 :0 1— 0 1 2 1 )5— 12 0 10 98 (0 10 0 24— 3
m d 1 h xei e t sl h w ta tem to a aptee g d i po e h a t o ed g d d i ae oe .T eep r n r ut so t h e dcn s r dea rv eq l y f e a e g . m a e s l h h h h n m t u i t h r m
G i UO Ja ,W ANG Xio tn HU C e g p n a . g一, o h n 。 e g ,XU Xio g n a .a g
( .Istt o ht l tcTcnl y ainN vl cdm ,D l nLa n g16 1 ,C i ; 1 ntu i e fP o e c i e o g ,D l aa ae y ai ioi 10 8 hn oer h o a A a n a
-
2 eat et ai t n ai aa Aa m ,D l nLann 10 8 hn ; .Dp r n o N v ai ,D l nN vl cd y ai ioi 16 1,C i m f g o a e a g a 3 ea metfE @ ̄ n uo ai t n ai aa Aa e y .Dp r n q m t A tm tai ,D l nN vl cdm ,Dai ioi 10 8 hn) t o e zo a lnLann 16 1,C i a g a
(光电信息工程专业英语)专业英语第七讲Geometrical Optics

牛顿1672年使用的6英寸反射式望远镜复制品,为皇 家学会所拥有。
1994年,不列颠哥伦比亚大学开始建造一台 口径为6米的旋转水银面望远镜——大型天 顶望远镜(LZT),并于2003年建成
1.9 Lens Aberrations
9. By choosing materials with indices of refraction that depend in different ways on the color of the light, lens designers can ensure that positive and negative lens elements compensate for each other by having equal but opposite chromatic effects.
1.9 Lens Aberrations
4. Up to now, our discussion of lenses has not taken into account some of the optical imperfections that are inherent in single lenses made of uniform material with spherical surfaces. These failures of a lens to give a perfect image are known as aberrations. 句子结构: our discussion … has not taken into account … imperfections…
vt.提供;给予(provide的过去式)
参考翻译:
在上述的推导中,我们检验了物在会聚透镜焦点以外的特殊情况。 然而,如果遵守下述的符号规则,薄透镜公式对于会聚和发散薄透镜都是 有效的,且不论物体远近。
超像素分割算法研究综述

超像素分割算法研究综述超像素分割是计算机视觉领域的一个重要研究方向,它的目标是将图像分割成一组紧密连接的区域,每个区域都具有相似的颜色和纹理特征。
超像素分割可以在许多计算机视觉任务中发挥重要作用,如图像分割、目标检测和图像语义分割等。
本综述将介绍一些常见的超像素分割算法及其应用。
1. SLIC (Simple Linear Iterative Clustering):SLIC是一种基于k-means聚类的超像素分割算法。
它首先在图像中均匀采样一组初始超像素中心,并通过迭代的方式将每个像素分配给最近的超像素中心。
SLIC算法结合了颜色和空间信息,具有简单高效的特点,适用于实时应用。
2.QuickShift:QuickShift是一种基于密度峰值的超像素分割算法。
它通过利用图片的颜色相似性和空间相似性来计算每个像素的相似度,并通过移动像素之间的边界来形成超像素。
QuickShift算法不依赖于预定义的超像素数量,适用于不同大小和形状的图像。
3. CPMC (Constrained Parametric Min-Cuts):CPMC是一种基于图割的超像素分割算法。
该算法通过求解最小割问题来获得具有边界连通性的超像素分割结果。
CPMC算法能够生成形状规则的超像素,适用于对形状准确性要求较高的应用。
4. LSC (Linear Spectral Clustering):LSC是一种基于线性谱聚类的超像素分割算法。
它通过构建图像的颜色和空间邻接图,并对其进行谱分解来获取超像素分割结果。
LSC算法具有良好的分割结果和计算效率,适用于大规模图像数据的处理。
5. SEEDS (Superpixels Extracted via Energy-Driven Sampling):SEEDS是一种基于随机采样的超像素分割算法。
它通过迭代的方式将像素相似度转化为能量函数,并通过最小化能量函数来生成超像素。
SEEDS算法能够快速生成具有边界连通性的超像素,并适用于实时应用。
基于L-BFGS-B局部极小化的自适应尺度CLEAN算法

第38卷第1期2021年1月Vol, 33 No. 1Ju. 0021贵州大学学报(自然科学版)Journai of Guizhou UniversiW ( Naturai Sciecces)文章编号 10002269(2021)012038 27 DOI :10.15759/(. chdi. adxPzrb. 0021.01.06基于L-BFGS-B 局部极小化的 自适应尺度CLEAN 算法张 利**6,肖一凡6米立功6卢 梅6赵庆超6王 b 1,刘 祥4,张 明4,谢 泉1 (6贵州大学大数据与信息工程学院,贵州贵阳550028 ;2,中国科学院新疆天文台,新疆乌鲁木齐830011)收稿日期:202021-23基金项目:平方公里阵列射电望远镜专项资助项目(2020SKA0n0300);国家重点研发计划资助项目(2418YFA0404242);国家自然科学基金资助项目(11663403);贵州省教育厅青年科技人才成长资助项目(黔教合KY 字[2018 ] 119)作者简介:张利(1987—),男,特聘教授,博士,研究方向:天文大数据、医疗大数据、图像处理,E-mi :/zhang. scmoce@OmaW com.* 通讯作者:张 利,E-maii : /zhang. science@ gmaii. com.摘 要:干涉阵列存在的i 扩展函数旁瓣使得观测到的射电源出现不同程度的失真,对重建宇宙真实结构图景和理解宇宙起源造成影响。
为解决观测中出现的伪影,本文在现有的CLEAN 算法的基础上,提出了基于L-2FGS-2局部极小化的自适应尺度CLEAN 算法。
首先,基于L 西FGS- B 局部极小化算法通过最小化目标函数,寻找最优分量,构建自适应尺度模型;其次,通过CASA实现对测试图像的重建,对比目前广泛使用的HBgdom CLEAN 算法的重建图像,评估本文算法性能;最后,对反卷积算法在射电天文图像处理领域的发展做出展望。
细胞超分辨成像技术的最新进展

细胞超分辨成像技术的最新进展细胞是构成生物体的基本单位,其内部结构鲜有人能够观测到。
传统的光学显微镜像素级别的分辨率限制了观察细胞内部微观结构的深度。
探测到分子级别的微观细节对理解细胞的生理和疾病过程至关重要,而超分辨成像技术为解决这个问题提供了切实可行的方法。
传统的液体显微镜的行程始于 1889 年,当时德国物理学家夫琅和费发展了同步位移的干涉显微术。
20世纪60年代,Minsky提出了激光点扫描显微镜(LSM)的方法。
这种方法采用荧光标记的生物样品,LED或激光扫描围绕着一个样品的轨迹,由发射到检测器的光产生的图像,从而得到一个三维点扫描图像的序列。
然而,这种方法的分辨率仍远远不能突破经典阿贝分辨率极限。
在过去的二十年中,超分辨成像技术已经得到了相当大的进步,并广泛应用于各个学科领域。
总体上,超分辨成像技术的原理有两种:超分辨现场(SIM)和刺激发射衰减(STED)显微镜。
超分辨现场显微镜利用多种景深渐变技术,超分辨现场显微镜将景深分为称为“焦点”的多个体积,继而用多个重叠图像来重建最终超分辨率图像。
而 STED 利用激光点阵、相位板和偏振调节器,通过对较小的局部区域进行刺激发射衰减,根据表面下的荧光谐振能量传递强点测量荧光,得到超分辨率成像的效果。
值得一提的是,STED 显微镜技术实现的分辨率甚至可以小于10纳米。
近年来,一种被称为单分子定位瞬态成像(PALM) 的超分辨率显微镜也引起了广泛关注。
此技术基于光刻制造微型结构,通过控制荧光标识剂的激发,进而控制陆续点亮像素的显示。
然后,通过这些对局部成像进行重复图像叠加的方式,显微镜利用那些位置信息不断瞬移的单个分子的图像信息获得更高的空间分辨率。
据报道,使用 PALM 测量的细胞器内蛋白质的可视化最高分辨率可以达到10%。
超分辨成像技术促进了生命科学研究领域的多个方面,包括细胞吞噬,肿瘤学,神经科学等。
它使研究者们能够观察和分析某些非常微小的细胞结构以及计量分子分布。
达到光学分辨率极限的“最清晰”图像问世

达到光学分辨率极限的“最清晰”图像问世
佚名
【期刊名称】《创新时代》
【年(卷),期】2012(000)009
【摘要】英国《自然·纳米技术》杂志8月12日在线刊登报告说,新加坡研究人员完成了一幅常用作图像测试的彩色女子头像“莱娜”,整幅头像大小只有50微米见方,它的清晰程度可达到光学分辨率的理论极限,即化每250纳米距离上安放一个像素点。
【总页数】1页(P15-15)
【正文语种】中文
【中图分类】TP334.22
【相关文献】
1.雾天车辆超分辨率视频图像清晰度识别仿真 [J], 汤嘉立;杜卓明
2.基于块旋转和清晰度的图像超分辨率重建算法 [J], 尧潞阳;解凯;李桐
3.达光学分辨率极限“最清晰”图像问世 [J], W.KJ
4.每250nm距离安放一个像素点达光学分辨力极限的“最清晰”图像问世 [J],
5.达到理论极限的带光学读出的非致冷焦平面列阵 [J], 高国龙
因版权原因,仅展示原文概要,查看原文内容请购买。
- 1、下载文档前请自行甄别文档内容的完整性,平台不提供额外的编辑、内容补充、找答案等附加服务。
- 2、"仅部分预览"的文档,不可在线预览部分如存在完整性等问题,可反馈申请退款(可完整预览的文档不适用该条件!)。
- 3、如文档侵犯您的权益,请联系客服反馈,我们会尽快为您处理(人工客服工作时间:9:00-18:30)。
Printed 2 February 2008
A (MN L TEX style file v2.2)
Lens binarity vs limb darkening in close-impact galactic microlensing events
where source and lens are separated by the angle u θE and θE = 4GM DS − DL c2 DS DL (2)
denotes the angular Einstein radius.
2
M. Dominik
impact parameter falls below the angular source radius, i.e. u0 < ρ⋆ (Bogdanov & Cherepashchuk 1996; Gould & Welch 1996; Gaudi & Gould 1999; Heyrovsk´ y et al. 2000; Heyrovsk´ y 2003), and passages of the source star over a (line-shaped) fold caustic created by a binary lens (Schneider & Weiß 1987; Schneider & Wagoner 1987; Gaudi & Gould 1999; Rhie & Bennett 1999; Dominik 2004a,c). In addition, the source might pass directly over a cusp, as for the event MACHO 1997-BLG-28 (Albrow et al. 1999b), for which the first limb-darkening measurement by microlensing has been obtained. As anticipated by Gaudi & Gould (1999), the vast majority of other limb-darkening measurements so far has arisen from foldcaustic passages (Afonso et al. 2000; Albrow et al. 2000, 2001; Fields et al. 2003), whereas two measurements from single-lens events have been reported so far (Alcock et al. 1997; Yoo et al. 2004). The remaining limb-darkening measurement by microlensing, on the solar-like star MOA 2002-BLG-33 Abe et al. (2003) constituted a very special case, where the source simultaneously enclosed several cusps over the course of its passage.
cussed. Sect. 2 discusses the basics of close-impact microlensing events with the effect of source size, the potential of measuring stellar proper motion and limb darkening, and the effect of lens binarity. Sect. 3 shows the influence of lens binarity on the extraction of information from such events. First, the effect of lens binarity on the light curves is demonstrated by means of two illustrative examples involving K and M Bulge giants. Subsequently, a simulation of data corresponding to these configurations is used to investigate the potential misestimates of parameters if lens binarity is neglected. Sect. 4 presents the final conclusions and a summary of the results.
ABSTRACT
Although point caustics harbour a larger potential for measuring the brightness profile of stars during the course of a microlensing event than (line-shaped) fold caustics, the effect of lens binarity significantly limits the achievable accuracy. Therefore, corresponding close-impact events make a less favourable case for limb-darkening measurements than those events that involve fold-caustic passages, from which precision measurements can easily and routinely be obtained. Examples involving later Bulge giants indicate that a ∼ 10 % misestimate on the limb-darkening coefficient can result with the assumption of a single-lens model that looks acceptable, unless the precision of the photometric measurements is pushed below the 1 %level even for these favourable targets. In contrast, measurement uncertainties on the proper motion between lens and source are dominated by the assessment of the angular radius of the source star and remain practically unaffected by lens binarity. Rather than judging the goodness-of-fit by means of a χ2 test only, run tests provide useful additional information that can lead to the rejection of models and the detection of lens binarity in close-impact microlensing events. Key words: gravitational lensing – stars: atmospheres.
1 INTRODUCTION In order to resolve the surface of the observed star during a microlensing event, the magnification pattern created by the lens needs to supply a large magnification gradient. Two such configurations meeting this requirement have been discussed extensively in the literature: a pointcaustic at the angular position of a single point-like lens (Witt & Mao 1994; Nemiroff & Wickramasinghe 1994; Gould 1994; Bogdanov & Cherepashchuk 1995, 1996; Witt 1995; Gould & Welch 1996; Gaudi & Gould 1999; Heyrovsk´ y et al. 2000; Heyrovsk´ y 2003) and a line-shaped fold caustic produced by a binary lens (Schneider & Weiß 1987; Schneider & Wagoner 1987; Gaudi & Gould 1999; Rhie & Bennett 1999; Dominik 2004a,b,c). It has been pointed out by Gaudi & Gould (1999) that fold-caustic events are more common and their observation is easier to plan, whereas close-impact events where the source transits a point caustic can provide more information. However, I will argue that this apparent gain of information can usually not be realized due to potential lens binarity. In contrast to fold caustics which form a generically stable singularity, point caustics are not stable and do not exist in reality. Instead, there is always a small diamond-shaped caustic containing four cusps. In this paper, the influence of lens binarity on the measurement of stellar limb-darkening coefficients and proper motion is investigated and the arising limitations of the power of close-impact events where the source passes over a single closed caustic are dis-