国际贸易(第10版)
克鲁格曼 国际经济学第10版 英文答案 国际贸易部分krugman_intlecon10_im_06_GE

Chapter 6The Standard Trade Model⏹Chapter OrganizationA Standard Model of a Trading EconomyProduction Possibilities and Relative SupplyRelative Prices and DemandThe Welfare Effect of Changes in the Terms of TradeDetermining Relative PricesEconomic Growth: A Shift of the RS CurveGrowth and the Production Possibility FrontierWorld Relative Supply and the Terms of TradeInternational Effects of GrowthCase Study: Has the Growth of Newly Industrializing Countries Hurt Advanced Nations?Tariffs and Export Subsidies: Simultaneous Shifts in RS and RDRelative Demand and Supply Effects of a TariffEffects of an Export SubsidyImplications of Terms of Trade Effects: Who Gains and Who Loses?International Borrowing and LendingIntertemporal Production Possibilities and TradeThe Real Interest RateIntertemporal Comparative AdvantageSummaryAPPENDIX TO CHAPTER 6: More on Intertemporal Trade⏹Chapter OverviewPrevious chapters have highlighted specific sources of comparative advantage that give rise to international trade. This chapter presents a general model that admits previous models as special cases. This “standard trade model” is the workhorse of international trade theory and can be used to address a wide range of issues. Some of these issues, such as the welfare and distributional effects of economic growth, transfers between nations, and tariffs and subsidies on traded goods, are considered in this chapter.© 2015 Pearson Education LimitedThe standard trade model is based upon four relationships. First, an economy will produce at the point where the production possibilities curve is tangent to the relative price line (called the isovalue line). Second, indifference curves describe the tastes of an economy, and the consumption point for that economy is found at the tangency of the budget line and the highest indifference curve. These two relationships yield the familiar general equilibrium trade diagram for a small economy (one that takes as given the terms of trade), where the consumption point and production point are the tangencies of the isovalue line with the highest indifference curve and the production possibilities frontier, respectively.You may want to work with this standard diagram to demonstrate a number of basic points. First, an autarkic economy must produce what it consumes, which determines the equilibrium price ratio; and second, opening an economy to trade shifts the price ratio line and unambiguously increases welfare. Third, an improvement in the terms of trade (ratio of export prices to import prices) increases welfare in the economy. Fourth, it is straightforward to move from a small country analysis to a two-country analysis by introducing a structure of world relative demand and supply curves, which determine relative prices.These relationships can be used in conjunction with the Rybczynski and the Stolper-Samuelson theorems from the previous chapter to address a range of issues. For example, you can consider whether the dramatic economic growth of China has helped or hurt the United States as a whole and also identify the classes of individuals within the United States who have been hurt by China’s particular growth biases. In teaching these points, it might be interesting and useful to relate them to current events. For example, you can lead a class discussion on the implications for the United States of the provision of forms of technical and economic assistance to the emerging economies around the world or the ways in which a world recession can lead to a fall in demand for U.S. exports.The example provided in the text considers the popular arguments in the media that growth in China hurts the United States. The analysis presented in this chapter demonstrates that the bias of growth is important in determining welfare effects rather than the country in which growth occurs. The existence of biased growth and the possibility of immiserizing growth are discussed. The Relative Supply (RS) and Relative Demand (RD) curves illustrate the effect of biased growth on the terms of trade. The new termsof trade line can be used with the general equilibrium analysis to find the welfare effects of growth. A general principle that emerges is that a country that experiences export-biased growth will have a deterioration in its terms of trade, while a country that experiences import-biased growth has an improvement in its terms of trade. A case study argues that this is really an empirical question, and the evidence suggests that the rapid growth of countries like China has not led to a significant deterioration of the U.S. terms of trade nor has it drastically improved China’s terms of trade.The second area to which the standard trade model is applied is the effects of tariffs and export subsidies on welfare and terms of trade. The analysis proceeds by recognizing that tariffs or subsidies shift both the relative supply and relative demand curves. A tariff on imports improves the terms of trade, expressed in external prices, while a subsidy on exports worsens terms of trade. The size of the effect depends upon the size of the country in the world. Tariffs and subsidies also impose distortionary costs upon the economy. Thus, if a country is large enough, there may be an optimum, nonzero tariff. Export subsidies, however, only impose costs upon an economy. Internationally, tariffs aid import-competing sectors and hurt export sectors, while subsidies have the opposite effect.The chapter then closes with a discussion of international borrowing and lending. The standard trade model is adapted to trade in consumption across time. The relative price of future consumption is defined as 1/(1 r), where r is the real interest rate. Countries with relatively high real interest rates (newly industrializing countries with high investment returns for example) will be biased toward future consumption and will effectively “export” future consumption by borrowing from established developed countries with relatively lower real interest rates.Chapter 6 The Standard Trade Model 29Answers to Textbook Problems1.If the relative price of palm oil increases in relation to the price of lubricants, this would increase theproduction of palm oil, because Indonesia exports palm oil. Similarly, an increase in relative price of lubricants leads to a shift along the indifference curve, towards lubricants and away from palm oil for Indonesia. This is because Palm oil is relatively expensive, hence reducing palm oil consumption in Indonesia.Expensive palm oil increases the relative income of Indonesia. The income effect would induce more for the consumption of palm oil whereas the substitution effect acts to make the economy consume less of palm oil and more of lubricants. However, if the income effect outweighs the substitution effect, then the consumption of palm oil would increase in Indonesia.2.In panel a, the re duction of Norway’s production possibilities away from fish cause the production of fish relative to automobiles to fall. Thus, despite the higher relative price of fish exports, Norway moves down to a lower indifference curve representing a drop in welfare.In panel b, the increase in the relative price of fish shifts causes Norway’s relative production of fish to rise (despite the reduction in fish productivity). Thus, the increase in the relative price of fish exports allows Norway to move to a higher indifference curve and higher welfare.3. The terms of trade of the home country would worsen. This is because a strong biased productiontowards cloth would increase the home country’s supply of cloth and shifts the supply curve to the right. At the same time, the production of wheat would decline relative to the production of cloth. An increased supply of cloth would reduce the price at the domestic and at the international market. The reduction in international price of cloth would worsen the terms of trade of the home country as the home country exports. On the other hand, if the home country’s production grows in favor of wheat, the terms of trade would improve in favor of the home country. This is because wheat is imported by the home country.© 2015 Pearson Education Limited。
Incoterms2010国际贸易术语

工厂交货 货交承运人 运费付至 运保费付至 指定终端交货 指定目的地交货 完税后交货
仅适用于水运类(Sea and Inland Waterway Transport Only) FAS FOB CFR CIF Free Alongside Ship Free On Board Cost and Freight Cost, Insurance and Freight 装运港船边交货 装运港船上交货 成本加运费 成本加运保费
Group F
Group C
装 运 合 同 到 货 合8 同
Group D Arrival
DAF DES DEQ DDU DDP
EXW
FCA CPT CIP
*FOB *CFR *FAS *CIF *DES *DEQ
DDU DDP
工厂 仓库 敞车
火车站 汽车站
机场
集装箱 码头 堆场 CY
码头
出口国 DAF 关境 关境
国际贸易术语(Trade Terms)
第一节 第二节 第三节 第四节 贸易术语概述 主要贸易术语 其他国际贸易术语 国际贸易术语的选用
1
本章学习目的:
了解并掌握国际贸易中现行的各种贸易术语及其相 关的国际贸易惯例; 了解并掌握《2000年国际贸易术语解释通则》中六 种主要贸易术语的含义并明确其交易双方的基本义 务及在术语使用时应注意的问题; 能够正确区分实际性交货和象征性交货的贸易术语; 学会在实务中正确选用这些术语。
进口国
出口国
进口国
9
Incoterms® 2010的结构
适用于任何运输方式类(Any Mode of Transport)
EXW FCA CPT CIP DAT DAP DDP
国际经济学第10版 PPT 第5章:要素禀赋

补充:伯尔蒂尔· 俄林(Bertil Ohlin) 戈特哈德· 贝蒂· 俄林,1899年4月出生于瑞 典,1979年8月逝世。 瑞典著名经济学家,现代国际贸易理论的 创始人。 1977年,贝蒂尔· 俄林因对国际贸易理论和 国际资本运动理论做出了开拓性的研究, 与英国剑桥大学的詹姆斯· 爱德华· 米德一同 获得了当年的诺贝尔经济学奖。
用第二种方法时,如果国家2的资本租用价 格和劳动时间价格的比率小于国家1的这个 比率,就可以说国家2是资本丰裕的。 一般来说,资本的租用价格就是利率(r), 而劳动时间价格就是工资率(w)。 同样,这里也要看比值的大小,而不是绝 对水平。 这两种定义方法之间的关系是很明确的。 用实物单位定义仅仅考虑了供给方面的因 素,而用相对要素价格定义
国家1的生产可能性曲线偏向度量X的横轴。 同样,由于国家2是资本丰裕的国家,而且 Y是资本密集型的商品,国家2的生产可能 性曲线偏向于度量Y的纵轴。
图5.2 两国生产可能性曲线的形状
Y 140ຫໍສະໝຸດ 国家270 国家1
0
20
40
60
80
100 120 140 X
表5.1 各国资源禀赋的占有率(2006年,%)
在图中,两国表示Y的射线要比表示X的射 线更陡峭(斜率更大)。 为什么国家2在生产两种商品时都使用了比 国家1资本密集程度更高的生产技术呢? 答案是,国家2的资本相对于国家1来说比 较便宜,国家2的生产者为了减少生产成本 而增加了资本的使用。 那么为什么国家2的资本相对便宜呢? 要回答这个问题,就必须给出要素丰裕度 的定义,并研究其与要素价格之间的关系。
其次,为了分析国际贸易对贸易双方生产 要素收入的影响将要扩展模型。 也就是说,要考察国际贸易对劳动收入和 国际收入差异的影响。 这两个重要的问题是由大卫· 李嘉图和穆勒 (Mill)提出的,但他们并没有解决这两 个问题。 古典经济学家认为,比较优势的产生是由 于各国劳动生产率存在差异,但他们并没 有解释产生这种差异的原因。
2010新版国际贸易术语解释通则(中英文版)
国际贸易术语解释通则(2010)目录前言. 1EXW——工厂交货(……指定地点). 5FCA——货交承运人(……指定地点). 7CPT——运费付至(……指定目的港). 10CIP——运费和保险费付至(……指定目的地)13DAT——终点站交货(……指定目的港或目的地)16DAP——目的地交货(……指定目的地). 18DDP——完税后交货(……指定目的地). 20FAS——船边交货(……指定装运港). 22FOB——船上交货(……指定装运港). 24CFR——成本加运费付至(……指定目的港)27CIF——成本,保险加运费付至(……指定目的港)30国际贸易术语解释通则2010全球化经济赋予商业以空前宽广途径通往世界各地市场。
货物得以在更多的国家、大量且种类愈繁地销售。
然而随着全球贸易数额的增加与贸易复杂性的提升,因销售合同不恰当起草引致误解与高代价争端可能性也提高了。
国际贸易术语解释通则这一用于国内与国际贸易事项的国际商会规则使得全球贸易行为更便捷。
在销售合同中参引国际贸易术语解释通则2010可清晰界定各方义务并降低法律纠纷的风险。
自1936年国际商会创制国际贸易术语以来,这项在全球范围内普遍被接受的合同标准经常更新,以保持与国际贸易发展步调一致。
国际贸易术语解释通则2010版考虑到了全球范围内免税区的扩展,商业交往中电子通讯运用的增多,货物运输中安保问题关注度的提高以及运输实践中的许多变化。
国际贸易术语解释通则2010更新并加强了“交货规则”——规则的总数从13降到11,并为每一规则提供了更为简洁和清晰的解释。
国际贸易术语解释通则2010同时也是第一部使得所有解释对买方与卖方呈现中立的贸易解释版本。
国际商会商法和实践委员会成员来自世界各地和所有贸易领域,该委员会宽泛的专业技能确保了国际贸易术语解释通则2010与各地的商贸需要照应。
国际商会向Fabio Bortolotti(意大利)的商法和实践委员会的成员表示谢意,向由Charles Debattista(副组长,英国),Christoph Martin Radtke (副组长,法国),Jens Bredow (德国),Johnny Herre (瑞典),David Lwee(英国),Lauri Railas (芬兰),Frank Reynold(美国),Miroslav Subert (捷克)组成的起草小组致谢,并且向对11条规则的表述给予帮助的Asko Raty (芬兰)致谢。
国际贸易(第10版)

8
9 10
2013-7-25
Italy
Canada Belgium
410.6
389.5 369.2
3.4
3.2 3.1
UK
Belgium Canada
437.8
430.8 419.0
3.1
3.1 3.0
7
Table:Leading Exporter in World Merchandise Trade2008(bn USD,%)
2013-7-25 19
图:商品贸易、服务贸易与技术贸易
硬件技术设备贸易 商品贸易 安装、调试、培训,技术诀窍、 服务贸易 专利等软技术贸易
服务贸易
技术贸易
商品 贸易
技术贸易
2013-7-25 20
表:全球货物贸易中的两大复出口地(Bn USD)
国家/地区 年份 出口额 中国香港 2006 322.7 新加坡 2006 271.8 全球排名 12 14 其中复出口额 299.9 128.6
2
6
Table:Leading Exporter in World Merchandise Trade(bn USD,%)
2006 2007
Rank
1 2 3 4 5 6 7
Exporters
Germany US China Japan France Holland UK
Value
1112.0 1038.3 968.9 649.9 490.4 462.4 448.3
2013-7-25 18
国际服务贸易内涵
WTO将服务部门分为12大类160个项目: 1。商业服务 BUSINESS SERVICES 2。通信服务 COMMUNICATION SERVICES 3。建筑及有关工程服务 CONSTRUCTION AND RELATED ENGINEERING SERVICES 4。销售服务 DISTRIBUTION SERVICES 5。教育服务 EDUCATIONAL SERVICES 6。环境服务 ENVIRONMENTAL SERVICES 7。金融服务 FINANCIAL SERVICES 8。健康与社会服务 HEALTH RELATED AND SOCIAL SERVICES 9。与旅游有关的服务TOURISM AND TRAVEL RELATED SERVICES 10。娱乐、文化与体育服务RECREATIONAL, CULTURAL AND SPORTING SERVICES 11。运输服务 TRANSPORT SERVICES 12。别处未包含的服务 OTHER SERVICES NOT INCLUDED ELSEWHERE
(完整版)克鲁格曼国际经济学第十版重点笔记
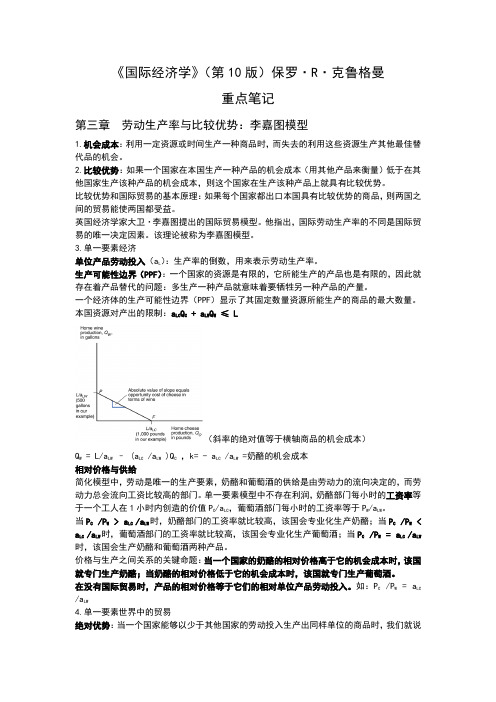
《国际经济学》(第10版)保罗·R·克鲁格曼重点笔记第三章劳动生产率与比较优势:李嘉图模型1.机会成本:利用一定资源或时间生产一种商品时,而失去的利用这些资源生产其他最佳替代品的机会。
2.比较优势:如果一个国家在本国生产一种产品的机会成本(用其他产品来衡量)低于在其他国家生产该种产品的机会成本,则这个国家在生产该种产品上就具有比较优势。
比较优势和国际贸易的基本原理:如果每个国家都出口本国具有比较优势的商品,则两国之间的贸易能使两国都受益。
英国经济学家大卫·李嘉图提出的国际贸易模型。
他指出,国际劳动生产率的不同是国际贸易的唯一决定因素。
该理论被称为李嘉图模型。
3.单一要素经济单位产品劳动投入(a L):生产率的倒数,用来表示劳动生产率。
生产可能性边界(PPF):一个国家的资源是有限的,它所能生产的产品也是有限的,因此就存在着产品替代的问题:多生产一种产品就意味着要牺牲另一种产品的产量。
一个经济体的生产可能性边界(PPF)显示了其固定数量资源所能生产的商品的最大数量。
本国资源对产出的限制:a LC Q C + a LW Q W≤ L(斜率的绝对值等于横轴商品的机会成本)Q W = L/a LW– (a LC /a LW )Q C,k= - a LC /a LW =奶酪的机会成本相对价格与供给简化模型中,劳动是唯一的生产要素,奶酪和葡萄酒的供给是由劳动力的流向决定的,而劳动力总会流向工资比较高的部门。
单一要素模型中不存在利润,奶酪部门每小时的工资率等于一个工人在1小时内创造的价值P C/a LC,葡萄酒部门每小时的工资率等于P W/a LW。
当P C /P W > a LC /a LW时,奶酪部门的工资率就比较高,该国会专业化生产奶酪;当P C /P W < a LC /a LW时,葡萄酒部门的工资率就比较高,该国会专业化生产葡萄酒;当P C /P W = a LC /a LW 时,该国会生产奶酪和葡萄酒两种产品。
国际经济学第10版 第8章贸易壁垒关税

在右图中,由于关税带来的租金或生产者 剩余的增加表示为AGJC=15。
原因是,由于自由贸易时Px=1,国内生产 者生产10X,获得收入OACV=10,征收关 税后Px=2,他们生产20X,获得收入 OGJU=40。
尽管贸易壁垒从国家福利的角度总是被认 为是合理的,但在现实生活中通常只有那 些受益于贸易壁垒的一些特殊利益集团才 会极力赞成它们。
历史上最重要的一类贸易壁垒是关税 (tariff)。
关税是对通过一国国境的贸易商品征收的 税收。
进口关税是对进口商品课征的税收;
出口关税是对出口商品征收的税收。
国际经济学
第8章贸易壁垒:关税
学习目的
描述关税对消费者和生产者的影响 识别关税对小国及大国的成本和收益 描述最优关税和报复关税 理解关税结构的含义和重要性
8.1 引言
虽然自由贸易可以使世界产出最大化并对 所有国家都有利,但是现实当中所有国家 都会给国际贸易的自由流动增设一些限制 条件。
较低的关税。
这样做的目的是为了鼓励国内生产和增加 就业。
例如,一国可能对进口羊毛免税但却对毛 料的进口征税,以刺激国内毛料的生产和 增加国内就业。
在这种情况下,有效保护率大于名义关税 率。
国内增加值等于最终商品价格减去为了生 产这种商品投入的进口生产要素的成本。
名义关税率对消费者来说很重要,而有效 保护率对生产者很重要,因为它表明了
日本
5.5 1.0 0.6 2.5 0.8 5.5 9.2 11.2 0.0 0.2 0.0 1.2 3.1
国际贸易课后答案版
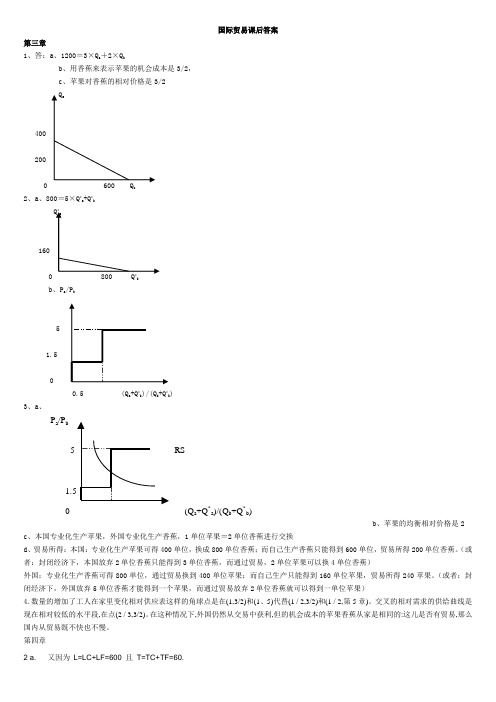
国际贸易课后答案第三章1、答:a、1200=3×Q a+2×Q bb、用香蕉来表示苹果的机会成本是3/2,c、苹果对香蕉的相对价格是3/2Q a4002000 600 Q b2、a、800=5×Q*a+Q*bQ*a1600 800 Q*bb、P a/P b51.50.5 (Q a+Q*b)/(Q b+Q*b)3、a、P a/P b5 RS1.50 (Q a+Q*a)/(Q b+Q*b)b、苹果的均衡相对价格是2c、本国专业化生产苹果,外国专业化生产香蕉,1单位苹果=2单位香蕉进行交换d、贸易所得:本国:专业化生产苹果可得400单位,换成800单位香蕉;而自己生产香蕉只能得到600单位,贸易所得200单位香蕉。
(或者:封闭经济下,本国放弃2单位香蕉只能得到3单位香蕉,而通过贸易,2单位苹果可以换4单位香蕉)外国:专业化生产香蕉可得800单位,通过贸易换到400单位苹果;而自己生产只能得到160单位苹果,贸易所得240苹果。
(或者:封闭经济下,外国放弃5单位香蕉才能得到一个苹果,而通过贸易放弃2单位香蕉就可以得到一单位苹果)4.数量的增加了工人在家里变化相对供应表这样的角球点是在(1,3/2)和(1、5)代替(1 / 2,3/2)和(1 / 2,第5章)。
交叉的相对需求的供给曲线是现在相对较低的水平段,在点(2 / 3,3/2)。
在这种情况下,外国仍然从交易中获利,但的机会成本的苹果香蕉从家是相同的:这儿是否有贸易,那么国内从贸易既不快也不慢。
第四章2 a. 又因为L=LC+LF=600 且T=TC+TF=60.所以LC=400, TC=20, LF=200 and TF=40.b. 不会c.在生产要素价格不变的情况下,一些劳工将不会被使用,因此生产要素价格将会改变,或者会出现失业。
3.这个论点没有区分一国的绝对优势与相对优势。
根据要素禀赋理论,重点不是在于要素的绝对丰裕度而是其相对丰裕度。
- 1、下载文档前请自行甄别文档内容的完整性,平台不提供额外的编辑、内容补充、找答案等附加服务。
- 2、"仅部分预览"的文档,不可在线预览部分如存在完整性等问题,可反馈申请退款(可完整预览的文档不适用该条件!)。
- 3、如文档侵犯您的权益,请联系客服反馈,我们会尽快为您处理(人工客服工作时间:9:00-18:30)。
2013-7-25
5
表:中国货物贸易出口的全球地位变动
年份 1980 出口占全球比重(%) 0.91 位次 26
1985
1990 1995 2000 2005 2006 2007
1.42
1.79 2.96 3.92 7.3 8.0 8.7
17
15 11 7 3 3 2
2008
2013-7-25
8.9
6300
6500 8025 10980 12808 14838 17240
19.0
20.0 19.6 19.1 18.9 18.6 19.1
4
资料: 中国入世8年 (2001-2009)
加入世贸组织8年来,中国经济取得了举世瞩目 的成就,国民生产总值由1.3万亿美元上升到 4.9万亿美元,全球排名跃居第3;进出口贸 易总额由0.5万亿美元上升到2.5万亿美元 (2008)、2.2万亿(2009),成为世界第2 贸易大国;外资实际流入年均达550亿美元, 继续保持发展中国家引资大国的地位。
2013-7-25 18
国际服务贸易内涵
WTO将服务部门分为12大类160个项目: 1。商业服务 BUSINESS SERVICES 2。通信服务 COMMUNICATION SERVICES 3。建筑及有关工程服务 CONSTRUCTION AND RELATED ENGINEERING SERVICES 4。销售服务 DISTRIBUTION SERVICES 5。教育服务 EDUCATIONAL SERVICES 6。环境服务 ENVIRONMENTAL SERVICES 7。金融服务 FINANCIAL SERVICES 8。健康与社会服务 HEALTH RELATED AND SOCIAL SERVICES 9。与旅游有关的服务TOURISM AND TRAVEL RELATED SERVICES 10。娱乐、文化与体育服务RECREATIONAL, CULTURAL AND SPORTING SERVICES 11。运输服务 TRANSPORT SERVICES 12。别处未包含的服务 OTHER SERVICES NOT INCLUDED ELSEWHERE
1994 1995
2880
4090 4920
625
1080 1170
3505
5170 6090
17.8
20.9 19.2
1996
1998 2002 2004 2005 2006 2007 2013-7-25
5100
5200 6455 8880 10393 12083 13950
1200
1300 1570 2100 2415 2755 3290
2013-7-25
2
Chapter 1 Introduction
0. Why should we learn such subjects as economics and international trade? ★ two important issues facing the international community ★ world economy becoming more integrated ★ China joining the world economy ★ economics and international trade relations as social sciences
share
9.2 8.6 8.0 5.4 4.1 3.8 3.7
Exporters
Germany China US Japan France Holland Italy
Value
1326.4 1217.8 1162.5 712.8 553.4 551.3 491.5
share
9.5 8.7 8.3 5.1 4.0 4.0 3.5
International Trade: Theories and Applications
Zhang Bin Department of Economics School of Business & Management Donghua University
2013-7-25
1
Reference Books and Magazines
2013-7-25
3
表 世界货物及服务贸易增长统计(十亿美元)
货物贸易a 1970 1975 1980 1983 283 798 1856 1508 服务贸易b 66 156 353 333 国际贸易c 349 954 2218 1841 b/c (%) 18.9 16.4 15.9 18.1
1988
2006
台湾 日本
2013-7-25
12
Chapter 1 Introduction
I. What is International Trade
1. Definition of international trade International trade is an exchange of commodities and services between different nations. It is the reflection of international division of labor ( or: international production specialization ).
2013-7-25
8
Figure: China’s GDP Growth 1980-2009
6000 5000 4000 3000 2000 1000 0
19 80 19 82 19 84 19 86 19 88 19 90 19 92 19 94 19 96 19 98 20 00 20 02 20 04 20 06 20 08 20 09
1. 各种题为《国际经济学》的书籍,其中本教材第8 版有中译本,机械工业出版社2006年1月 2. 各种题为《国际贸易》或《国际贸易教程》的书 籍,主要著者有: 薛荣久 (对外经济贸易大学,2006) 3. 期刊: 《国际贸易》,《国际贸易问题》,中国人民大学资 料中心复印资料《国际贸易》,《世界经济研究》
8
9 10
2013-7-25
Italy
Canada Belgium
410.6
389.5 369.2
3.4
3.2 3.1
UK
Belgium Canada
437.8
430.8 419.0
3.1
3.1 3.0
7
Table:Leading Exporter in World Merchandise Trade2008(bn USD,%)
2013-7-25 19
图:商品贸易、服务贸易与技术贸易
硬件技术设备贸易 商品贸易 安装、调试、培训,技术诀窍、 服务贸易 专利等软技术贸易
服务贸易
技术贸易
商品 贸易
技术贸易
2013-7-25 20
表:全球货物贸易中的两大复出口地(Bn USD)
国家/地区 年份 出口额 中国香港 2006 322.7 新加坡 2006 271.8 全球排名 12 14 其中复出口额 299.9 128.6
11
图:主要国家纺织服装出口规模变动(1980-2006)
十亿美元 150中国 意大利120德国 印度
90 60
土耳其 美国 法国 比利时
30
韩国 巴基斯坦
0
1980
1989
1990
1991
1992
1993
1994
1995
1996
1997
1998
1999
2000
2001
2002
2003
2004
2005
2
6
Table:Leading Exporter in World Merchandise Trade(bn USD,%)
2006 2007
Rank
1 2 3 4 5 6 7
Exporters
Germany US China Japan France Holland UK
Value
1112.0 1038.3 968.9 649.9 490.4 462.4 448.3
1994 1995
2880
4090 4920
625
1080 1170
3505
5170 6090
17.8
20.9 19.2
1996
1998 2002 2004 2005 2006 2007 2013-7-25
5100
5200 6455 8880 10393 12083 13950
1200
1300 1570 2100 2415 2755 3290
2013-7-25
GDP in Bn USD
9
Figure:China’s Foreign Trade
Bn USD
1600 1400 1200 1000 800 600 400 200 0
1980 1982 1984 1986 1988 1990 1992 1994 1996 1998 2000 2002 2004 2006 2008
2013-7-25
16
Chapter 1 Introduction
Microeconomics Economics
Macroeconomics
International Trade Relations International Economics International Monetary Relations
2013-7-25
15
Chapter 1 Introduction