商务与经济统计精要版答案
商务统计课后习题答案

Expected Price(Yi) 15 14 15 17 11 19 13 14 10 13 141
Totals
(Xi-X)2 Xi-X Yi-Y (Xi-X)(Yi-Y) -1.805 0.9 3.258025 -1.6245 2.195 -0.1 4.818025 -0.2195 0.011025 -0.105 0.9 -0.0945 3.783025 1.945 2.9 5.6405 -3.805 -3.1 14.47803 11.7955 6.795 4.9 46.172025 33.2955 -2.205 -1.1 4.862025 2.4255 -0.105 -0.1 0.011025 0.0105 -3.805 -4.1 14.478025 15.6005 0.895 -0.9 0.801025 -0.8055 92.67225 66.024
^
y = 0.275 + 0.95x
Texas Instruments has a higher risk. 53. a.
Satisfaction Rating(%) 100 80 60 Satisfaction Rating(%) 40 20 0 0 20 40 60 80
b. The relationship is positive. c. =43.92307692 y=65.92307692
b1=∑(Xi-X)(Yi-Y)/ ∑(Xi-X)2 =-170/1150 =-0.148 b0=y-b1 =17+.148*35=22.18
^
y=22.18-0.148x
b. SSR=25.1896 SSE=8.8696 MSR=SSR/Regression degrees of freedom=25.1896 MSE=SSE/n-2= 8.8696/4=2.2174 F=MSR/MSE=25.1896/2.2174=11.36 Fa=7.71<F
商务统计选择答案.doc

Part One: Multiple Choices:1.The probability that a continuous random variable takes any specific valuea.is equal to zerob.is at least 0.5c.depends on the probability density functiond.is very close to 1.02. A normal distribution with a mean of 0 and a standard deviation of 1 is calleda. a probability density functionb.an ordinary normal curvec. a standard normal distributiond.none of these alternatives is correct3. A negative value of Z indicates thata.the number of standard deviations of an observation is to the right of the meanb.the number of standard deviations of an observation is to the left of the meanc. a mistake has been made in computations, since Z cannot be negatived.the data has a negative mean4.For a continuous random variable x, the probability density function f(x) representsa.the probability at a given value of xb.the area under the curve at xc.the area under the curve to the right of xd.the height of the function at x5.For the standard normal probability distribution, the area to the left of the mean isa.-0.5b.0.5c.any value between 0 to 1d. 1rger values of the standard deviation result in a normal curve that isa.shifted to the rightb.shifted to the leftc.narrower and more peakedd.wider and flatter7. A continuous probability distribution that is useful in describing the time, or space,between occurrences of an event is a(n)a.normal probability distributionb.uniform probability distributionc.exponential probability distributiond.Poisson probability distribution8.Consider a binomial probability experiment with n = 3 and p = 0.1. Then, the probabilityof x = 0 isa.0.0000b.0.0001c.0.001d.0.7299. A continuous random variable may assumea.all values in an interval or collection of intervalsb.only integer values in an interval or collection of intervalsc.only fractional values in an interval or collection of intervalsd.all the positive integer values in an interval10.The highest point of a normal curve occurs ata.one standard deviation to the right of the meanb.two standard deviations to the right of the meanc.approximately three standard deviations to the right of the meand.the meanExhibit 1The assembly time for a product is uniformly distributed between 6 to 10 minutes.11.Refer to Exhibit 1. The probability density function has what value in the interval between 6 and 10?a.0.25b. 4.00c. 5.00d.zero12.Refer to Exhibit 1. The probability of assembling the product between 7 to 9 minutes isa.zerob.0.50c.0.20d. 113.Refer to Exhibit 1. The probability of assembling the product in less than 6 minutes isa.zerob.0.50c.0.15d. 114.Refer to Exhibit 1. The probability of assembling the product in 7 minutes or more isa.0.25b.0.75c.zerod. 115.Refer to Exhibit 1. The expected assembly time (in minutes) isa.16b. 2c.8d. 416.Refer to Exhibit 1. The standard deviation of assembly time (in minutes) is approximatelya. 1.3333b. 1.1547c.0.1111d.0.577317.Center of a normal curve isa.always equal to zerob.is the mean of the distributionc.cannot be negatived.is the standard deviation18.The uniform, normal, and exponential distributions area.all continuous probability distributionsb.all discrete probability distributionsc.can be either continuous or discrete, depending on the datad.all the same distributions19.Which of the following is not a characteristic of the normal probability distribution?a.The mean, median, and the mode are equalb.The mean of the distribution can be negative, zero, or positivec.The distribution is symmetricald.The standard deviation must be 120.In a standard normal distribution, the range of values of z is froma.minus infinity to infinityb.-1 to 1c.0 to 1d.-3.09 to 3.0921.Parameters area.numerical characteristics of a sampleb.numerical characteristics of a populationc.the averages taken from a sampled.numerical characteristics of either a sample or a population22.How many simple random samples of size 3 can be selected from a population of size 7?a.7b.21c.35d.34323. A population consists of 500 elements. We want to draw a simple random sample of 50 elements from this population. On the first selection, the probability of an element being selected isa.0.100b.0.010c.0.001d.0.00224.The closer the sample mean is to the population mean,a.the larger the sampling errorb.the smaller the sampling errorc.the sampling error equals 1d.None of these alternatives is correct.25.Since the sample size is always smaller than the size of the population, the sample meana.must always be smaller than the population meanb.must be larger than the population meanc.must be equal to the population meand.can be smaller, larger, or equal to the population mean26.As the sample size increases, thea.standard deviation of the population decreasesb.population mean increasesc.standard error of the mean decreasesd.standard error of the mean increases27. A simple random sample from an infinite population is a sample selected such thata.each element is selected independently and from the same populationb.each element has a 0.5 probability of being selectedc.each element has a probability of at least 0.5 of being selectedd.the probability of being selected changes28.In point estimationa.data from the population is used to estimate the population parameterb.data from the sample is used to estimate the population parameterc.data from the sample is used to estimate the sample statisticd.the mean of the population equals the mean of the sample29.The sample mean is the point estimator ofa.pib.Gc.xd.-P30.The expected value of the random variable x isa.the standard errorb.the sample sizec.the size of the populationd.None of these alternatives is correct.31.The standard deviation of all possible x values is called thea.standard error of proportionb.standard error of the meanc.mean deviationd.central variation32.Whenever the population has a normal probability distribution, the sampling distribution of x is a normal probability distribution fora.only large sample sizesb.only small sample sizesc.any sample sized.only samples of size thirty or greater33.The sampling error is thea.same as the standard error of the meanb.difference between the value of the sample mean and the value of the population meanc.error caused by selecting a bad sampled.standard deviation multiplied by the sample size34.Which of the following is(are) point estimator(s)?a. ab.p,c.sd.a35. A population characteristic, such as a population mean, is calleda. a statisticb. a parameterc. a sampled.the mean deviation36. A single numerical value used as an estimate of a population parameter is known asa. a parameterb. a population parameterc. a mean estimatord. a point estimate37.The purpose of statistical inference is to provide information about thea.sample based upon information contained in the populationb.population based upon information contained in the samplec.population based upon information contained in the populationd.mean of the sample based upon the mean of the population38.The number of random samples (without replacement) of size 3 that can be drawn from a population of size 5 isa.15b.10c.20d.12539.For a population with any distribution, the form of the sampling distribution of the sample mean isa.sometimes normal for all sample sizesb.sometimes normal for large sample sizesc.always normal for all sample sizesd.always normal for large sample sizes40. A simple random sample of 28 observations was taken from a large population. The sample mean equaled 50. Fifty is aa.population parameterb.biased estimate of the population meanc.sample parameterd.point estimate41.When s is used to estimate G, the margin of error is computed by usinga.normal distributionb.t distributionc.the mean of the sampled.the mean of the population42.From a population with a variance of 900, a sample of 225 items is selected. At 95% confidence, the margin of error isa.15b. 2c. 3.92d. 443.In order to determine an interval for the mean of a population with unknown standard deviation a sample of 61 items is selected. The mean of the sample is determined to be 23. The number of degrees of freedom for reading the t value isa.22b.23c.60d.6144.If we want to provide a 95% confidence interval for the mean of a population, the confidence coefficient isa.0.485b. 1.96c.0.95d. 1.64545.As the number of degrees of freedom for a t distribution increases, the difference between the t distribution and the standard normal distributiona.becomes largerb.becomes smallerc.stays the samed.None of these alternatives is correct.46.For the interval estimation of p, when o is known and the sample is large, the proper distribution to use isa.the normal distributionb.the t distribution with n degrees of freedomc.the t distribution with n + 1 degrees of freedomd.the t distribution with n + 2 degrees of freedom47.An estimate of a population parameter that provides an interval of values believed to contain the value of the parameter is known as thea.confidence levelb.interval estimatec.parameter valued.population estimate48.The value added and subtracted from a point estimate in order to develop an interval estimate of the population parameter is known as thea.confidence levelb.margin of errorc.parameter estimated.interval estimate49.If an interval estimate is said to be constructed at the 90% confidence level, the confidence coefficient would bea.0.1b.0.95c.0.9d.0.0550.Whenever the population standard deviation is unknown and the population has a normal or near-normal distribution, which distribution is used in developing an interval estimation?a.standard distributionb.z distributionc.alpha distributiond.t distribution51.In interval estimation, the t distribution is applicable only whena.the population has a mean of less than 30b.the sample standard deviation is used to estimate the population standard deviationc.the variance of the population is knownd.the standard deviation of the population is known52.In developing an interval estimate, if the population standard deviation is unknowna.it is impossible to develop an interval estimateb.the standard deviation is arrived at using the rangec.the sample standard deviation can be usedd.it is assumed that the population standard deviation is 153.In order to use the normal distribution for interval estimation of)i when cr is known and the sample is very small, the populationa.must be very largeb.must have a normal distributionc.can have any distributiond.must have a mean of at least 154.From a population that is not normally distributed and whose standard deviation is not known, a sample of 6 items is selected to develop an interval estimate for the mean of the population (y).a.The normal distribution can be used.b.The t distribution with 5 degrees of freedom must be used.c.The t distribution with 6 degrees of freedom must be used.d.The sample size must be increased.55.From a population that is normally distributed, a sample of 25 elements is selected and the standard deviation of the sample is computed. For the interval estimation of pi, the proper distribution to use is thea.normal distributionb.t distribution with 25 degrees of freedomc.t distribution with 26 degrees of freedomd.t distribution with 24 degrees of freedom56.As the sample size increases, the margin of errora.increasesb.decreasesc.stays the samed.increases or decreases depending on the size of the mean57. A 95% confidence interval for a population mean is determined to be 100 to 120. If the confidence coefficient is reduced to 0.90, the interval for(ia.becomes narrowerb.becomes widerc.does not changed.becomes 0.158.The ability of an interval estimate to contain the value of the population parameter is described by thea.confidence levelb.degrees of freedomc.precise value of the population mean p,d.degrees of freedom minus 159.An interval estimate is a range of values used to estimatea.the shape of the population's distributionb.the sampling distributionc. a sample statisticd. a population parameter60.In determining the sample size necessary to estimate a population proportion, which of the following information is not needed?a.the maximum margin of error that can be toleratedb.the confidence level requiredc. a preliminary estimate of the true population proportion Pd.the mean of the population61.What type of error occurs if you fail to reject H o when, in fact, it is not true?a.Type IIb.Type Ic.either Type I or Type II, depending on the level of significanced.either Type I or Type II, depending on whether the test is one tail or two tail62.An assumption made about the value of a population parameter is called aa.hypothesisb.conclusionc.confidenced.significance63.The probability of committing a Type I error when the null hypothesis is true isa.the confidence levelb.卩c.greater than 1d.the Level of Significance64.The p-value is a probability that measures the support (or lack of support) for thea.null hypothesisb.alternative hypothesisc.either the null or the alternative hypothesisd.sample statistic65.The p-valuea.is the same as the Z statisticb.measures the number of standard deviations from the meanc.is a distanced.is a probability66.In hypothesis testing if the null hypothesis is rejected,a.no conclusions can be drawn from the testb.the alternative hypothesis is truec.the data must have been accumulated incorrectlyd.the sample size has been too small67.The level of significance is thea.maximum allowable probability of Type II errorb.maximum allowable probability of Type I errorc.same as the confidence coefficientd.same as the p-value68. A Type II error is committed whena. a true alternative hypothesis is mistakenly rejectedb. a true null hypothesis is mistakenly rejectedc.the sample size has been too smalld.not enough information has been available69.The level of significancea.can be any positive valueb.can be any valuec.is (1 - confidence level)d.can be any value between -1.96 to 1.9670.When the following hypotheses are being tested at a level of significance of aH o: pi > 500H a: ]i < 500the null hypothesis will be rejected if the p-value isa.< aH a : ]i > 10.0%H a : |i > 10.0%H a : ]i < 10.0%d. Ho : pi > 10.0% H a : ]i < 10.0%a. Ho : pi < 85 H a : pi > 85b. Ho : pi < 85 H a : p, >c. Ho : pi > 85 H a : p, < 85d. Ho : pi > 85 H a : pi < 85 a. Ho :pi < 12 H a : pi < 12b. Ho : pi < 12 H a : p, >c. Ho: pi H 12H a : p, = 12b. > ac. > a/2d. < 1 - a/271. When the p-value is used for hypothesis testing, the null hypothesis is rejected if a. p-value < ab. a < p-valuec. p-value > ad. p-value = 1 - a72. In order to test the following hypotheses at an a level of significanceH o : pi < 800H a : ]i > 800the null hypothesis will be rejected if the test statistic Z isa. 巴 Z Qb. <Z ac. < -Z ad. = a73. Your investment executive claims that the average yearly rate of return on the stocks she recommends is more than 10.0%. You plan on taking a sample to test her claim. The correct setof hypotheses is a. H o : pi < 10.0% b. Ho : pi < 10.0%c. Ho : pi > 10.0%74. A weatherman stated that the average temperature during July in Chattanooga is less than 80 degrees. A sample of 32 Julys is taken. The correct set of hypotheses is a . H o : pi > 80 H a : p, <80 b . H o : pi < 80 H a : p, >80 c . H o : —80 H a : p, =80 d . H o : pi < 80 H a : p, >80 75. A student believes that the average grade on the final examination in statistics is at least85. She plans on taking a sample to test her belief. The correct set of hypotheses is76. A soft drink filling machine, when in perfect adjustment, fills the bottles with 12 ouncesof soft drink. Any over filling or under filling results in the shutdown and readjustment of the machine. To determine whether or not the machine is properly adjusted, the correct set ofhypotheses is d. Ho : p = 1277. A two-tailed test is performed at 95% confidence. The p-value is determined to be 0.09. The null hypothesisa.must be rejectedb.should not be rejectedc . could be rejected, depending on the sample sized . has been designed incorrectly7 8Exhibit 2n = 49 x = 54.8 s = 28 H o: pi < 50H a: p, > 50Refer to Exhibit 2. The test statistic isa . 0.1714b . 0.3849c . -1.2d . 1.27 9Refer to Exhibit 2. The p-value is betweena . 0.01 to 0.025b . 0.025 to 0.05c . .05 to 0.1d . 0.1 to 0.28 0Refer to Exhibit 2. If the test is done at the 5% level of significance, the null hypothesisshoulda . not be rejectedb . be rejectedc . Not enough information given to answer this question.d . None of these alternatives is correct.8 1If we are interested in testing whether themeanof population 1 is significantly largerthanthe mean of population 2, thea . null hypothesis should state 内-应 > 0b . null hypothesis should state 内-应巴0c . alternative hypothesis should state p,i - |i2 > 0d . alternative hypothesis should state pii -112 < 08 2If we are interested in testing whether themeanof population 1 is significantlydifferentfrom the mean of population 2, thea . null hypothesis should state 山-应=0b . null hypothesis should state 山-应巴0c . alternative hypothesis should state p,i - |i2 > 0d . alternative hypothesis should state pii -112 < 08 3When developing an interval estimate for the difference between two sample means, withsample sizes of m and n2,a . Ni must be equal to n2b . Ni must be smaller than n2c . Ni must be larger than n2d . Ni and n2 can be of different sizes,84.Independent simple random samples are taken to test the difference between the means of two populations whose variances are not known, but are assumed to be equal. The samplesizes are m = 32 and n2 = 40. The correct distribution to use is thea.t distribution with 73 degrees of freedomb.t distribution with 72 degrees of freedomc.t distribution with 71 degrees of freedomd.t distribution with 70 degrees of freedom85.If two independent large samples are taken from two populations, the sampling distribution of the difference between the two sample meansa.can be approximated by a Poisson distributionb.will have a variance of onec.can be approximated by a normal distributiond.will have a mean of one86.The standard error of x -x2 is thea.--variance of x 严Qb.--variance of the sampling distribution of 区厂乂?c.- ~standard deviation of the sampling distribution of x 严?d.difference between the two means87.In the analysis of variance procedure (ANOVA), ''factor'' refers toa.the dependent variableb.the independent variablec.different levels of a treatmentd.the critical value of F88.The ANOVA procedure is a statistical approach for determining whether or nota.the means of two samples are equalb.the means of two or more samples are equalc.the means of more than two samples are equald.the means of two or more populations are equal89.An experimental design where the experimental units are randomly assigned to the treatments is known asa.factor block designb.random factor designpletely randomized designd.None of these alternatives is correct.90.In an analysis of variance problem involving 3 treatments and 10 observations per treatment, SSE = 399.6. The MSE for this situation isa.133.2b.199.8c.14.8d.30.04 4 4 191.The F ratio in a completely randomized ANOVA is the ratio ofa.MSTR/MSEb.MST/MSEc.MSE/MSTRd.MSE/MST92.The critical F value with 6 numerator and 60 denominator degrees of freedom at a = .05 isa. 3.74b. 2.25c. 2.37d. 1.9693.An ANOVA procedure is applied to data obtained from 6 samples where each sample contains 20 observations. The degrees of freedom for the critical value of F area. 6 numerator and 20 denominator degrees of freedomb. 5 numerator and 20 denominator degrees of freedomc. 5 numerator and 114 denominator degrees of freedomd. 6 numerator and 20 denominator degrees of freedom94.In an analysis of variance problem if SST = 120 and SSTR = 80, then SSE isa.200b.40c.80d.12095.An ANOVA procedure is used for data that was obtained from four sample groups each comprised of five observations. The degrees of freedom for the critical value of F area. 3 and 20b. 3 and 16c. 4 and 17d. 3 and 1996.In ANOVA, which of the following is not affected by whether or not the population means are equal?a.xb.between-samples estimate of c>2c.within-samples estimate of c>2d.None of these alternatives is correct.97. A term that means the same as the term "variable" in an ANOVA procedure isa.factorb.treatmentc.replicationd.variance withinExhibit 3Salary information regarding male and female employees of a large company is shown below.Male FemaleSample Size 64 36Sample Mean Salary (in $1,000)Population Variance (cr2) 128 7298.Refer to Exhibit 3. The point estimate of the difference between the means of the two populations isa.-28b. 3c. 4d.-499.Refer to Exhibit 3. The standard error for the difference between the two means isa. 4b.7.46c. 4.24d. 2.0100.Refer to Exhibit 3. At 95% confidence, the margin of error isa. 1.96b. 1.645c. 3.920d. 2.000101.The coefficient of determinationa.cannot be negativeb.is the square root of the coefficient of correlationc.is the same as the coefficient of correlationd.can be negative or positive102.If the coefficient of determination is a positive value, then the coefficient of correlationa.must also be positiveb.must be zeroc.can be either negative or positived.must be larger than 1103.The mathematical equation relating the independent variable to the expected value of the dependent variable; that is, E(y) = P0 + 卩lx, is known asa.regression equationb.correlation equationc.estimated regression equationd.regression model104.The model developed from sample data that has the form of y = + ijX is known asa.regression equationb.correlation equationc.estimated regression equationd.regression model105.The interval estimate of the mean value of y for a given value of x isa.prediction interval estimateb.confidence interval estimatec.average regressiond.x versus y correlation interval106.The interval estimate of an individual value of y for a given value of x isa.prediction interval estimateb.confidence interval estimatec.average regressiond.x versus y correlation interval107.In a regression analysis the standard error is determined to be 4. In this situation the MSEa.is 2b.is 16c.depends on the sample sized.depends on the degrees of freedom108.In regression analysis, which of the following is not a required assumption about the error term £?a.The expected value of the error term is one.b.The variance of the error term is the same for all values of X.c.The values of the error term are independent.d.The error term is normally distributed.109.In a regression analysis, the coefficient of determination is 0.4225. The coefficient of correlation in this situation isa.0.65b.0.1785c.any positive valued.any value110.In a regression analysis, the coefficient of correlation is 0.16. The coefficient of determination in this situation isa.0.4000b.0.0256c. 4d. 2.56111.In a regression and correlation analysis if r2 = 1, thena.SSE must also be equal to oneb.SSE must be equal to zeroc.SSE can be any positive valued.SSE must be negative112.In a regression and correlation analysis if r2 = 1, thena.SSE = SSTb.SSE= 1c.SSR = SSEd.SSR = SST113.If the coefficient of correlation is a positive value, then the regression equationa.must have a positive slopeb.must have a negative slopec.could have either a positive or a negative sloped.must have a positive y intercept114.If the coefficient of correlation is 0.& the percentage of variation in the dependent variable explained by the variation in the independent variable isa.0.80%b.80%c.0.64%d.64%115.In regression and correlation analysis, if SSE and SST are known, then with this information thea.coefficient of determination can be computedb.slope of the line can be computedc.Y intercept can be computedd.x intercept can be computed116.In regression analysis, if the independent variable is measured in pounds, the dependent variablea.must also be in poundsb.must be in some unit of weightc.cannot be in poundsd.can be any units117.If the coefficient of correlation is -0.4, then the slope of the regression linea.must also be -0.4b.can be either negative or positivec.must be negatived.must be 0.16118.If the coefficient of correlation is a negative value, then the coefficient of determinationa.must also be negativeb.must be zeroc.can be either negative or positived.must be positive119.If a data set has SSR = 400 and SSE = 100, then the coefficient of determination isa.0.10b.0.25c.0.40d.0.80pared to the confidence interval estimate for a particular value of y (in a linear regression model), the interval estimate for an average value of y will bea.narrowerb.widerc.the samed.None of these alternatives is correct.。
商务经济统计试题及答案

商务经济统计试题及答案一、单项选择题1. 商务统计中,用于描述数据集中趋势的指标是:A. 方差B. 标准差C. 平均数D. 众数答案:C2. 在商务经济统计中,下列哪项不是统计量?A. 均值B. 标准差C. 样本容量D. 极差答案:C3. 以下哪项不是时间序列分析的类型?A. 季节性分析B. 趋势分析C. 相关性分析D. 循环分析答案:C二、多项选择题1. 商务统计中,以下哪些因素会影响数据的变异性?A. 数据的分布形态B. 数据的集中趋势C. 数据的离散程度D. 数据的样本大小答案:A、C2. 在进行商务经济预测时,常用的统计方法包括:A. 回归分析B. 指数平滑法C. 移动平均法D. 季节性调整答案:A、B、C三、简答题1. 简述商务统计中的指数平滑法的基本原理。
答案:指数平滑法是一种时间序列预测方法,它通过对历史数据加权平均来预测未来值。
权重随着时间的递减而递减,即近期的数据比远期的数据在预测中占有更大的权重。
这种方法可以平滑掉数据中的随机波动,从而更好地反映数据的趋势。
2. 描述商务统计中相关系数的计算方法及其意义。
答案:相关系数是用来衡量两个变量之间线性关系强度和方向的统计量。
其计算公式为:\[ r = \frac{\sum (X_i - \bar{X})(Y_i -\bar{Y})}{\sqrt{\sum (X_i - \bar{X})^2 \sum (Y_i -\bar{Y})^2}} \] 其中,\( X_i \) 和 \( Y_i \) 分别是两个变量的观测值,\( \bar{X} \) 和 \( \bar{Y} \) 是它们的平均值。
相关系数的值介于-1和1之间,值越接近1或-1表示变量间的线性关系越强,正值表示正相关,负值表示负相关。
四、计算题1. 假设有一组商务数据,其平均值为100,标准差为15。
如果某次测量结果为120,计算该结果的Z分数。
答案:Z分数的计算公式为:\[ Z = \frac{(X - \mu)}{\sigma} \]其中,\( X \) 是测量结果,\( \mu \) 是平均值,\( \sigma \) 是标准差。
商务统计习题解答.doc
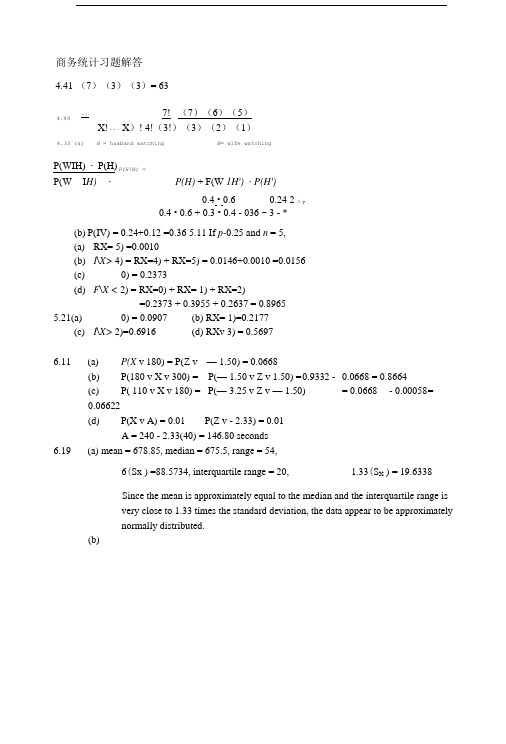
4.49 4.33 (a)H = husband watching W= wife watching P(H\W) =商务统计习题解答4.41 (7)(3)(3)= 63〃! _ 7! _(7)(6)(5)X!(〃一 X )! 4!(3!)(3)(2)(1)P(WIH)・P(H) P(W I H)・P(H) + F(W 1H')・P(H')0.4 • 0.6 0.24 2 八 y0.4 • 0.6 + 0.3 • 0.4 - 036 ~ 3 - *(b) P(IV) = 0.24+0.12 =0.36 5.11 If p-0.25 and n = 5,(a) RX= 5) =0.0010(b) I\X> 4) = RX=4) + RX=5) = 0.0146+0.0010 =0.0156(c) 0) = 0.2373(d) F\X < 2) = RX=0) + RX= 1) + RX=2)=0.2373 + 0.3955 + 0.2637 = 0.89655.21(a) 0) = 0.0907 (b) RX= 1)=0.2177(c) I\X> 2)=0.6916 (d) RXv 3) = 0.56976.11 (a) P(X v 180) = P(Z v — 1.50) = 0.0668(b) P(180 v X v 300) = P(— 1.50 v Z v 1.50) = 0.9332 - 0.0668 = 0.8664(c) P( 110 v X v 180) = P(— 3.25 v Z v — 1.50) = 0.0668 - 0.00058 =0.06622(d) P(X v A) = 0.01 P(Z v - 2.33) = 0.01A = 240 - 2.33(40) = 146.80 seconds6.19(a) mean = 678.85, median = 675.5, range = 54,6(Sx ) =88.5734, interquartile range = 20, 1.33(S X ) = 19.6338 Since the mean is approximately equal to the median and the interquartile range isvery close to 1.33 times the standard deviation, the data appear to be approximatelynormally distributed.(b)710X±Z- 350±1.96- 100V64 325.5 < 辱 374.50The normal probability plot suggests that the data appear to be approximately normally distributed. 7.9 (a)P(叉 < 0.75) = P(Z < -1.3693) = 0.0855 (b)P(0.70 <X < 0.90) = P(—2.7386 <Z<2.7386) = 0.9938 (c) P(A< X < B) = P(- L2816 < Z < 1.2816) = 0.80A =0.8-1.2816 (0.0365) = 0.7532 B= 0.8 +1.2816 (0.0365) = 0.8468(d) P(X <A) = P(Z< 1.2816) = 0.90 A = 0.8 +1.2816 (0.0365) = 0.8468Note: The above answers are obtained using PHStat. They may be slightly different whenTable E.2 is used.7.19 (a) P(0.15 vp v0.25) = P(- 1.25 <Z< 1.25)=0.7887(b) P(A<p<B) = P(- 1.6449 <Z< 1.6449) = 0.90A = 0.2 - 1.6449(0.04) = 0.1342B = 0.2 + 1.6449(0.04) = 0.2658(c) P(A v p v B) = P(- 1.960<Z< 1.960) = 0.95A =0.2 - 1.960(0.04) = 0.12160.2+ 1.96(0.04) = 0.27848.8 (a)(b) No. The manufacturer cannot support a claim that the bulbs last an average 400 hours.Based on the data from the sample, a mean of 400 hours would represent a distanceof 4 standard deviations above the sample mean of 350 hours.(c) No. Since is known and n = 64, from the Central Limit Theorem, we may assumethat the sampling distribution of X is approximately normal.(d) The confidence interval is narrower based on a process standard deviation of 80hours rather than the original assumption of 100 hours.Normal Probability Plot690 680670660700650 -2 -1.5 -1 -0.5 0 0.51 Z Value 1.5 2a loo sMp(a)8.18 (a) X±F・S “,c 八4.6024 -7= = 23 ±2.0739•― 4nV23 $21.01 <//< $24.99一cr80~F= = 350 ± 1.96 • —f=X ± Z ・4tr V64(b) Based on the smaller standard deviation, a mean of 400 hours would represent adistance of 5 standard deviations above the sample mean of 350 hours. No,the manufacturer cannot support a claim that the bulbs have a mean life of400 hours.(b) You can be 95% confident that the mean bounced check fee for the population issomewhere between $21.01 and $24.99.又◊又 (\n 77 . 7〔P(l ? P n77 . j QA /0.77(0.23)8.28 (a) p= 0.77 p ± Z • ------------------------- =().77 ±1.96」 ------------------------------\ n V 10000.74 <7t< 0.80(b)p = 0.77 p ± Z •、格王=0.77 ± 1,645/wWV n v 10000.75 <7T< 0.79(c)The 95% confidence interval is wider. The loss in precision reflected as a widerconfidence interval is the price you have to pay to achieve a higher level ofconfidence.Z2<T2 1.962 - 40028.38 (a) n =——=-------------- -—— =245.86 Use n = 246& 50~, Z2cr2 1.962 -4002八”八TT八睥(b) n = ——-— = --------------- ---- =983.41 Use n = 984& 2529.30 (a) Ho: " =375 hours. The mean life of the manufacturers light bulbs isequal to 375 hours.H\: // #375 hours. The mean life of the manufacturer9s light bulbs differs from375 hours.Decision rule: Reject 仇if Z v - 1.96 or Z > + 1.96.Test statistic: Z =与人笔尹=-2.00Decision: Since Z c^ = 一2.00 is below the critical bound of - 1.96, reject There isenough evidence to conclude that the mean life of the manufacturer's light bulbsdiffers from 375 hours.(b) ^-value = 2(0.0228) = 0.0456.Interpretation: The probability of getting a sample of 64 light bulbs that will yielda mean life that is farther away from the hypothesized population mean than thissample is 0.0456-(c)Test statistic: t = s 商 315.33/应y!n<64 (d) The results are the same. The confidence interval formed does not include thehypothesized value of 375 hours.9.58 (a) H Q : // < 400 The mean life of the batteries is not more than 400 hours. H 、: 〃> 400 The mean life of the batteries is more than 400 hours.X 一以 473.46-400 t “ --------------- 7= = 7= = 1 .230 / s/y/n 210.77/J13 Decision: Since t < 1.7823, do not reject H 。
商务统计试题及答案
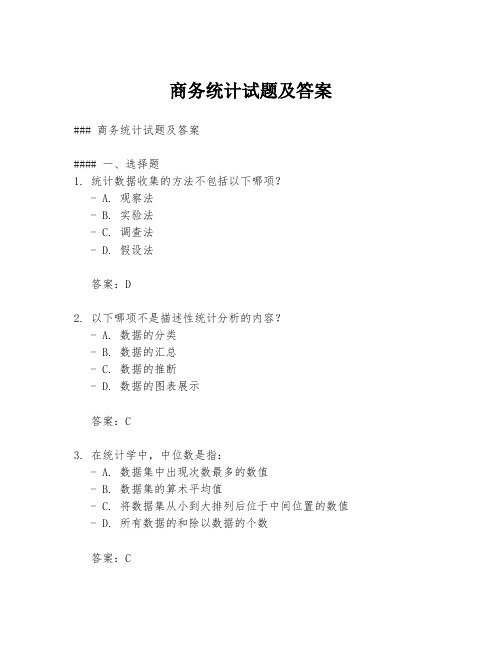
商务统计试题及答案### 商务统计试题及答案#### 一、选择题1. 统计数据收集的方法不包括以下哪项?- A. 观察法- B. 实验法- C. 调查法- D. 假设法答案:D2. 以下哪项不是描述性统计分析的内容?- A. 数据的分类- B. 数据的汇总- C. 数据的推断- D. 数据的图表展示答案:C3. 在统计学中,中位数是指:- A. 数据集中出现次数最多的数值- B. 数据集的算术平均值- C. 将数据集从小到大排列后位于中间位置的数值 - D. 所有数据的和除以数据的个数答案:C#### 二、简答题1. 解释什么是标准差,并简述其在商务统计中的重要性。
标准差是衡量一组数据离散程度的统计量,它表示数据集中的数值与平均值的偏差平方的平均数的平方根。
在商务统计中,标准差用于评估数据的波动性,帮助决策者了解业务风险和市场波动。
2. 描述相关系数的概念及其在商务分析中的应用。
相关系数是度量两个变量之间线性关系强度和方向的统计指标。
在商务分析中,相关系数可以用来评估不同因素对业务结果的影响,例如,销售额与广告支出之间的关系。
#### 三、计算题1. 给定以下数据集:10, 12, 15, 20, 25, 请计算平均值、中位数和标准差。
- 平均值 = (10 + 12 + 15 + 20 + 25) / 5 = 18- 中位数 = 15(数据集从小到大排列后位于中间位置的数值)- 标准差= √[(Σ(xi - 平均值)²) / n] = √[(10 - 18)² + (12 - 18)² + ... + (25 - 18)²] / 5 ≈ 5.392. 假设某公司连续5个月的销售额分别为:30万、35万、40万、45万和50万。
计算这5个月的平均销售额和销售额的增长趋势。
- 平均销售额 = (30 + 35 + 40 + 45 + 50) / 5 = 40万- 销售额的增长趋势可以通过计算每月销售额的增长率来分析,例如,从第一个月到第二个月的增长率为 (35 - 30) / 30 * 100% = 16.67%。
商务经济统计试题及答案

商务经济统计试题及答案一、单项选择题(每题2分,共20分)1. 商务经济统计的主要研究对象是什么?A. 社会经济现象B. 社会文化现象C. 自然现象D. 政治现象答案:A2. 下列哪项不是统计数据的来源?A. 人口普查B. 社会调查C. 历史记录D. 个人猜测答案:D3. 在商务经济统计中,下列哪项是描述性统计分析的内容?A. 预测未来趋势B. 描述数据特征C. 制定政策D. 进行假设检验答案:B4. 统计学中的“参数”是指什么?A. 样本数据B. 总体数据C. 样本容量D. 总体数量答案:B5. 以下哪个概念不是概率论的基本概念?A. 随机事件B. 概率C. 总体D. 样本答案:C6. 商务经济统计中,平均数通常用来衡量数据的什么?A. 集中趋势B. 离散程度C. 偏态分布D. 正态分布答案:A7. 在统计学中,标准差是用来衡量什么的?A. 集中趋势B. 离散程度C. 平均值D. 偏态分布答案:B8. 下列哪项是统计学中用于描述数据分布形状的指标?A. 平均数B. 标准差C. 众数D. 方差答案:C9. 在商务经济统计中,相关系数的取值范围是多少?A. -1到1B. 0到1C. 1到10D. -10到10答案:A10. 以下哪种图表最适合展示时间序列数据?A. 条形图B. 饼图C. 折线图D. 散点图答案:C二、多项选择题(每题3分,共15分)1. 商务经济统计中常用的数据收集方法包括哪些?A. 问卷调查B. 观察法C. 实验法D. 抽样调查答案:ABD2. 下列哪些是描述数据集中趋势的统计量?A. 平均数B. 中位数C. 众数D. 方差答案:ABC3. 在商务经济统计中,下列哪些因素会影响数据的代表性?A. 样本容量B. 抽样方法C. 样本误差D. 总体大小答案:AB4. 统计学中,下列哪些方法可以用来检验假设?A. t检验B. 卡方检验C. 回归分析D. 方差分析答案:ABD5. 在商务经济统计中,下列哪些图表可以用来展示数据的分布?A. 条形图B. 直方图C. 箱线图D. 散点图答案:ABC三、简答题(每题5分,共20分)1. 简述商务经济统计在企业决策中的作用。
《商务与经济统计课程》前三次作业参考答案
MS
F
兽医师间
0.03
4
0.0075 0.0065(ns)
奶牛间
0.65
4
0.1625
0.1404(ns)
试管间
0.19
4
0.0475
0.0410(ns)
Error
13.89
12
1.1575
Total
14.76
24
方差分析结果表明,兽医师间、奶牛间、试管间血色素的差异均不显著。
2.12 在下面变量中,哪些属于连续型变量?哪些属于离散型变量? (1)屠宰生畜头数量;(2)零件尺寸偏差;(3)飞机耗汽油;(4)报废的汽车数;(5)存 款余额;(6)洪水涨落尺度;(7)选民投票数;(8)车轮转速;(9)森林覆盖面积;(10) 价格。
1600
计数 4 4 7 10 9 6
组距 100 100 200 400 800 800
频数密度 0.040 0.040 0.035 0.025 0.011 0.008
3.10 试根据下表资料绘制曲线图,并指出该曲线图属于什么类型?
表 3-13
1900-1978 世界人口变化资料
单位:百万人
年份
补充: (1) 标准拉丁方阵、一般拉丁方阵以及拉丁方阵的一个定理
拉丁方阵是一种 n×n 的方阵,方阵中恰有 n 种不同的元素,每种元素恰有 n 个,并 且每种元素在一行和一列中恰好出现一次。当一个拉丁方阵的第一行与第一列的元素按顺序 排列时,即为拉丁方阵的标准型,称为"reduced Latin square, normalized Latin square, 或 Latin square in standard form"。一般拉丁方阵也就是区别于标准拉丁方阵且符合拉丁方阵条件的
商务统计试题及答案
商务统计试题及答案一、单项选择题(每题2分,共20分)1. 商务统计中,数据的收集方法不包括以下哪一项?A. 观察法B. 实验法C. 调查法D. 推算法答案:D2. 在统计学中,总体是指:A. 研究对象的全体B. 研究对象的一部分C. 研究对象的个体D. 研究对象的样本答案:A3. 下列哪个选项不是描述数据集中趋势的统计量?A. 平均数B. 中位数C. 方差D. 众数答案:C4. 在商务统计中,相关系数的取值范围是:A. -1到1之间B. 0到1之间C. 1到10之间D. 任何实数答案:A5. 以下哪种图表最适合展示时间序列数据的变化趋势?A. 条形图B. 饼图C. 折线图D. 散点图答案:C6. 假设检验的目的是:A. 确定总体参数B. 估计总体参数C. 验证样本数据D. 验证总体参数答案:D7. 在回归分析中,自变量和因变量之间的关系是:A. 正相关B. 负相关C. 无关D. 线性关系答案:D8. 下列哪个选项不是统计分析中常见的数据类型?A. 定类数据B. 定序数据C. 定距数据D. 定性数据答案:D9. 标准差是衡量数据离散程度的统计量,其计算公式为:A. 平均数的平方B. 平均数的平方根C. 方差的平方根D. 方差的倒数答案:C10. 以下哪个统计量用于衡量数据的偏态?A. 均值B. 方差C. 偏度D. 峰度答案:C二、多项选择题(每题3分,共15分)1. 下列哪些是商务统计中常用的数据收集方法?A. 观察法B. 实验法C. 调查法D. 推算法答案:ABC2. 在商务统计中,描述数据集中趋势的统计量包括:A. 平均数B. 中位数C. 方差D. 众数答案:ABD3. 以下哪些是描述数据离散程度的统计量?A. 标准差B. 方差C. 偏度D. 峰度答案:AB4. 在统计学中,总体参数和样本统计量的区别在于:A. 总体参数是固定的B. 样本统计量是估计值C. 总体参数是估计值D. 样本统计量是固定的答案:AB5. 下列哪些是商务统计中常见的数据类型?A. 定类数据B. 定序数据C. 定距数据D. 定性数据答案:ABC三、判断题(每题2分,共10分)1. 商务统计中,数据收集的方法只有调查法和观察法。
《商务与经济统计课程》第6、7章研讨问题的参考答案
第6、7章研讨问题的参考答案6.6 某公司人事资料,如表6-19所示。
表6-19 某公司人事资料表单位:人试计算该公司技术人员占全体员工的平均比重。
6.7 阳光货仓商场8月份上、中、下旬销售额分别为7.2万元、6.8万元、8.8万元。
8月初库存额为9.7万元,8月15日库存额为10.1万元,8月底库存额为8. 6万元。
每日在册人数:8月初至8月17日为17人,8月18日至8月底为20人。
试计算该商场8月份商品流转次数和劳动生产率。
6.8 某公司产品销售利润1995年比1990年增长80%,1997年比1990年增长1.25倍,如果1995年的产品销售利润为2500万元。
试计算:(1)1997年比1995年的增长率;(2)“八·五”期间每年平均增长率;(3)1990年和1997年的产品销售利润;(4)如果“九·五”期间继续以“八·五”期间的速度增长,该公司2000年的产品销售利润是多少?6.9 1980年我国GNP为4470亿元,1991年我国GNP增至19580亿元,试计算在该期间GNP每年的平均增幅。
若保持该发展速度,需花多少年我国GNP才会达到28400亿元?6.10 在“一五”计划期间,我国基本建设投资额如表6-20所示。
表6-20“一五”计划期间我国基本建设投资额表单位:亿元1952年基本建设投资总额为43.6亿元。
试计算基本建设投资额每年平均水平、平均增长量、平均增长速度。
7.5 若某一时问序列分别按17项和26项移动平均,则它们移动平均后分别导致了多少项的信息损失?为什么?7.6 某地区1996-2016年工业总产值资料,如表7-20所示。
试分别以时距长度为4年和7年运用时距扩大法、序时平均法和移动平均法对该时间序列进行修匀,并绘制其趋势轨迹图和分析其长期趋势。
表7-201996-2016年某地区工业总产值表单位:亿元7.7 某地2007-2016年基础建设经费投放资料,如表7-21所示:表7-212007-2016年某地基础建设经费投放表单位:亿元(1)试判断该时间序列为何种长期趋势。
商务与经济统计07
0.67 0.72 0.77
p
Slide 38
第三十八页,编辑于星期二:十六点 二十七分。
分层抽样 集群抽样 系统抽样 方便抽样 判断抽样
抽样方法
Slide 39
第三十九页,编辑于星期二:十六点 二十七分。
End of Chapter 7
Slide 40
第四十页,编辑于星期二:十六点 二十七分。
三位随机数
744 436 865 790 835 902 190 436 etc.
申请者编号
No. 744 No. 436 No. 865 No. 790 No. 835 超过 900 No. 190 已经出现过
etc.
Slide 13
第十三页,编辑于星期二:十六点 二十七分。
No. 随机数
1
744
Slide 16
第十六页,编辑于星期二:十六点 二十七分。
A
B
C
是否具有类似
1 申请人编号 考试成绩 工作经验
2
12
1107
有
3
773
1043
无
4
408
991
无
5
58
1008
有
6
116
1127
无
7
185
982
无
8
510
1163
无
9
394
1008
有
第10至第901行省略
D
随机数 0.00027 0.00192 0.00303 0.00481 0.00538 0.00583 0.00649 0.00667
x 的抽样分布
x 的抽样分布是指所有可能的样本平均值 x的概率分
- 1、下载文档前请自行甄别文档内容的完整性,平台不提供额外的编辑、内容补充、找答案等附加服务。
- 2、"仅部分预览"的文档,不可在线预览部分如存在完整性等问题,可反馈申请退款(可完整预览的文档不适用该条件!)。
- 3、如文档侵犯您的权益,请联系客服反馈,我们会尽快为您处理(人工客服工作时间:9:00-18:30)。
商务与经济统计精要版答案【篇一:经管类书单推荐】与管理学院 2016.10.17管理类推荐读物孙耀君,《西方管理学名著提要》,江西人民出版社1)管理学邢以群,《管理学》,浙江大学出版社周三多,《管理学》,复旦大学出版社2)管理信息系统kenneth udon/ jane udon ,《管理信息系统—网络化企业的组织与技术》(第六版,影印版),高等教育出版社薛华成,《管理信息系统》(第三版),清华大学出版社小威廉d.佩勒尔特 e.杰罗姆.麦卡锡,《市场营销学基础》:全球管理(英文版.第12版)--国际通用mba教材》,机械工业出版社郭毅等,《市场营销学原理》,电子工业出版社malhotra,n.k.著,《市场营销研究应用导向(第3版)》,电子工业出版社4)战略管理项保华,《战略管理——艺术与实务》,华夏出版社斯蒂文斯(英),《战略性思维》,机械工业出版社arthur a. thompson, jr. and a. j. strickland Ⅲ.crafting implementing strategy. 6th ed. richard d. irwin, inc., 1995中文版《战略管理学:概念与案例(英文版.第十版)-- 国际通用mba教材》,机械工业出版社david besanko, david dranove, mark shanley. the economics of strategy. john wiley sons, inc., 1996alan j. rowe; et al.. strategic management: a methodological approach. 4th ed. addison-wesley publishing company, inc., 19945)组织行为学卢盛忠等,《组织行为学:理论与实践》,浙江教育出版社英文版《human resource management: gaining a competitive advantage》,清华大学出版社约翰.m.伊万切维奇,《人力资源管理(英文版.原书第8版)-- 国际通用mba教材》,机械工业出版社luis r. gomez-mejia,david b.balkin,robert l. cardy,《管理人力资源 managing human resources 》(英文版第三版),北京大学出版社、培生教育出版集团7)财务管理8)管理统计david r.anderson dennis j.sweeney thomasa.william,《商务与经济统计(第七版)-- 经济教材译丛》,机械工业出版社david r.anderson;dennis j.sweeney;thomas a.william,《商务与经济统计(英文版.第8版)--21世纪经典原版经济管理教材文库》,机械工业出版9)会计学张启銮等,《会计学――工商管理硕士(mba)系列教材》,大连理工大学出版社cktde p.stickney roman l.weil,《财务会计(英文版第9版) --国际通用mba教材》,机械工业出版社ronald w.hilton,《管理会计(英文版.第三版)-- 国际通用mba教材》,机械工业出版10)西方经济学[美]平狄克等:《微观经济学》,中国人民大学出版社梁小民,《宏观经济学》,中国社会科学出版社梁小民,《西方经济学导论》,北京大学出版社宋承先,《现代西方经济学》(宏观经济学),复旦大学出版社[美] h.克雷格.彼得森等:《管理经济学》,中国人民大学出版社[美]s.charles maurice christopher r.thomas, managerial economics, 机械工业出社,2000年影印版11)运筹学胡运权,《运筹学教程(第二版)》,清华大学出版社蒋绍忠,《运筹学讲义》,浙江大学管理学院12)经济法高程德,《经济法》(第九版),上海人民出版社13)电子商务daniel amor,《电子商务:变革与演进--经济教材译丛》,机械工业出版社14)组织理论[美]达夫特著,李维安译.《组织理论与设计精要》,机械工业出版社[英]bernard burnes.《变革时代的管理》,云南大学出版社15)质量管理刘广第,《质量管理学(第二版)》,清华大学出版社16)生产管理陈荣秋、马士华,生产与运作管理,高等教育出版社,1999潘家轺等,现代生产管理学,北京:清华大学出版社,1994黄卫伟,生产与作业管理,北京:人民大学出版社,199717)项目管理毕星、翟丽,《项目管理》,复旦大学出版社,2000[美]杰克.吉多等著, 《成功的项目管理》,机械工业出版社,1999白思俊主编, 《现代项目管理》(上,中,下),机械工业出版社,20022.认知心理学,robert j.sternberg,中国轻工业出版社3.人格理论,jess feist,gregory j.feist,人民卫生出版社4.社会心理学,elliott aronson等,中国轻工业出版社5.集合起来——群体理论与团队技巧,david w. johnson等,中国轻工业出版社8.招贤纳士自有道,lance a. berger等,清华大学出版社11. 内向者优势,martin olsen laney,华东师范大学出版社13. 超级冷静,铃木丈织,上海人民出版社31. 刘墉的书:我不是教你诈、你不可不知的人性、人生的真相补充书籍:经济类专业推荐读物 1、《摩根财团——美国一代银行王朝和现代金融业的崛起》第二版获得1990年美国国家图书奖推荐理由:摩根家族的发迹史和19-20世纪美国金融市场和银行业发展演变的全景图,前任财政部副部长、现任亚洲开发银行副行长金立群先生的翻译代表了中文相关专业译著的最高水平。
英文名:the warburgs: the twentieth-century odyssey of a remarkable jewish family推荐理由:德国犹太富商sigmund warburg创办的著名商人银行华宝(瑞银华宝的前身)的兴衰史反映了19-20世纪欧洲与美国政经格局变迁对银行家个人与金融机构(尤其是投资银行)发展带来的巨大影响。
3、《豪门世家洛希尔》牛津学者niall ferguson著,目前内地还没有中文译本英文名:the house of rothschild: moneys prophets 1798-1848(上册),the house of rothschild: the worlds banker 1849-1998(下册)推荐理由:作为欧洲200多年来政治、经济与金融市场演变中最为重要的银行家族洛希尔(德国犹太人),其成败荣辱与英美国家实力的此消彼长以及巴黎、伦敦和纽约等金融中心的地位起伏紧密相联。
4、《花旗帝国》英文名:tearing down the walls: how sandy weill fought his way to the top of the financial world. . .and then nearly lost it all5、《贼巢》,获得美国普利策新闻奖英文名:den of thieves6、《门口的野蛮人》英文名:barbarians at the gate: the fall of rjr nabisco7、《说谎者的扑克牌》英文名:liars poker推荐理由:所罗门兄弟前交易员的经典之作,读者从中能了解20世纪80年代的美国证券市场发展,并学到很多有关交易领域的知识。
8、《大交易》英文名:big deal : mergers and acquisitions in the digital age 推荐理由:现任拉扎德(lazard freres co.)投资银行ceo的美国著名并购业务银行家的作品,对现代资本市场发展与企业并购的原因、交易者和趋势作了言简意赅的回顾和分析。
机构概况与职业发展9、《华尔街巨人》英文名:whos who and whats what on wall street《华尔街日报》编辑、记者著,海南出版社2000年12月出版推荐理由:从公司结构、发展战略、资产、利润和损失等方面全景式地分析华尔街最大与最分散经营的全方位服务公司、主要的零售经纪行、机构交易行、投资银行和商业银行。
该书还详细介绍了华尔街券商借以开展绝大部分业务的场所—纽约证券交易所和纳斯达克以及管理其业务的政府机构—证券与交易委员会和联邦储备委员会。
10、《华尔街追梦实录》英文名:monkey business: swinging through the wall street jungle推荐理由:两位刚从美国商学院毕业的mba学生,用幽默的笔触,回顾了他们从走进华尔街到成为“标准的投资银行家”的一路摸爬滚打的历程。
对于志在从analyst、associate起步,进军投资银行业的mba学生来说,此书的参考价值不言而喻.【篇二:安德森《商务与经济统计》(第10版)网授精讲班】> (江西师大附中使用)高三理科数学分析试卷紧扣教材和考试说明,从考生熟悉的基础知识入手,多角度、多层次地考查了学生的数学理性思维能力及对数学本质的理解能力,立足基础,先易后难,难易适中,强调应用,不偏不怪,达到了“考基础、考能力、考素质”的目标。
试卷所涉及的知识内容都在考试大纲的范围内,几乎覆盖了高中所学知识的全部重要内容,体现了“重点知识重点考查”的原则。
1.回归教材,注重基础试卷遵循了考查基础知识为主体的原则,尤其是考试说明中的大部分知识点均有涉及,其中应用题与抗战胜利70周年为背景,把爱国主义教育渗透到试题当中,使学生感受到了数学的育才价值,所有这些题目的设计都回归教材和中学教学实际,操作性强。
2.适当设置题目难度与区分度选择题第12题和填空题第16题以及解答题的第21题,都是综合性问题,难度较大,学生不仅要有较强的分析问题和解决问题的能力,以及扎实深厚的数学基本功,而且还要掌握必须的数学思想与方法,否则在有限的时间内,很难完成。
3.布局合理,考查全面,着重数学方法和数学思想的考察在选择题,填空题,解答题和三选一问题中,试卷均对高中数学中的重点内容进行了反复考查。
包括函数,三角函数,数列、立体几何、概率统计、解析几何、导数等几大版块问题。
这些问题都是以知识为载体,立意于能力,让数学思想方法和数学思维方式贯穿于整个试题的解答过程之中。
二、亮点试题分析1.【试卷原题】11.已知a,b,c是单位圆上互不相同的三点,且满足ab?ac,则abac?的最小值为()141b.?23c.?4d.?1a.?【考查方向】本题主要考查了平面向量的线性运算及向量的数量积等知识,是向量与三角的典型综合题。