氧化石墨烯的缺陷密度
氧化石墨烯作为阳离子污染物吸附剂的性能评价
氧化石墨烯作为阳离子污染物吸附剂的性能评价氧化石墨烯作为一种新型的吸附剂,近年来被广泛研究和应用。
与传统的吸附材料相比,其具有具有高比表面积、丰富的官能团、强极性、良好的稳定性和可再生等特点。
尤其在其对阳离子污染物的吸附性能研究中,产生了广泛的关注。
一、研究现状目前,许多学者已经对氧化石墨烯吸附阳离子污染物的性能进行了研究。
其中,研究的重点集中在其吸附性能与物理化学性质的关系。
在氧化石墨烯的物理化学性质方面,其高比表面积、丰富的官能团和强极性成为实现阳离子吸附的重要条件。
通过改变石墨烯氧化程度、活化处理、修饰化学基团等方法,可以有效的调控其表面物化性质。
二、理论基础在理论方面,相关研究主要基于吸附平衡和动力学两个方面。
在吸附平衡方面,研究表明,氧化石墨烯的吸附量与阳离子的初始浓度、溶液pH值、吸附时间和温度等参数有关。
在动力学方面,研究表明,氧化石墨烯吸附阳离子的过程符合准二级动力学模型。
三、实验研究为了验证氧化石墨烯作为吸附剂的性能,我们设计了一组实验。
在实验中,我们选择了Cd2+作为模型阳离子,研究氧化石墨烯对其吸附性能。
实验结果表明,氧化石墨烯能够有效的吸附Cd2+离子,且其吸附能力随氧化程度的增加而提高。
随着环境pH值的升高,其吸附能力呈现出先增大后减小的趋势,而在酸性条件下,其吸附能力与pH值基本无关。
此外,我们还研究了氧化石墨烯的饱和吸附量、动力学模型和吸附等温线,验证了其对阳离子污染物的吸附性能表现。
四、结论与展望综上所述,氧化石墨烯作为一种新型的吸附剂具有很好的阳离子污染物吸附能力,研究表明其吸附量受多种因素的影响,吸附过程符合准二级动力学模型。
未来的研究还有待进一步深入,例如,进一步研究氧化石墨烯对复杂污染物的吸附性能,以及研究其在实际工程应用中的可行性等问题。
毫无疑问,随着科学技术的不断进步,氧化石墨烯的应用前景必将更加广阔。
单层氧化石墨烯性能参数

单层氧化石墨烯性能参数单层氧化石墨烯性能参数,这是很多人想知道的知识。
氧化石墨烯是一种性能很好的新型碳材料,具有较高的比表面积和表面丰富的官能团,应用范围很广,市面上常见的产品有粉末状、片状以及溶液状的。
氧化石墨烯可视为一种非传统型态的软性材料,具有聚合物、胶体、薄膜,以及两性分子的特性。
下面就由先丰纳米简单的介绍单层氧化石墨烯性能参数。
1、性能(1)含有丰富的羟基、羧基和环氧基等含氧官能团;(2)易于接枝改性,可与复合材料进行原位复合,从而赋予复合材料导电、导热、增强、阻燃、抗菌抑菌等性能;(3)易于剥离成稳定的氧化石墨烯分散液,易于成膜。
2、用途应用于橡胶、塑料、树脂、纤维等高分子复合材料领域,还可以应用于锂电正负极材料的复合、石墨烯导热膜、催化剂负载。
3、操作处置与储存操作人员需穿戴合适的防护服及防护手套;避免与皮肤直接接触,进入眼睛,应立即用大量清水冲洗。
产品需密闭贮存于阴凉、通风及干燥的环境,在20℃的环境中贮存效果更佳。
远离火种、热源,应与强还原剂、易燃物分开存放。
4、运输非限制性货物,运输中应注意安全,防止日晒、雨淋、渗漏和标签脱落,严禁抛掷,轻装轻卸,远离热源,隔绝火源。
如果想要了解更多关于单层氧化石墨烯的内容,欢迎立即咨询先丰纳米。
先丰纳米是江苏先进纳米材料制造商和技术服务商,专注于石墨烯、类石墨烯、碳纳米管、分子筛、黑磷、银纳米线等发展方向,现拥有石墨烯粉体、石墨烯浆料和石墨烯膜完整生产线。
自2009年成立以来一直在科研和工业两个方面为客户提供完善服务。
科研客户超过一万家,工业客户超过两百家。
南京先丰纳米材料科技有限公司2009年9月注册于南京大学国家大学科技园内,现专注于石墨烯、类石墨烯、碳纳米管、分子筛、银纳米线等发展方向,立志做先进材料及技术提供商。
2016年公司一期投资5000万在南京江北新区浦口开发区成立“江苏先丰纳米材料科技有限公司”,建筑面积近4000平方,形成了运营、研发、中试、生产全流程先进纳米材料制造和技术服务中心。
石墨烯材料拉曼光谱测试详解
2004年英国曼彻斯特大学的A.K.Geim领导的小组首次通过机械玻璃的方法成功制备了新型的二维碳材料-石墨烯(graphene)。
自发现以来,石墨烯在科学界激起了巨大的波澜,它在各学科方面的优异性能,使其成为近年来化学、材料科学、凝聚态物理以及电子等领域的一颗新星。
就石墨烯的研究来说,确定其层数以及量化无序性是至关重要的。
激光显微拉曼光谱恰好就是表征上述两种性能的标准理想分析工具。
通过测量石墨烯的拉曼光谱我们可以判断石墨烯的层数、堆垛方式、缺陷多少、边缘结构、张力和掺杂状态等结构和性质特征。
此外,在理解石墨烯的电子声子行为中,拉曼光谱也发挥了巨大作用。
石墨烯的典型拉曼光谱图石墨烯的拉曼光谱由若干峰组成,主要为G峰,D峰以及G’峰。
G峰是石墨烯的主要特征峰,是由sp2碳原子的面内振动引起的,www.glt910.com它出现在1580cm-1附近,该峰能有效反映石墨烯的层数,但极易受应力影响。
D峰通常被认为是石墨烯的无序振动峰,该峰出现的具体位置与激光波长有关,它是由于晶格振动离开布里渊区中心引起的,用于表征石墨烯样品中的结构缺陷或边缘。
G’峰,也被称为2D峰,是双声子共振二阶拉曼峰,用于表征石墨烯样品中碳原子的层间堆垛方式,它的出峰频率也受激光波长影响。
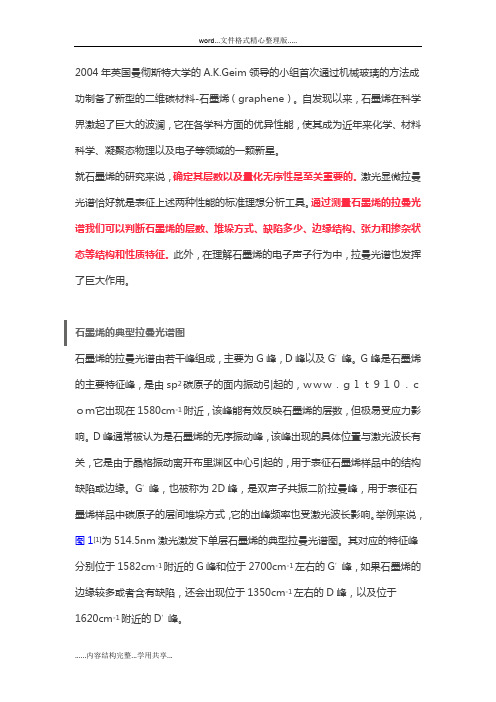
举例来说,图1[1]为514.5nm激光激发下单层石墨烯的典型拉曼光谱图。
其对应的特征峰分别位于1582cm-1附近的G峰和位于2700cm-1左右的G’峰,如果石墨烯的边缘较多或者含有缺陷,还会出现位于1350cm-1左右的D峰,以及位于1620cm-1附近的D’峰。
图1 514nm激光激发下单层石墨烯的典型拉曼光谱图[1]当然对于sp2碳材料,除了典型的拉曼G峰,D峰以及G’峰,还有一些其它的二阶拉曼散射峰,大量的研究表明石墨烯含有一些二阶的和频与倍频拉曼峰,这些拉曼信号由于其强度较弱而常常被忽略。
如果对这些弱信号的拉曼光谱进行分析,也可以很好地对石墨烯中的电子-电子、电子-声子相互作用及其拉曼散射过程进行系统的研究。
氧化石墨烯的sem描述

氧化石墨烯的sem描述氧化石墨烯是一种具有广泛应用前景的二维材料,具有独特的结构和特性。
本文将从结构、制备方法、表征以及应用等方面对氧化石墨烯进行详细描述。
1. 结构氧化石墨烯是由石墨烯经过氧化处理得到的产物。
石墨烯是由碳原子通过sp2杂化形成的六角网格结构,而氧化石墨烯则是在石墨烯表面引入了氧原子。
氧化石墨烯的结构中含有大量的羟基、羧基和环氧基等官能团,使其具有较高的化学活性和表面活性。
2. 制备方法氧化石墨烯的制备方法多种多样,常见的方法包括Hummers法、Brodie法、热氧化法等。
其中,Hummers法是最常用的制备方法之一。
该方法通过将石墨与硫酸、硝酸等强酸混合处理,使石墨表面发生氧化反应,得到氧化石墨烯。
制备过程中需要控制反应温度、时间和酸浓度等参数,以获得高质量的氧化石墨烯。
3. 表征对氧化石墨烯进行表征是了解其结构和性质的重要手段。
常用的表征方法包括扫描电子显微镜(SEM)、透射电子显微镜(TEM)、X 射线衍射(XRD)、傅里叶变换红外光谱(FTIR)等。
其中,SEM 可以观察到氧化石墨烯的表面形貌和层状结构,TEM可以进一步观察其层状结构和原子尺度的细节。
XRD和FTIR可以用于分析氧化石墨烯的晶体结构和官能团的存在情况。
4. 特性氧化石墨烯具有许多独特的特性,使其在各个领域具有广泛的应用前景。
首先,由于氧化石墨烯表面含有丰富的官能团,使其具有良好的亲水性和分散性,有利于其在复合材料、涂料等领域的应用。
此外,氧化石墨烯具有较高的导电性和热导率,可用于制备导电薄膜、传感器、储能器件等。
此外,氧化石墨烯还具有优异的力学性能和化学稳定性,在柔性电子器件、催化剂等方面也有广泛的应用潜力。
5. 应用氧化石墨烯的应用领域非常广泛。
首先,在能源领域,氧化石墨烯可以用于制备高效的储能器件,如锂离子电池、超级电容器等。
其次,在材料领域,氧化石墨烯可以用于制备高强度、高导电性的复合材料,在航空航天、汽车制造等领域具有重要的应用价值。
【精品文章】氧化石墨烯你知多少

氧化石墨烯你知多少
关于石墨烯想必大家都早已耳熟能详,蜂窝状的结构、优良的力学性能、电学性能、光学性能等,在此不做过多介绍,而经常伴着石墨烯一起被人们挂在嘴边的就是氧化石墨烯,那么为什么要有氧化石墨烯的存在,笔者认为最大的原因还是在分散性上。
氧化石墨烯,顾名思义是石墨烯的氧化物,将活性含氧基团引入石墨烯上,经过处理后得到经过修饰的石墨烯薄片,这样就增加了活性反应位点,使得氧化石墨烯变得更容易进行表面改性,丰富了功能化的手段,可以有效提高改性氧化石墨烯与溶剂、聚合物的相容性,使其在有机以及无机复合材料领域有着更为广阔的应用。
对于粉体材料的应用,其前提就是能够很好的分散在所使用的体系中,能做到单分散最好,这样才可以真正发挥粉体材料的特殊性能,然而想让石墨烯材料在水中完全的分散开来是十分困难的,因为石墨烯材料表面几乎没有亲水基团,但氧化石墨烯缺陷处附带的羟基、羧基等亲水集团可以使得其在水中的分散性要优于石墨烯。
图1:氧化石墨烯结构
制备方法简介
目前国内外主流的制备氧化石墨烯的方法是Hummers法,其制备过程可以简单概括为:
1.向强酸(浓硫酸)和强氧化剂(高锰酸钾)中加入石墨,反应得到氧化石墨烯;
2.通过磁搅拌或超声振荡剥离得到的氧化石墨烯;。
石墨烯氧化还原反应机理研究
石墨烯氧化还原反应机理研究第一章概述石墨烯是一种单层的碳原子排列成的二维晶体结构,由于其独特的物理和化学性质,在纳米科技、能源、电子学和材料科学领域受到广泛关注。
其中,石墨烯氧化还原反应机理的研究是其应用研究中的重点之一。
第二章石墨烯氧化还原反应机理2.1 石墨烯氧化反应机理石墨烯氧化反应机理分为两个步骤,首先发生氧化过程,然后再还原。
2.1.1 氧化石墨烯的氧化反应主要是指将石墨烯的碳原子与氧分子结合形成氧化石墨烯的过程。
理论上,氧和石墨烯碳原子之间的结合是通过羟基醇形成的,这个过程即为氧化反应。
实验条件下氧化反应需要使用硝酸等氧化剂,其实质是利用氧和其它高电负性离子或分子对石墨烯碳原子进行氧化。
氧化反应后的石墨烯形成的是含有羟基醇的氧化石墨烯,由于氧化石墨烯很难在空气中稳定存在,因此需要对其进行还原处理。
2.1.2 还原将氧化石墨烯还原成石墨烯,通常需要使用还原剂。
目前常用的还原剂有:水合亚硫酸钠、氨水、氢气等。
在还原的过程中,羟基醇被还原成水,氧化石墨烯中还原的羰基被还原成羰基,最终生成未被氧化的石墨烯。
2.2 石墨烯氧化还原反应的应用2.2.1 石墨烯化学传感器石墨烯是一种优秀的传感器材料,它有着优秀的化学稳定性和导电性能。
利用石墨烯在氧化还原反应中的性质,可以制备出高灵敏度和高选择性的化学传感器。
比如,利用氧化石墨烯与还原石墨烯的差异性制备出的石墨烯化学传感器,可以检测实验室中常见的有机气体和液体。
2.2.2 石墨烯储能器件石墨烯由于其高的比表面积和优异的导电性能,一直被认为是一种优秀的电极材料。
石墨烯氧化还原反应可以有效的调控石墨烯的导电性、氢吸附能力和表面吸附性能,从而可以制备出高性能的储能器件。
比如,利用氧化石墨烯和还原石墨烯的制备超级电容器,其储能密度和循环稳定性均优于传统的储能材料。
2.2.3 石墨烯电子器件石墨烯的导电性能是其在电子学领域应用的优势之一。
通过氧化还原反应可以调控石墨烯的导电性能、能带结构和缺陷密度,从而制备出高性能的电子器件。
氧化石墨烯复合材料分类_概述说明以及解释

氧化石墨烯复合材料分类概述说明以及解释引言部分的内容如下:1. 引言1.1 概述氧化石墨烯复合材料是指将氧化石墨烯与其他材料进行混合、复合而形成的新型材料。
随着科学技术的发展,氧化石墨烯复合材料在各个领域中得到了广泛应用和关注。
通过使用不同种类和比例的复合材料组分,可以调控氧化石墨烯复合材料的性能和特性,从而满足不同应用需求。
1.2 文章结构本文将围绕着氧化石墨烯复合材料的分类进行详细说明和解释。
首先,我们将简要介绍石墨烯和氧化石墨烯的基本概念,并阐述它们在复合材料中的应用意义。
接下来,我们将重点介绍不同分类方法对氧化石墨烯复合材料进行划分,并详述每一种分类方法的优缺点。
随后,我们将重点探讨氧化石墨烯纳米复合材料这一具体类型,在概述其制备方法后,对其特点与性能进行分析,并展望其在未来的应用前景。
最后,我们将总结文章,并给出一些结论和对进一步研究的建议。
1.3 目的本文旨在通过系统概述氧化石墨烯复合材料的分类方法及其应用领域,加深读者对这一领域的认识和理解。
通过了解不同分类方法以及相关特点和性能分析,在工程设计、材料选择以及新材料开发等方面提供参考和指导。
同时,本文也希望为进一步深入研究氧化石墨烯复合材料的科学家们提供激发灵感和探索空间。
2. 氧化石墨烯复合材料分类2.1 石墨烯和氧化石墨烯简介石墨烯是由碳原子形成的单层二维晶体结构,具有优异的电学、光学、力学和导热性能。
然而,纯净的石墨烯在大气中容易发生氧化反应,形成氧化石墨烯。
氧化石墨烯是一种具有含氧官能团的材料,相较于纯净的石墨烯,在操作上更加稳定且易于处理。
2.2 氧化石墨烯复合材料的基本概念和特点氧化石墨烯复合材料是将氧化石墨烯与其他材料进行混合或组装而成的新型复合材料。
通过与其他材料的结合,可以充分发挥其各自优势,并在性能上取得协同增强效果。
氧化石墨烯复合材料具有以下特点:1. 增强机械性能:加入适量的氧化石墨烯可以提高复合材料的强度、硬度和韧性,使其具有更好的力学性能。
低温一步制备氧化石墨烯及微波还原研究

低温一步制备氧化石墨烯及微波还原研究宇文超;刘秉国;张立波;郭胜惠;彭金辉【摘要】以天然鳞片石墨为原料,通过低温一步氧化制备氧化石墨烯,经微波热还原得到低缺陷的还原氧化石墨烯.讨论了低温氧化过程中氧化剂用量、氧化时间对氧化石墨烯层间距、氧化程度的影响.结果表明:在高锰酸钾与天然鳞片石墨的质量比为1∶3,氧化温度为0℃,氧化时间为48h的条件下,制备出碳氧原子比为1.98、高C-O结构、低缺陷结构(ID∶IG=0.63)的氧化石墨烯,避免了Hummers制备过程中由于CO2的形成导致六元环断裂以及碳原子的缺失而使得氧化石墨烯的缺陷增加;经微波热还原后,得到的还原氧化石墨烯的两点平均缺陷距离LD=12nm,缺陷密度nD=2.21×1011 cm-2,ID∶IG仅为0.85(ΓG=32.1cm-1),制备出低缺陷的还原氧化石墨烯.【期刊名称】《材料工程》【年(卷),期】2019(047)009【总页数】8页(P21-28)【关键词】氧化石墨烯;缺陷;低温;微波【作者】宇文超;刘秉国;张立波;郭胜惠;彭金辉【作者单位】昆明理工大学冶金与能源工程学院,昆明650093;云南省特种冶金重点实验室,昆明650093;昆明理工大学非常规冶金省部共建教育部重点实验室,昆明650093;昆明理工大学冶金与能源工程学院,昆明650093;云南省特种冶金重点实验室,昆明650093;昆明理工大学非常规冶金省部共建教育部重点实验室,昆明650093;昆明理工大学冶金与能源工程学院,昆明650093;云南省特种冶金重点实验室,昆明650093;昆明理工大学非常规冶金省部共建教育部重点实验室,昆明650093;昆明理工大学冶金与能源工程学院,昆明650093;云南省特种冶金重点实验室,昆明650093;昆明理工大学非常规冶金省部共建教育部重点实验室,昆明650093;昆明理工大学冶金与能源工程学院,昆明650093;云南省特种冶金重点实验室,昆明650093;昆明理工大学非常规冶金省部共建教育部重点实验室,昆明650093【正文语种】中文【中图分类】TB320石墨烯是富勒烯、碳纳米管和石墨等碳材料的基本构成单元,是sp2碳原子杂化排列的六角形蜂巢晶格的二维材料。
- 1、下载文档前请自行甄别文档内容的完整性,平台不提供额外的编辑、内容补充、找答案等附加服务。
- 2、"仅部分预览"的文档,不可在线预览部分如存在完整性等问题,可反馈申请退款(可完整预览的文档不适用该条件!)。
- 3、如文档侵犯您的权益,请联系客服反馈,我们会尽快为您处理(人工客服工作时间:9:00-18:30)。
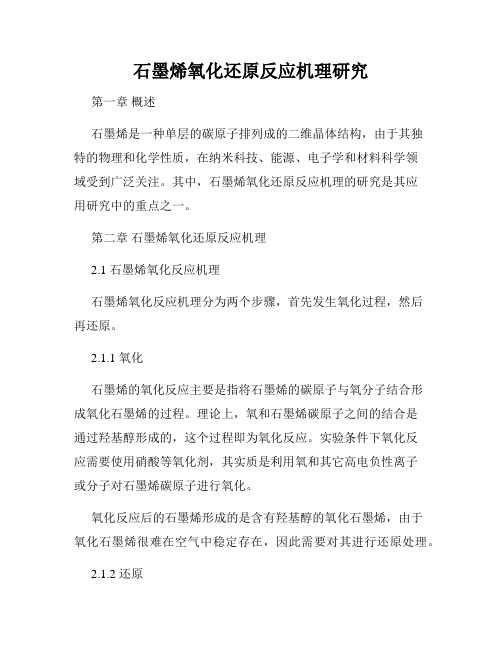
Visualization of defect densities in reduced graphene oxideSiegfried Eigler *,Christoph Dotzer,Andreas HirschDepartment of Chemistry and Pharmacy,University Erlangen-Nu ¨rnberg,Henkestr.42,91054Erlangen,Germany Institute of Advanced Materials and Processes (ZMP),University Erlangen-Nu ¨rnberg,Dr.-Mack Str.81,90762Fu ¨rth,GermanyA R T I C L E I N F O Article history:Received 30December 2011Accepted 20March 2012Available online 25March 2012A B S T R A C TEfficiently reducible graphene oxide (GO)was obtained,even if a high degree of functional-ization is present.Graphite with few defects was used as starting material and oxidized according to Hummer’s method.An extremely high I D /I G ratio for rGO of 2.8(532nm)was observed in the Raman spectrum as a consequence of the lower defect density in GO.It was also possible to demonstrate the impact of local defects on the structure in rGO by local laser exposure experiments on single graphene oxide flakes.Raman spectros-copy can visualize the laser impact by I D /I G ratio measurements.Ó2012Elsevier Ltd.All rights reserved.1.IntroductionGraphene is one of the most exciting materials known due to its exceptional physical properties,as the extremely high charge carrier mobility of 40.000or even 200.000cm 2/V s that makes new electronic devices reachable [1,2].Further,trans-parent electrodes are one desired application for graphene utilizing the transparency and intrinsic conductivity [3].The main drawback is the poor processibility of graphene,be-cause it is insoluble in most common solvents.This is one reason why graphite is functionalized,either non covalent,or covalent to gain soluble graphene [4–6].Although this ap-proach is promising,the yield is still poor.Otherwise,graph-ene oxide (GO)is one promising material for the mass production of graphene.The important advantages are the ease of accessibility from graphite and the processibility in aqueous solution,even at high concentrations of typically 1mg/ml [7].After the removal of functional groups (in GO mainly epoxy and hydroxyl groups)reduced graphene oxide (rGO)is obtained and electronic properties are partially re-stored but e.g.the electrical conductivity of rGO still lacks be-hind that of pristine graphene and so does the charge carrier mobility.Defects in rGO or inefficient reduction of GO are the two most prominent reasons for poor performance [8].One possible answer to that problem is to use GO with a low degree of oxidation.Recently,it was shown that it is pos-sible to prepare field effect transistors from that material and charge carrier mobilities up to 10–15cm 2/V s could be deter-mined [9,10].In another approach,GO was mildly oxidized using less oxidant to yield an increased quality of rGO with fewer defects after reduction what was proved by Raman spectroscopy [11].Recently,it was demonstrated that the graphite grade used for the preparation can alter the structure of GO [12].To gain information about defects in graphene based materials,Raman spectroscopy is an adequate method.It provides information for the mean distance between de-fects in rGO.The ratio between the intensities of the D and G peak correlate with the mean distance of two defects in graphene as it was found by Ar-ion bombardment on graph-ene [13].Here,we report a high ratio of about 2.8,the highest value measured for rGO on single layer flakes that originates from GO prepared by Hummer’s method.This observation is re-lated to an increased quality of rGO,as discussed later.Fur-ther,GO is highly oxidized,as it is proved by TGA–MS and FTIR.This observation is in stark contrast to the latest litera-ture [9,11].Besides,the GO flakes described here can be struc-tured by laser induced local heat causing defects (CO 20008-6223/$-see front matter Ó2012Elsevier Ltd.All rights reserved./10.1016/j.carbon.2012.03.039*Corresponding author at:Department of Chemistry and Pharmacy,University Erlangen-Nu ¨rnberg,Henkestr.42,91054Erlangen,Germany.Fax:+499116507865015.E-mail address:siegfried.eigler@zmp.uni-erlangen.de (S.Eigler).formation)what can be identified by Raman spectroscopy (Fig.1).This new approach makes it possible to visualize dif-ferent defect densities in rGO on the same flake for the first time.2.Experimental procedures2.1.General methodsNatural flake graphite was obtained from Kropfmuehl AG,Germany.The grade used as reference material was SC-20O.The high quality graphite was obtained from Asbury Carbon.The grade used was 3061.Potassium permanganate,sodium nitrate,sulfuric acid were obtained from Sigma–Aldrich â.Thermogravimetric analysis (TGA)equipped with a mass spectrometer (MS)was accomplished on a Netzsch STA 409CD instrument equipped with a Skimmer QMS 422mass spec-trometer (MS/EI)with the following programmed time depen-dent temperature profile:RT-800°C (TGA-MS)with 10K/min gradient,and cooling to RT.The initial sample weights were about 6–7mg and the whole experiment was accomplished under inert gas atmosphere with a He gas flow of 80ml/min.Bruker Tensor FTIR spectrometer equipped with ZnSe was used for the measurements of GO films.Freeze-drying was accomplished on an ALPHA 1–4LDplus from Matrtin Christ,Germany.For centrifugation a Sigma 4K15centrifuge,Sigma Laborzentrifugen GmbH,Germany,was used.Atomic force microscopy (AFM)measurements were performed on in tapping mode using SolverPro from NT-MDT.The samples we prepared by dropping a diluted dispersion of graphene oxide on Si/SiO 2wafers.The oscillation amplitude was usu-ally chosen to be 5nm,the setpoint was about 3nm.Raman spectroscopic studies were done on Horiba Jobin Yvon Lab-RAM Aramis confocal Raman spectrometer equipped with a microscope and an automated XYZ table,at laser excitation of 532nm if not mentioned ser energy can be al-tered by filters (D2:0.06,D1:0.38,D0.6:0.97,D0.3:1.94mW).Elemental analysis was performed by combustion and gas chromatographic analysis with an EA 1110CHNS analyzer from CEInstruments.The electrical conductivities and the surface resistances of graphite were measured according to the 4-point probe method on graphite pellets (13mm diameter)pressed with atypical IR-molding press at 10t/cm 2.The resistivity test unit used was RM3000equipped with a cylindrical 4-point probe head (probe spacing of 0.635mm)from Jandel Engineering Limited,UK.The thickness of the pellets was determined using a calibrated optical microscope (Axio M1m Imager,Carl Zeiss,Germany).2.2.Analysis of starting materialsGrade SC-20O.The electrical conductivity of grade SC-20O was determined by 4-point probe method to be 420S/cm.The ratio of I D and I G in the Raman spectra was determined to 0.12on the flake and 0.16in average (900l m 2)from the same pellets of the bulk graphite using DuoScan.Grade 3061.The electrical conductivity of grade 3061was determined by 4-point probe method to be 1600S/cm.The ra-tio of I D and I G in the Raman spectra was determined to 0.04on the flake and 0.10in average (900l m 2)from the same pel-lets of the bulk graphite using DuoScan.2.3.Preparation of GO1and GO2Graphene oxide from grade SC-20O (GO1).No pre-treatment of graphite was applied.Graphite (1g,grade SC-20O,Kro-pfmuehl AG)and sodium nitrate (0.5g)were dispersed in con-centrated sulfuric acid (24ml).The dispersion was cooled by ice to about 5°C.After that,within a period of 30min potas-sium permanganate (3.0g)was added in small portions and the dispersion was stirred an additional hour at 20°C.The reaction mixture was then poured on ice (500ml)and hydro-gen peroxide (10ml,3%)was added drop wise until gas evolu-tion was completed.The obtained graphite oxide was purified by repeated centrifugation and dispersion in water until the pH of the supernatant was neutral.Finally,GO1was yielded by mild sonication using a bath sonicator.The suspension was finally centrifuged three times at 5000g to remove remaining graphite oxide.Elemental Analysis:C 45.89,H 2.40,N 0.0,S 3.88.Graphene oxide from grade 3061(GO2).No pre-treatment of graphite was applied.Graphite (1g,grade 3061,Asbury Car-bon)and sodium nitrate (0.5g)were dispersed in concen-trated sulfuric acid (24ml).The dispersion was cooled by ice to about 5°C.After that,within a period of three hours potas-GOlaser exposition in middle regionrGOreductionlaser(A)(B)(C)–Illustration of (A)GO according to the Lerf–Klinowski model;(B)GO during laser exhibition by Raman laser (532nm);(reduced by hydrazine hydrate),more defects remain (e.g.ethers)in middle region compared to loop region (if no exhibition is applied rGO bears fewer defects than illustrated here).C A R B O N50(2012)3666–36733667sium permanganate(3.0g)was added in small portions and the dispersion was stirred an additional three hours at 20°C.Due to the lower reactivity of grade3061compared to SC-20O a longer reaction time was necessary.The reaction mixture was then poured on ice(500ml)and hydrogen perox-ide(10ml,3%)was added drop wise until gas evolution was completed.The obtained graphite oxide was purified by re-peated centrifugation and dispersion in water until the pH of the supernatant was neutral.Finally,GO2was yielded by mild sonication using a bath sonicator.The suspension was finally centrifuged three times at5000g to remove remaining graphite oxide.Elemental Analysis:C43.22,H2.27,N0.0,S 6.15.2.4.GOfilms on ZnSeA diluted dispersion of GO was drop-casted on a ZnSe window and thefilm was formed by evaporation of the solvent at ambient conditions.The thickness of thefilm was deter-mined using the Z-indicator of the Zeiss microscope.Thereto, thefilm was scratched and either the top of thefilm or the substrate was focused.The thickness was about2–3l m.2.5.Structuring GO by Raman laserGO2was structured using the Raman laser(532nm)at low dose using D2filter and placed a5s laser pulse(9l m2)in the middle offlake(GO2b).A higher dose(5s,D0.3)was used in the case of GO2c.2.6.Reduction of GOflakesTheflakes were reduced by hydrazine vapor for1h at RT and an additional1h at80°C.Finally,the material was annealed at120°C to yield rGO.3.Results and discussion3.1.Preparation of GOIn this study we used natural graphite(grade3061)from As-bury Carbon and prepared GO according to Hummer’s meth-od.The purity of that graphite is higher than99%and the grain size is rather large with about300l m(supplier informa-tion).Further,Raman spectroscopy proves the low defect den-sity of the graphite by the D peak being almost absent with an I D/I G ratio of0.04onflakes,neglecting the edges and0.10on the surface of900l m2.The structural integrity is also re-flected by the electrical conductivity of1600S/cm which was determined by four-point-probe measurements on pel-lets.As reference material we used grade SC-20O from Kro-pfmuel AG and here we found an I D/I G ratio of0.12onflakes and0.16on the surface of900l m2.The electrical conductivity was determined to420S/cm,reflecting the higher defect density.We prepared GO from both materials(SC-20O,GO1;3061, GO2)using Hummer’s method[14].No pre-treatment of graphite was applied and the graphite was oxidized in con-centrated sulfuric acid with potassium permanganate as the oxidant and small amounts of sodium nitrate.The work-up was done using water and hydrogen peroxide.The material was purified by repeated centrifugation and GO was obtained after exfoliation(bath sonicator).In the case of grade SC-20O the oxidation time was1.5h compared to6h for grade3061, due to its lower reactivity.3.2.Characterization of GO by TGA-MS and FTIRBoth grades of GO(GO1,GO2)were analyzed by TGA-MS from freeze dried GO samples and FTIR samples were prepared from aqueous dispersions on ZnSe to verify that both materi-als were oxidized in the same way.In the recent literature GO with a low degree of oxidation is prepared to minimize de-fects caused by oxidation[9,11].Wefind that a low degree of oxidation is not essential to yield rGO with fewer defects. Here,wefind a total weight loss of53.1%for the reference material GO1and50.6%for GO2obtained from graphite with fewer defects,see Fig.2A.The weight loss takes place in three temperature regions. Between RT and about120°C the weight loss is mostly attrib-uted to adsorbed water(m/z18).A further weight loss of18% is observed for GO1and GO2with a maximum at153and 169°C for GO1and GO2,respectively.GO2from graphite with fewer defects(grade3061)appears to be more stable,but 169°C are still a reasonable value for GO.There are other parameters,e.g.water content,that influences the decompo-sition temperature of GO in TGA experiments as we demon-strated recently[15].Mainly m/z18(H2O),m/z28(CO)and m/z44(CO2)are detected at this step.An additional weight loss of about15%and17%for GO1and GO2,respectively, was found between200and300°C.In addition to water,CO and CO2,m/z64(SO2)is detected that originates from sulfur species.Even excessive washing with water cannot com-pletely remove theses species.Qualitatively the amount of sulfur appears to be constant in GO1and GO2with4and 6%according to elemental analysis,respectively.At higher temperature up to800°C the carbon lattice decomposes and the detected weight loss is7.5and9.6%for GO1and GO2, respectively.From TGA-MS we conclude that GO1and GO2 were oxidized in almost the same way.This means that the degree of oxidation is identical with little differences in the stability and the water content.Next,we verified that func-tional groups are the same in GO1and GO2.FTIR spectra ex-hibit the same features as can be seen from Fig.2B.The origin of the vibrational absorption of functional groups in GO is still discussed[16].We assign the signals between3600and 3200cmÀ1to the O–H stretching vibration of free water,asso-ciated hydroxyl groups in GO and adsorbed water molecules. In both materials carbonyl signals at about1735cmÀ1and sig-nals that originate from adsorbed water at about1625cmÀ1 are found[17].The signals at about1415cmÀ1correspond to O–H deformation vibrations from carboxylic groups[18].A shoulder at1580cmÀ1can be assigned to double bonds[17]. Vibrations of C–O of different species mainly epoxy and hy-droxyl groups are present in the range of1300and800cmÀ1 and wefind distinct signals at about1270,1230,1050and 830cmÀ1.From FTIR we conclude that both materials are chemically almost identical,with little changes for the inten-sity of some signals,e.g.the signal at1050cmÀ1that might also originate from skeletal C–C vibrational modes[19].3668C A R B O N50(2012)3666–3673Finally,two weak signals at2924and2852cmÀ1are found in GO2only that might be due to methyl groups as it was found in methylated GO before[20].3.3.Characterization of GO and rGO by AFM and Raman spectroscopyFurthermore,we analyzed the size of the GOflakes(GO1,GO2) by AFM on Si/SiO2wafers.Theflakes of GO1(reference mate-rial)are shown in the Supplementary data and wefind small flakes with a diameter of approximately1l rgerflakes of about5l m are found in GO2,as can be seen from Fig.4A.In addition,we performed a Raman study of GO1and GO2in its oxidized and reduced form.To gain homogeneous Raman information as reference data we measured mean spectra of an area of100and400l m2for GO1and GO2,respectively (Fig.3).Generally,GO exhibits preserved graphene like regions (about1nm diameter)and distorted regions(several nm)be-neath defects(vacancies or additional atoms)due to the syn-thesis,known from HRTEM[21].The I D/I G ratio in Raman spectroscopy can be used to evaluate the distance between defects in graphene and for GO it is about1(532nm laser excitation)and increases with increasing mean distance be-tween two defects(L D)form1to about3nm(stage2)followed by a decrease(stage1,larger than3nm)[13,22].This relation is shown in Fig.4.We used this relation to characterize GO.In Fig.3,the main features of the GO Raman spectra are the D,G, 2D and D+D0peak.The D peak at about1330–1340cmÀ1that originates from the breathing modes of six-membered rings that are activated by defects and the G peak at1580–1600cmÀ1that is due to the E2g phonon at the Brillouin zone center.The2D peak at2700cmÀ1is the second order of the D peak and the D+D0peak at2940cmÀ1is due to the defect activated combination of phonons.The I D/I G ratio in GO1 (1.14)and GO2(1.19)are almost the same and the D+D0peak is higher in intensity than the2D peak,in both spectra(black, Fig.3A and B).Next,GO1was reduced by hydrazine hydrate vapor to yield rGO1.The Raman spectrum of rGO1(red, 100l m2)is shown in Fig.3A and only little changes can be ob-served for the I D/I G ratio.It changes from1.14to1.28that is related to the removal of functional groups and formation of defects.This observation is consistent with the literature [23].Now we studied singleflakes of GO2and rGO2and ana-lyzed them by AFM to prove that all subsequent Raman mea-surements are performed on single layers.The AFM images of GO2a–c are shown in Fig.5A.The thickness was determined to about1.2–1.5nm,neglecting the roughness of theflakes, as it is shown in the corresponding height profiles.The rough-ness is relatively high and we assume,this is due to adsorbed molecules and salts still present on the surface that could not be removed by the purification method and the processing. Theflakes were reduced by hydrazine hydrate vapor as de-scribed before.The sameflakes were analyzed by AFM and in comparison to GO2a,rGO2a has a mean height of about 0.8nm.Further,it is interesting to note that some wrinkles present in GO2a disappeared in rGO2a and especially someTGA-MS of GO1and GO2and the corresponding weight loss due to H2O,CO,CO2and SO2;(B)FTIR spectraedges folded on the rGO plane.The Raman spectrum of GO2 was already discussed above.Surprisingly,after the reduction of GO2a to rGO2a wefind an extremely high I D/I G ratio of2.7–2.8,what means that there is a mean distance of about2.5–3nm(compare Fig.3B,Fig.5)between two defects instead of about1nm as usually obtained for rGO.Besides,next to the G peak the D0peak at1612cmÀ1can be observed caused by a double resonance process.Further,the I2D is higher than the I D+D0in contrast to the pristine GO2material and rGO1.To quantify this effect we measured a Raman map of the sameflake(rGO2a)after reduction and wefind I D/I G ratios of ing that the D peak intensity remains almost the same for GO and rGO,respectively.Since the D peak is due to the defect in-duced breathing mode of six-membered rings we assume that the intensity remains almost constant,because there remain enough defects after reduction to activate almost the same amount of six-membered rings.These experiments further demonstrate that it is easily possible to tune the mean defect distances in rGO between1and about3nm.According to Canc¸ado et al.it is possible to distinguish be-tween stage2and stage1region by analyzing Raman spectra in terms of the full width at half-maximum(FWHM)[22,27]. This is necessary because an I D/I G ratio of2.8can correlate(A)Raman spectra of GO1(black)and rGO1(red);spectra of GO2(black)and rGO2(red).(For interpretation of reference to colors in thisfigure legend, is referred to the web version of this article.)I D/I G ratio vs.distance between two defects(laser excitation(maximum I D/I G ratio3.1).AFM images of GO2a-c and height profiles;(B)AFM images of rGO2a-c and height profiles;(C)Raman plotted I D/I G ratio of rGO2a(pristine rGO2),rGO2b(5s laser pulse with D2filter at0.06mW),rGO2c(5s at1.94mW),from(left to right);(D)corresponding Raman spectra(532nm)of rGO2a,rGO2b–c(middleillustrated in B).to mean defect distances of about2.5or4nm whether the material is stage2or stage1(Fig.4).Therefore,we performed high accuracy Raman spectroscopy in the region1000–2000cmÀ1checking the calibration(G peak of graphite at 1580cmÀ1)before and after each measurement.The results are summarized in Table1.The I D/I G ratio was found to be 2.8for rGO2a(see Supplementary data).Further,the D peak position is1337cmÀ1(532nm)and1327cmÀ1(633nm)that of the G peak is1588cmÀ1and does not shift by altering the laser wavelength(see Supplementary data),typical for defec-tive graphene[22].We furtherfind that the FWHM of the D peak and G peak are42and39cmÀ1,respectively,and thus typical for stage2region.For stage1region a FWHM of about 20and14cmÀ1would be expected,respectively[22].The analysis was also done for the middle region and loop region of rGO2c.In this example it is possible to make accurate Ra-man analysis on the sameflake that exhibits a middle region and loop region and the G peak position shifts from1597to 1591cmÀ1in the loop region.Besides,the FWHM of the D peak gets sharper from81to56cmÀ1(see Supplementary data).All these data support the laser induced defect genera-tion in the middle region of rGO2c and underlines the lower defect density in rGO2a that is close to the transition to stage 1region.4.ConclusionsWe demonstrated that GO with fewer defects can be obtained from graphite using Hummer’s method.Besides large grain size,defects are almost absent in the starting material.Fur-thermore,we found that Raman spectroscopy cannot distin-guish between different GO qualities.FTIR spectroscopy and TGA-MS show little differences also.Thus,the material must be reduced to rGO to determine the distance between defects by Raman spectroscopy utilizing the I D/I G ratio.We performed that study on singleflakes of GO,rGO and laser structured GO, followed by reduction to visualize the different defect densi-ties in rGO on the sameflake for best comparison.In contrast to control experiments on rGO prepared from ordinary graph-ite we found an I D/I G ratio of2.8instead of1.3.We conclude that the graphite grade is mostly responsible for the lower de-fects generated in GO and rGO,respectively,what can be probed by measuring the electrical bulk conductivity on graphene pellets.Further we found that rGO with an I D/I G ra-tio of2.8is still defective and the Raman spectra correspond to stage2region.We proved that by analyzing Raman peak positions and FWHMs of the G and D peak.Besides,we found the FWHM of the G peak decreases from50to39cmÀ1and the FWHM for the D peak from81to50cmÀ1,what clearly dem-onstrates the increasing quality.Moreover,we conclude that the model of the I D/I G ratio that is derived from Ar-ion bom-bardment on graphene is generally valid for rGO also.These investigations demonstrate that rGO with tuneable defect densities can be prepared what will make electronic applica-tions feasible.Obviously,rGO with fewer defects will also be a stronger material and improve mechanical properties of com-posite materials.AcknowledgmentsThe authors thank the Deutsche Forschungsgemeinschaft (DFG-SFB953,Project A1‘‘Synthetic Carbon Allotropes’’), the European Research Council(ERC;grant246622-GRAPHE-NOCHEM),and the Cluster of Excellence‘Engineering of Advanced Materials(EAM)’forfinancial support.Appendix A.Supplementary dataSupplementary data associated with this article can be found, in the online version,at doi:10.1016/j.carbon.2012.03.039.R E F E R E N C E S[1]Bolotin KI,Sikes KJ,Jiang Z,Klima M,Fudenberg G,Hone J,et al.Ultrahigh electron mobility in suspended graphene.Solid State Commun2008;146(9–10):351–5.[2]Chen JH,Jang C,Xiao S,Ishigami M,Fuhrer MS.Intrinsic andextrinsic performance limits of graphene devices on SiO2.Nat Nanotech2008;3(4):206–9.[3]Hecht DS,Hu L,Irvin G.Emerging transparent electrodesbased on thinfilms of carbon nanotubes,graphene,andmetallic nanostructures.Adv Mater2011;23(13):1482–513. [4]Backes C,Hauke F,Hirsch A.The potential of perylenebisimide derivatives for the solubilization of carbonnanotubes and graphene.Adv Mater2011;23(22–23):2588–601.[5]Englert JM,Dotzer C,Yang G,Schmid M,Papp C,Gottfried JM,et al.Covalent bulk functionalization of graphene.Nat Chem 2011;3(4):279–86.[6]Kozhemyakina NV,Englert JM,Yang G,Spiecker E,SchmidtCD,Hauke F,et al.Non-covalent chemistry of graphene:electronic communication with dendronized perylenebisimides.Adv Mater2010;22(48):5483–7.[7]Zhu Y,Cai W,Piner RD,Velamakanni A,Ruoff RS.Transparentself-assembledfilms of reduced graphene oxide platelets.Appl Phys Lett2009;95(10):103104.[8]Bai H,Li C,Shi G.Functional composite materials based onchemically converted graphene.Adv Mater2011;23(9):1089–115.[9]Eda G,Ball J,Mattevi C,Acik M,Artiglia L,Granozzi G,et al.Partially oxidized graphene as a precursor to graphene.JMater Chem2011;21(30):11217–23.1rGO2a rGO2c middle rGO2c loop D peak(cmÀ1)133713371337D peak FWHM(cmÀ1)428156G peak(cmÀ1)158815911597G peak FWHM(cmÀ1)395044I D/I G 2.8 1.3 1.9 3672C A R B O N50(2012)3666–3673[10]Yamaguchi H,Eda G,Mattevi C,Kim H,Chhowalla M.Highlyuniform300mm wafer-scale deposition of single andmultilayered chemically derived graphene thinfilms.ACSNano2010;4(1):524–8.[11]Xu Y,Sheng K,Li C,Shi G.Highly conductive chemicallyconverted graphene prepared from mildly oxidized graphene oxide.J Mater Chem2011;21(20):7376–80.[12]Botas C,A´lvarez P,Blanco C,Santamarı´a R,Granda M,Ares P,et al.The effect of the parent graphite on the structure ofgraphene oxide.Carbon2012;50(1):275–82.[13]Lucchese MM,Stavale F,Ferreira EHM,Vilani C,MoutinhoMVO,Capaz RB,et al.Quantifying ion-induced defects and Raman relaxation length in graphene.Carbon2010;48:1592–7.[14]William S,Hummers J,Offeman RE.Preparation of graphiticoxide.J Am Chem Soc1958;80(6):1339.[15]Eigler S,Dotzer C,Hirsch A,Enzelberger M,Mu¨ller P.Formation and Decomposition of CO2Intercalated Graphene Oxide.Chem Mater,/10.1021/cm203223z. [16]Acik M,Mattevi C,Gong C,Lee G,Cho K,Chhowalla M,et al.The role of intercalated water in multilayered grapheneoxide.ACS Nano2010;4(10):5861–8.[17]Hontoria-Lucas C,Lo´pez-Peinando AJ,Lo´pez-Gonza´lez JDD,Rojas-Cervantes ML,Martı´n-Aranda RM.Study of oxygen-containing groups in a series of graphite oxides:physical and chemical characterization.Carbon1995;33(11):1585–92. [18]Stankovich S,Piner RD,Nguyen ST,Ruoff RS.Synthesis andexfoliation of isocyanate-treated graphene oxidenanoplatelets.Carbon2006;44(15):3342–7.[19]Szabo´T,Berkesi O,De´ka´ny I.DRIFT study of deuterium-exchanged graphite oxide.Carbon2005;43(15):3186–9. [20]Scholz W,Boehm HP.Betrachtungen zur Struktur desgraphitoxids.Z Anorg Allg Chem1969;369(3–6):327–40. [21]Erickson K,Erni R,Lee Z,Alem N,Gannett W,Zettl A.Determination of the local chemical structure of graphene oxide and reduced graphene oxide.Adv Mater2010;22(40):4467–72.[22]Canc¸ado LG,Jorio A,Ferreira EHM,Stavale F,Achete CA,Capaz RB et al.Quantifying defects in graphene via Raman spectroscopy at different excitation energies.Nano Lett2011;11(8):3190–6.[23]Moon IK,Lee J,Ruoff RS,Lee H.Reduced graphene oxide bychemical graphitization.Nat Commun2010(6):1:73http://dx.doi:10.1038/ncomms67.[24]Cui P,Lee J,Hwang E,Lee H.One-pot reduction of grapheneoxide at subzero temperatures.Chem Commun2011;47(45):12370–2.[25]Pei S,Zhao J,Du J,Ren W,Cheng H-M.Direct reduction ofgraphene oxidefilms into highly conductive andflexiblegraphenefilms by hydrohalic acids.Carbon.2010;48(15):4466–74.[26]Gao X,Jang J,Nagase S.Hydrazine and thermal reduction ofgraphene oxide:reaction mechanisms,product structures, and reaction design.J Phys Chem C2010;114(2):832–42. [27]Ferrari AC,Robertson J.Interpretation of Raman spectra ofdisordered and amorphous carbon.Phys Rev B2000;61(20):14095–107.C A R B O N50(2012)3666–36733673。