地图,流程图的英文表述
各种图表的英文表达
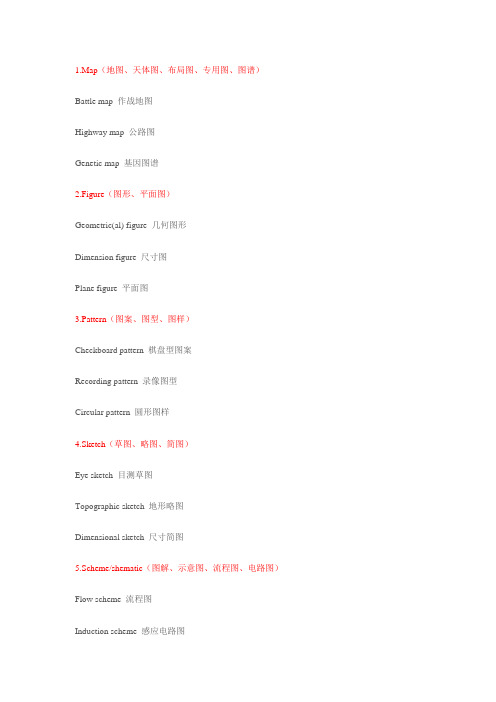
1.Map(地图、天体图、布局图、专用图、图谱)Battle map 作战地图Highway map 公路图Genetic map 基因图谱2.Figure(图形、平面图)Geometric(al) figure 几何图形Dimension figure 尺寸图Plane figure 平面图3.Pattern(图案、图型、图样)Checkboard pattern 棋盘型图案Recording pattern 录像图型Circular pattern 圆形图样4.Sketch(草图、略图、简图)Eye sketch 目测草图Topographic sketch 地形略图Dimensional sketch 尺寸简图5.Scheme/shematic(图解、示意图、流程图、电路图)Flow scheme 流程图Induction scheme 感应电路图6.Draft(草图)Chisel draft 雕刻前在石头上画出边缘轮廓草图7.Curve(曲线图表)Algebraic curve 代数曲线Comfort curve 湿度舒适曲线8.Graph(曲线图表)Funtional graph 函数图(亦称plot)Bar graph 条形图(也称chart)9.View(视图)Plane view 平面视图10.Geometry(几何图)Plane geometry 平面几何Solid geometry 立体几何图11.Chart(航海图、图表)Aeronautical chart 领航图Demographic data chart 人口统计图表Pie chart 饼图Bar chart 柱图12.Drawing(工程图、插图)Drawing 建筑图Explanatory drawing 说明(插)图yout(布局图、规划图)。
流程图 英语

流程图英语FlowchartA flowchart is a visual representation of a process or workflow, using different shapes and arrows to illustrate the sequence of steps and decision points involved. It is commonly used in various industries and disciplines to analyze, design, and improve processes.There are several key symbols used in flowcharts:1. Start/End Symbol: This is represented by an ellipse and indicates the beginning and end of the process or workflow.2. Process Symbol: This is represented by a rectangle and represents an operation or activity that takes place within the process.3. Decision Symbol: This is represented by a diamond shape and represents a point where a decision needs to be made. Depending on the answer to the decision, the flowchart will follow different paths.4. Input/Output Symbol: This is represented by a parallelogram and represents an input or output to/from the process. It could be information, data, or material.5. Connector Symbol: This is represented by a circle or circle witha plus sign. It is used to connect different parts of the flowchart that are located on different pages or sheets.Here is an example of a flowchart illustrating a purchasing process: Start⇓Receive purchase request⇓Is the item in stock?⇓Yes: Proceed to the next stepNo: Order the item⇓Receive the item⇓Is the item as expected?⇓Yes: Proceed to the next stepNo: Return the item⇓Deliver the item to requester⇓EndIn this example, the flowchart starts with receiving a purchase request. The next step is to check if the item is in stock. If the item is in stock, it proceeds to the next step. If not, the flowchart moves to the step of ordering the item. Once the item is received, a check is done to see if the item is as expected. If it is as expected, the flowchart proceeds to the next step of delivering the item to the requester. If the item is not as expected, the flowchart moves to thestep of returning the item.This flowchart provides a clear and visual representation of the steps and decision points involved in the purchasing process. It helps to identify potential bottlenecks, areas for improvement, and ensures consistent and efficient execution of the process.In conclusion, a flowchart is a powerful tool for analyzing and improving processes. It provides a visual representation of the steps, decision points, and input/output involved in a process or workflow. By using different shapes and arrows, it helps to illustrate the sequence and flow of the process, making it easier to understand and improve.。
流程图 英文

流程图英文A flowchart, also called a process flow diagram, is a visual representation of a series of steps or actions that must be taken to complete a specific task or process. It is a powerful tool that allows individuals to understand and communicate complex procedures in a clear and concise manner. In this article, we will explore the key elements and benefits of using flowcharts, as well as provide step-by-step instructions on how to create one.Key Elements of a Flowchart:1. Start/End point: The flowchart begins with a designated start point, which is usually represented by a small oval shape. Similarly, the flowchart ends with an end point, often depicted as a larger oval shape. These points indicate the beginning and conclusion of the process or task.2. Process or Action: The main steps or actions required to complete the process are represented by rectangles or squares. Each rectangle typically contains a brief description of the action. The action sequences are connected together by arrows, indicating the flow of the process.3. Decision point: Decision points are represented by a diamond shape. These points occur when a choice or decision needs to be made, leading to different paths or actions within the flowchart. Each decision point is labeled with a question to help guide the decision-making process.4. Connector/Off-page connector: Connectors are used to linkdifferent parts of the flowchart, allowing for a more organized and understandable representation of the process. Off-page connectors are used when a flowchart becomes too large to fit on a single page and needs to continue on another page.Benefits of Using Flowcharts:1. Simplifies complex processes: Flowcharts provide a simplified visual representation of complex processes, making it easier for individuals to understand the sequence of actions required to complete a task.2. Enhances communication: Flowcharts serve as a visual tool to communicate procedures and processes among team members, stakeholders, and clients. This enhances communication and ensures everyone is on the same page.3. Identifies bottlenecks and inefficiencies: By mapping out a process in a flowchart, it becomes easier to identify areas of the process that may be causing bottlenecks or inefficiencies. This allows for targeted improvements and optimization.4. Facilitates troubleshooting and problem-solving: Flowcharts are invaluable when it comes to troubleshooting and problem-solving. By visually representing the process, it becomes easier to identify and address any issues or errors.Creating a Flowchart:1. Identify the process: Start by clearly defining the process or taskyou want to depict in the flowchart.2. Determine the main steps: Break down the process into its main steps or actions. Write down a brief description of each step.3. Sequence the steps: Determine the sequence in which the steps need to be performed. Connect the steps together using arrows to indicate the flow.4. Add decision points: Identify any decision points within the process where choices need to be made. Use diamond shapes to represent these decision points, with the choices labeled accordingly.5. Review and revise: Step back and review the flowchart to ensure it accurately represents the process. Make any necessary revisions to improve clarity and accuracy.6. Use flowchart software: Utilize flowchart software or online tools to create a professional-looking flowchart. This will allow for easy editing, sharing, and collaboration with others.In conclusion, flowcharts are an effective visual tool that can be used to simplify complex processes, enhance communication, identify inefficiencies, and facilitate troubleshooting. By following the step-by-step instructions outlined in this article, you will be able to create an informative and visually appealing flowchart to communicate and streamline your processes.。
流程图详解-process mapping
Moisture content 水分
(Manufacturing) 制造
Method/Standard work 方法标准工作 Sequencing of Steps 步骤的次序 Fixtures 夹具 # of associates 员工数 Position of components 部件的位置
Tooling 工装 Gages/Quality Checks 量具/质量检查 Speeds/Feeds 速度 / 进料 OP Sheets 操作单
On Time Delivery to Customer 按时交货
% Regrind 回收料百分数
Manufacturing Injection Molded Parts Process 塑料成形加工 过程
13
Having The “Right” Amount Of Detail To Identify The Issues Is Essential
I can’t find the issue in all this detail!
Input
Process
Output
Well we can see the issue is the process, but where?
Place order on hold until product available
Expedite manufacturing schedule
Process maps need to be modified to fit the particular needs of any specific process.流程图应根据不同的需要进行调整
Warehousing
Is Product Available? No Yes Pick product for order
雅思小作文_地图流程图
• The supermarket is directly opposite to the bus stop.(在……的正对面)
• The barber’s is in close proximity to/ near by/ by the side of the hospital.(在……附近)
• The shop is along the roadside.(在路边)
• Chorleywood is a village near London whose population has increased steadily since the middle of the nineteenth century. The map below shows the development of the village.
P4
• Overall, neither site is appropriate for all the towns, but for customers in Cransdon, Hindon and Garlsdon, the out-of-town site (S1) would probably offer more advantages.
• Houses are at the bottom of the residential zone.(在……底部)
• The supermarket is halfway between the bank and the barber’s.(在……半途中)
• The motorcyclist is outside the residential zone.(在……外面)
雅思小作文-地图流程图
Chronologically, during the first 15 years from 1868 to 1883, Chorleywood was merely a very small village with one main road to its west. From 1883 to 1922, we see that the village expanded to south, almost tripled the original scale.
先描述S1地理位置,再写其空间优势
01
02
In contrast, the suggested location, S2, is right in the town centre, which would be good for local residents. Theoretically, the store could be accessed by road or rail from the surrounding towns, including Bransdon, but as the central area is a no-traffic zone, cars would be unable to park and access would be difficult.
各类图表英文描述
:(地图、天体图、布局图、专用图、图谱)Battle map 作战地图Highway map 公路图Genetic map 基因图谱(图形、平面图)Geometric(al) figure 几何图形Dimension figure 尺寸图Plane figure 平面图)(图案、图型、图样)Checkboard pattern 棋盘型图案Recording pattern 录像图型Circular pattern 圆形图样(草图、略图、简图)Eye sketch 目测草图Topographic sketch 地形略图Dimensional sketch 尺寸简图&shematic(图解、示意图、流程图、电路图)Flow scheme 流程图Induction scheme 感应电路图(草图)Chisel draft 雕刻前在石头上画出边缘轮廓草图(曲线图表)Algebraic curve 代数曲线Comfort curve 湿度舒适曲线《(曲线图表)Funtional graph 函数图(亦称plot)Bar graph 条形图(也称chart)(视图)Plane view 平面视图(几何图)Plane geometry 平面几何Solid geometry 立体几何图<(航海图、图表)Aeronautical chart 领航图Demographic data chart 人口统计图表Pie chart 饼图Bar chart 柱图(工程图、插图)Drawing 建筑图Explanatory drawing 说明(插)图*(布局图、规划图)1、图形种类及概述法:泛指一份数据图表:a data graph(曲线图)/chart/diagram/illustration/table饼图:pie chart直方图或柱形图:bar chart/histogram趋势曲线图:line chart/curve diagram、表格图:table流程图或过程图:flow chart/sequence diagram程序图:processing/procedures diagram2、常用的描述用法The table/chart diagram/graph shows (that)According to the table/chart diagram/graphAs (is) shown in the table/chart diagram/graphAs can be seen from the table/chart/diagram/graph/figures,;figures/statistics shows (that)……It can be seen from the figures/statisticsWe can see from the figures/statisticsIt is clear from the figures/statisticsIt is apparent from the figures/statisticstable/chart/diagram/graph figures (that)……table/chart/diagram/graph shows/describes/illustrates3、图表中的数据(Data)具体表达法《数据(Data)在某一个时间段固定不变:fixed in time在一系列的时间段中转变:changes over time持续变化的data在不同情况下:增加:increase/raise/rise/go up ……减少:decrease/grow down/drop/fall ……波动:fluctuate/rebound/undulate/wave ……稳定:remain stable/stabilize/level off ……}二、相关常用词组1、主章开头图表类型:table(表格)、chart(图表)、diagram(图标)、graph(多指曲线图)、column chart(柱状图)、pie graph(饼图)、tree diagram(树形图)描述:show、describe、illustrate、can be seen from、clear、apparent、reveal、represent 内容:figure、statistic、number、percentage、proportion2、表示数据变化的单词或者词组rapid/rapidly 迅速的,飞快的,险峻的dramatic/dramatically 戏剧性的,生动的/significant/significantly 有意义的,重大的,重要的sharp/sharply 锐利的,明显的,急剧的steep/steeply 急剧升降的steady/steadily 稳固的,坚定不移的gradual/gradually 渐进的,逐渐的slow/slowly 缓慢的,不活跃的slight/slightly 稍微的、略微地stable/stably 稳定的,3、其它在描述中的常用到的词significant changes 图中一些较大变化noticeable trend 明显趋势during the same period 在同一时期grow/grew 增长distribute 分布unequally 不相等地in the case of 在……的情况下【in terms of/in respect of/regarding 在……方面in contrast 相反,大不相同government policy 政府政策market forces 市场力量measuren n.尺寸,方法,措施v.估量,调节forecast n.先见,预见v.猜测?三、图表描述套句精选table shows the changes in the number of……over the period from……to……该表格描述了在……年之……年间……数量的变化。
流程图、地图
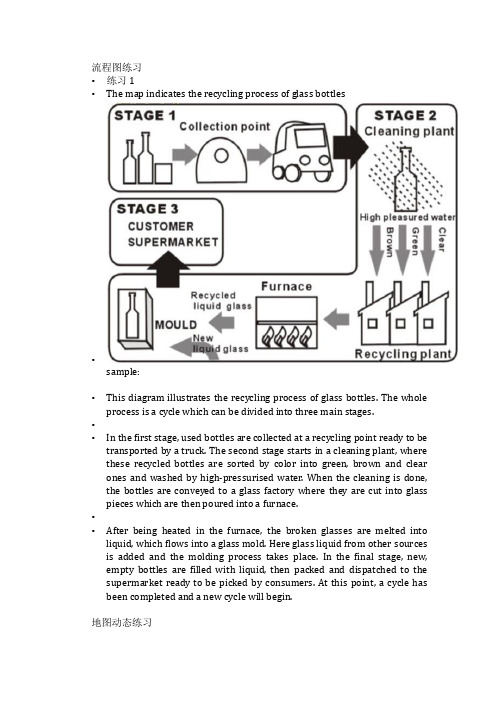
流程图练习•练习1•The map indicates the recycling process of glass bottles•sample:•This diagram illustrates the recycling process of glass bottles. The whole process is a cycle which can be divided into three main stages.••In the first stage, used bottles are collected at a recycling point ready to be transported by a truck. The second stage starts in a cleaning plant, where these recycled bottles are sorted by color into green, brown and clear ones and washed by high-pressurised water. When the cleaning is done, the bottles are conveyed to a glass factory where they are cut into glass pieces which are then poured into a furnace.••After being heated in the furnace, the broken glasses are melted into liquid, which flows into a glass mold. Here glass liquid from other sources is added and the molding process takes place. In the final stage, new, empty bottles are filled with liquid, then packed and dispatched to the supermarket ready to be picked by consumers. At this point, a cycle has been completed and a new cycle will begin.地图动态练习•练习•Chorleywood is a village near London whose population has increased steadily since the middle of the nineteenth century. The map below shows the development of the village.•Write a report for a university lecturer describing the development of the village.•发展型•The map shows the changes and development of Chorleywood village in Great Britain over a period of 126 years from 1868 to 1994.•Chronologically, during the first 15 years from 1868 to 1883, Chorleywood was merely a very small village with one main road to its west. From 1883 to 1922, we see that the village expanded to the south, almost tripled the original scale.•Besides, a railway line was built across the new area from west to east and there emerged the Chorleywood Station. During 1922-1970, Chorleywood extended both eastward and westward and almost doubled the previous size.•Then during 1970-1994, the village accelerated its pace of development eastward. A north-south motorway was built in 1970 as the axis, with the almost paralleled east-west main road and railway as two dividing lines,cutting this new area into five parts. This new expansion was almost twice the scale of the old village. The Chorleywood Park and a golf course separated the old and new area.•Thus, we see the fast expansion history of this small village across a span of over 100 years.地图动态词汇重点词汇和句型(1)某处兴建了AA is built inA is constructed inA is established in(2)某处增建了AA is added to…An addition is made to …, which is A(3)A被B替代/A改造成BA is turned into/is transformed into BA is converted into B(4)A被搬走A is removed/demolished from…(5)A的面积缩小了/A的面积扩大了The size of A is reduced to (only half of/one third of the original size)A is expanded (to twice its size)=The size of A almost doubled。
- 1、下载文档前请自行甄别文档内容的完整性,平台不提供额外的编辑、内容补充、找答案等附加服务。
- 2、"仅部分预览"的文档,不可在线预览部分如存在完整性等问题,可反馈申请退款(可完整预览的文档不适用该条件!)。
- 3、如文档侵犯您的权益,请联系客服反馈,我们会尽快为您处理(人工客服工作时间:9:00-18:30)。
The bank is in the top left-hand corner of the residential zone.(在……的左上角)
The playground is roughly in the middle of the residential zone.(大概在……的中间)
140 years later, the number of homes more than doubled to 500, but farms and woods completely disappeared. In their places, several school buildings and sports facilities were constructed at the south-eastern corner of the village, which were connected with the residential areas in the north via a newly-build road. Some shops opened up along the river bank and a large stretch of wetland for birds was established at the southern end of the river.
In 1780, Kelsby had only 100 homes. There was a large expanse of woods in the eastern part of the village and four plots of farmland in the centre. In the west was a river flowing from north to south.
The supermarket is halfway between the bank and the barber’s.(在……半途中)
The motorcyclist is outside the residential zone.(在……外面)
The shop is along the roadside.(在路边)
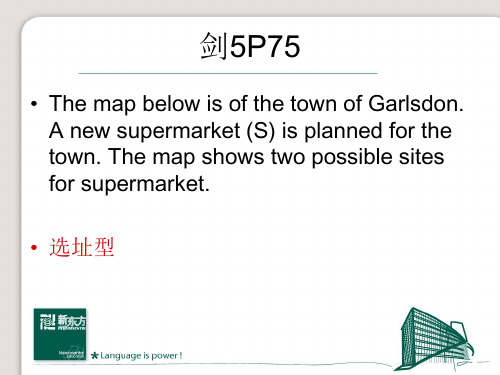
The map below is of the town of Garlsdon. A new supermarket (S) is planned for the town. The map shows two possible sites for supermarket.
交 通 不 利
The map shows two proposed locations for a new supermarket for the town of Garlsdon.
A位于B的范围内 ,如A位于B的东部地区 Shanghai is in the east of China A在B以东,即A位于B以东 Japan is to the east of China A在B以东,并且接壤
Tianjin is on the east of Hebei A在B 西北部的120 千米处
converted/changed/turned over to/ into B A is replaced /substituted by B = A gives way
to B
三格地图题
1. 时态 2. 顺序 时间顺序+空间顺序 3. 大家来找茬
The three maps illustrate how the village of Kelsby changed in 1780, 1860 and 2000.
The first potential location (S1) is outside the town itself, and is sited just off the main road to the town of Hindon, lying 12 kms to the north-west.This site is in the countryside and so would be able to accommodate a lot of car parking. This would make it accessible to shoppers from both Hindon and Garlsdon who could travel by car.
The year 1860 saw a doubling of the number of homes, but the size of farmland and woods was halved. In the same year, a bridge was constructed over the river and a road was paved linking the river to the residences.
A lies 120 km to the northwest of B
Mountains are parallel to the rivers.(与…… 平行)
The truck is to the right of the gas station. (在……的右边)
The church is surrounded by trees.(被…… 包围)
原有事物尺寸上变大/变小: The size of the library has been enlarged/extended/reduced by half
原有事物没了:
The farms cooved.
原有事物被改为: A is transformed/reconstructed/
The supermarket is directly opposite to the bus stop.(在……的正对面)
The barber’s is in close proximity to/ near by/ by the side of the hospital.(在…… 附近)
Houses are at the bottom of the residential zone.(在……底部)