Spatial Correlations of Mobility and Immobility in a Glassforming Lennard-Jones Liquid
城市结构与出行特征文献汇编
汇编目录第一编1.Ewing,R.,and Cervero,R.(2010).Travel and the built environment:a meta-analysis.Journal of the American Planning Association,76(3),265-294.2.Ewing,R.,and Cervero,R.(2001).Travel and the built environment:a synthesis.Transportation Research Record:Journal of the Transportation Research Board, 1780(1),87-114.3.Cervero,R.,and Kockelman,K.(1997).Travel demand and the3Ds:density,diversity,and design.Transportation Research Part D:Transport and Environment,2(3), 199-219.4.Cervero,R.,and Duncan,M.(2006).'Which Reduces Vehicle Travel More:Jobs-Housing Balance or Retail-Housing Mixing?.Journal of the American Planning Association,72(4),475-490.5.Cervero,R.,and Wu,K.L.(1998).Sub-centring and commuting:evidence from theSan Francisco Bay area,1980-90.Urban studies,35(7),1059-1076.6.Krizek,K.J.(2003).Residential relocation and changes in urban travel:doesneighborhood-scale urban form matter?.Journal of the American Planning Association,69(3),265-281.7.Handy,S.L.,Boarnet,M.G.,Ewing,R.,and Killingsworth,R.E.(2002).How the builtenvironment affects physical activity:views from urban planning.American journal of preventive medicine,23(2),64-73.8.Handy,S.,Cao,X.,and Mokhtarian,P.(2005).Correlation or causality between thebuilt environment and travel behavior?Evidence from Northern California.Transportation Research Part D:Transport and Environment,10(6),427-444.9.Handy,S.L.,and Clifton,K.J.(2001).Local shopping as a strategy for reducingautomobile travel.Transportation,28(4),317-346.10.Zhang,L.,Hong,J.H.,Nasri,A.,and Shen,Q.(2012).How built environment affectstravel behavior:A comparative analysis of the connections between land use and vehicle miles traveled in US cities.Journal of Transport and Land Use,5(3),40-52. 11.Saelens,B.E.,Sallis,J.F.,and Frank,L.D.(2003).Environmental correlates of walkingand cycling:findings from the transportation,urban design,and planning literatures.Annals of behavioral medicine,25(2),80-91.12.Limtanakool,N.,Dijst,M.,and Schwanen,T.(2006).The influence of socioeconomiccharacteristics,land use and travel time considerations on mode choice for medium-and longer-distance trips.Journal of transport geography,14(5),327-341.13.Chen,Y.P.,Song,Y.,Zhang,Y.,PENG,K.,Zhang,Q.,and Jin,X.(2011).Impact of landuse development on travel mode choice:a case study in shenzhen.Urban Transport of China,9(5),80-85.陈燕萍,宋彦,张毅,等.城市土地利用特征对居民出行方式的影响——以深圳市为例[J].城市交通,2011,9(5):80-85.14.Cervero,R.(1989).Jobs-housing balancing and regional mobility.Journal of theAmerican Planning Association,55(2),136-150.15.Transit and Urban Form.Volume1.PART I Transit,Urban Form,and the BuiltEnvironment:A Summary of Knowledge.第二编1.Chatman,D.G.(2013).Does TOD need the T?On the importance of factors otherthan rail access.Journal of the American Planning Association,79(1),17-31.2.Song,Y.,and Knaap,G.J.(2004).Measuring urban form:is Portland winning the waron sprawl?.Journal of the American Planning Association,70(2),210-225.3.Ewing,R.(1997).Is Los Angeles-style sprawl desirable?.Journal of the Americanplanning association,63(1),107-126.4.Cervero,R.,and Murakami,J.(2010).Effects of built environments on vehicle milestraveled:evidence from370US urbanized areas.Environment and Planning A,42(2), 400-418.5.Badland,H.,and Schofield,G.(2005).Transport,urban design,and physical activity:an evidence-based update.Transportation Research Part D:Transport and Environment,10(3),177-196.6.Lin,J.J.,and Yang,A.T.(2009).Structural analysis of how urban form impacts traveldemand:Evidence from Taipei.Urban Studies,46(9),1951-1967.7.Zhao,P.(2011).Car use,commuting and urban form in a rapidly growing city:evidence from Beijing.Transportation planning and technology,34(6),509-527.8.Zhao,P.,Lü,B.,and de Roo,G.(2010).Urban expansion and transportation:theimpact of urban form on commuting patterns on the city fringe of Beijing.Environment and planning.A,42(10),2467-2486.9.Yang,J.,Shen,Q.,Shen,J.,and He,C.(2012).Transport impacts of clustereddevelopment in Beijing:Compact development versus overconcentration.Urban Studies,49(6),1315-1331.10.Ma,K.R.,and Banister, D.(2007).Urban spatial change and excesscommuting.Environment and Planning A,39(3),630-646.11.Horner,M.W.(2007).A multi-scale analysis of urban form and commuting change ina small metropolitan area(1990–2000).The Annals of Regional Science,41(2),315-332.12.Shen,Q.(1998).Location characteristics of inner-city neighborhoods andemployment accessibility of low-wage workers.Environment and planning B: Planning and Design,25(3),345-365.沈青,张岩,张峰.内城区的区位特征与低收入者的就业可达性[J].国际城市规划, 2007,22(2):26-35.13.Levine,J.,Grengs,J.,Shen,Q.,and Shen,Q.(2012).Does Accessibility Require Densityor Speed?A Comparison of Fast Versus Close in Getting Where You Want to Go in US Metropolitan Regions.Journal of the American Planning Association,78(2),157-172.14.Shen,Q.(2000).Spatial and social dimensions of commuting.Journal of theAmerican Planning Association,66(1),68-82.15.Sanchez,T.W.(1999).The connection between public transit and employment:thecases of Portland and Atlanta.Journal of the American Planning Association,65(3), 284-296.16.Kawabata,M.,and Shen,Q.(2007).Commuting inequality between cars and publictransit:The case of the San Francisco Bay Area,1990-2000.Urban Studies,44(9), 1759-1780.17.Yang,J.(2005).Commuting impacts of spatial decentralization:A comparison ofAtlanta and Boston.Journal of Regional Analysis and Policy,35(1),69-78.18.Zhou J.,Chen X.,and Huang W.(2013).Jobs-housing balance and commute efficiencyin cities of central and western China:a case study of Xi’an.Journal of Geographical Science,68(10),1316-1330.19.Zhou,J.,Wang,Y.,and Schweitzer,L.(2012).Jobs/housing balance andemployer-based travel demand management program returns to scale:Evidence from Los Angeles.Transport Policy,20,22-35.周江评,陈晓键,黄伟,等.中国中西部大城市的职住平衡与通勤效率——以西安为例[J].地理学报,2013,68(010):1316-1330.20.Zhao H.,Yang K.,Wei H.,and Zhao W.(2013).Job-housing space restructuring andevolution of commuting patterns in Beijing metropolian area.City Planning Review, 37(8),33-39.赵晖,杨开忠,魏海涛,等.北京城市职住空间重构及其通勤模式演化研究[J].城市规划,2013,37(8):33-39.第三编1.Boarnet,M.G.(2011).A broader context for land use and travel behavior,and aresearch agenda.Journal of the American Planning Association,77(3),197-213.2.Crane,R.(2000).The influence of urban form on travel:an interpretivereview.Journal of Planning Literature,15(1),3-23.3.Boarnet,M.G.,and Sarmiento,S.(1998).Can land-use policy really affect travelbehaviour?A study of the link between non-work travel and land-use characteristics.Urban Studies,35(7),1155-1169.4.Pan,H.,Shen,Q.,and Zhang,M.(2009).Influence of urban form on travel behaviourin four neighbourhoods of Shanghai.Urban Studies,46(2),275-294.潘海啸,沈青,张明.城市形态对居民出行的影响——上海实例研究[J].城市交通, 2009,7(6):28-32.5.Zhao,P.(2014).The impact of the built environment on bicycle commuting:Evidence from Beijing.Urban studies,51(5),1019-1037.6.Joh,K.,Nguyen,M.T.,and Boarnet,M.G.(2012).Can built and social environmentalfactors encourage walking among individuals with negative walking attitudes?.Journal of Planning Education and Research,32(2),219-236.7.Chatman,D.G.(2009).Residential choice,the built environment,and nonwork travel:evidence using new data and methods.Environment and planning.A,41(5), 1072-1089.8.Dieleman, F.M.,Dijst,M.,and Burghouwt,G.(2002).Urban form and travelbehaviour:micro-level household attributes and residential context.Urban Studies, 39(3),507-527.9.Joh,K.,Boarnet,M.G.,Nguyen,M.T.,Fulton,W.,Siembab,W.,and Weaver,S.(2008).Accessibility,travel behavior,and new urbanism:case study of mixed-use centers and auto-oriented corridors in the South Bay Region of Los Angeles,California.Transportation Research Record:Journal of the Transportation Research Board, 2082(1),81-89.10.Zolnik,E.J.(2011).The effect of sprawl on private-vehicle commuting outcomes.Environment and Planning-Part A,43(8),1875-1893.11.Meurs,H.,and Haaijer,R.(2001).Spatial structure and mobility.TransportationResearch Part D:Transport and Environment,6(6),429-446.。
【2009】SPATIAL DIVERSITY AND SPATIAL CORRELATION EVALUATION OF MEASURED
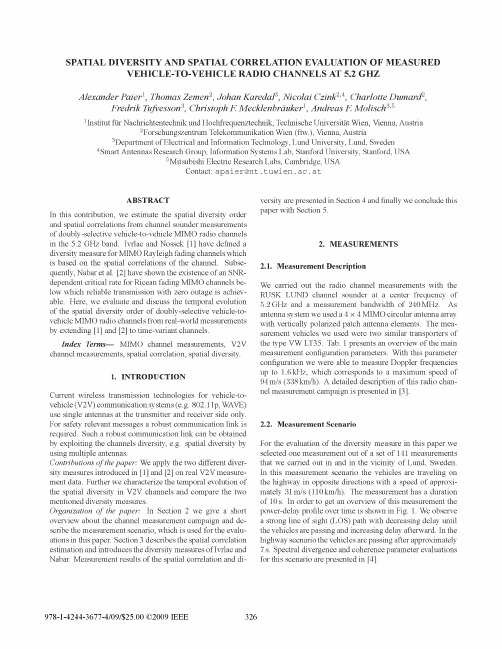
Alexander Paier1, Thomas Zemen2, Johan Karedal3, Nicolai Czink24, Charlotte Dumard2, Fredrik Tufvesson3, Christoph F Mecklenbrdiuker1, Andreas F Molisch3,5
3.1. Spatial Colr
relationtl Estimationa
Ig{h[n, k1hH[n, kl}
Centerurequencyadwdh BW524 GHfz 240 MHz
f
The correlation between the random entries of H[n, k] can be described by the correlation matrix
ABSTRACT
versity are presented in Section 4 and finally we conclude this
paper with Section 5
2. MEASUREMENTS
In this contribution, we estimate the spatial diversity order and spatial correlations from channel sounder measurements of doubly-selective vehicle-to-vehicle MIMO radio channels in the 5.2 GHz band. Ivrlac and Nossek [1] have defined a diversity measure for MIMO Rayleigh fading channels which is based on the spatial correlations of the channel. Subsequently, Nabar et al. [2] have shown the existence of an SNRdependent critical rate for Ricean fading MIMO channels below which reliable transmission with zero outage is achievable. Here, we evaluate and discuss the temporal evolution of the spatial diversity order of doubly-selective vehicle-tovehicle MIMO radio channels from real-world measurements by extending [I] and [2] to time-variant channels. Index Ter - MIMO channel measurements, V2V channel measurements, spatial correlation, spatial diversity.
大数据英文演讲 Big Data presention

Volunteered Geographic Information (VGI)
添加标题
VGI generates from emergence of online service platform providing geographical location. Main application field
@ Refinement of individual attributive data
Background
添加标题
Individual behavior and its spatio-temporal variation are main subjects and foundation in urban studies and planning practices. The following will particularly introduce some perspectives about them, as well as the main application fields of different types of big data.
Individual behavior; Spatial pattern of specific behavior; Visualization of social network; Connection intensity between cities; Urban spatial structure and function division
05
Open research issues
Open research issues
Big data
has become a very heated issue in the
Physica A Statistical Mechanics and its Applications

International Journal of Project Management , Volume 28, Issue 3,April 2010, Pages 285-295Paul Bowen, Peter Edwards, Keith Cattell, Ian JayShow preview | Related articles | Related reference work articlesPurchase85Dynamics of R&D networked relationships and mergers and acquisitions in the smart card field Original ResearchArticleResearch Policy , Volume 38, Issue 9, November 2009,Pages 1453-1467 Zouhaïer M’ChirguiClose preview | Related articles | Related reference work articlesAbstract | Figures/Tables | ReferencesAbstractThis paper analyzes how the structure and the evolution of inter-firmagreements have shaped the development of the smart card industry. The aimis to establish a closer connection between the evolution of inter-firmagreements in the smart card industry and the patterns of change of technologyand demand in this new high-tech industry. Based on a proprietary databasecovering both collaborative agreements and mergers and acquisitions (M&As)occurring in this industry over the period 1992–2006, we find that the evolutionof technology and market demand shapes the dynamics of R&D networks andPurchaseM&As are likely to change the industry structure. We also find that a small group of producers – first-movers – still control the industry and technological trajectories. Their position arises not for oligopolistic reasons of marketstructure, but for technological and organizational reasons.Article Outline1. Introduction2. Theoretical background3. The smart card industry: delineating the boundaries and identifying the actors3.1. Defining the smart card3.2. The differentiated market(s)3.3. The actors3.4. The smart card oligopoly: a dual market structure4. Research methods4.1. Methodology4.2. SCIFA database5. Trends in inter-firm agreements and emergence of networks in the smart cardindustry6. The structure of the network6.1. Network evolution6.2. Major players and centrality7. ConclusionAcknowledgementsReferences86The role of industrial maintenance in the maquiladoraindustry: An empirical analysis Original Research ArticleInternational Journal of Production Economics, Volume 114,Issue 1, July 2008, Pages 298-307Shad DowlatshahiClose preview | Related articles | Related reference work articlesPurchaseAbstract | Figures/Tables | ReferencesAbstractThis study explored the role of industrial maintenance in the maquiladora industry. The maquiladora industry is a manufacturing system that utilizes the Mexican workforce and foreign investment and technology on the border region between the United States and Mexico. The issues related to industrial maintenance were studied through a survey instrument and 11 in-depth and extensive field interviews with experts of eight maquiladora industries in El Paso, TX and Juarez, Mexico. Based on an 86% response rate (with 131 usable questionnaires) and four major survey questions, statistical analyses were performed. The survey questions included: collaboration between the maintenance and other functional areas, likely sources of maintenance problems (equipment, personnel, and management), major common losses of maintenance problems, and the role of ISO certification in maintenance. Finally, additional insights and assessment of the results were provided.Article Outline1. Introduction1.1. Review of literature2. Evolution of and various approaches to maintenance3. Historical, operational characteristics and the importance of the maquiladora industry4. Research design4.1. Data collection4.2. The interviews with maquiladora managers5. Analyses of results5.1. Statistical analysis for question 15.2. Statistical analysis for question 25.3. Statistical analysis for question 3 5.4. Statistical Analysis for question 46.Conclusions and assessmentReferences87 A variable P value rolling Grey forecasting model forTaiwan semiconductor industry production OriginalResearch ArticleTechnological Forecasting and Social Change, Volume 72,Issue 5, June 2005, Pages 623-640Shih-Chi Chang, Hsien-Che Lai, Hsiao-Cheng YuClose preview | Related articles |Related reference work articlesAbstract | Figures/Tables | ReferencesAbstractThe semiconductor industry plays an important role in Taiwan's economy. In thispaper, we constructed a rolling Grey forecasting model (RGM) to predictTaiwan's annual semiconductor production. The univariate Grey forecastingmodel (GM) makes forecast of a time series of data without considering possible correlation with any leading indicators. Interestingly, within the RGM there is aconstant, P value, which was customarily set to 0.5. We hypothesized thatmaking the P value a variable of time could generate more accurate forecasts. Itwas expected that the annual semiconductor production in Taiwan should beclosely tied with U.S. demand. Hence, we let the P value be determined by theyearly percent change in real gross domestic product (GDP) by U.S.manufacturing industry. This variable P value RGM generated better forecaststhan the fixed P value RGM. Nevertheless, the yearly percent change in realGDP by U.S. manufacturing industry is reported after a year ends. It cannotserve as a leading indicator for the same year's U.S. demand. We found out thatthe correlation between the yearly survey of anticipated industrial productiongrowth rates in Taiwan and the yearly percent changes in real GDP by U.S. manufacturing industry has a correlation coefficient of 0.96. Therefore, we usedPurchasethe former to determine the P value in the RGM, which generated very accurate forecasts. Article Outline1.Introduction2. The semiconductor industry in Taiwan3. Rolling GM (1,1)4. Forecast Taiwan semiconductor production with RGM (1,1)5. Forecast Taiwan semiconductor production with variable P value RGM (1,1)6. ConclusionsAppendix A. AppendixA.1. 1998 Production forecast for the semiconductor industry under different PvaluesA.2. 1999 Production forecast for the semiconductor industry under different PvaluesA.3. 2000 Production forecast for the semiconductor industry under different PvaluesA.4. 2001 Production forecast for the semiconductor industry under different PvaluesA.5. 2002 Production forecast for the semiconductor industry under different PvaluesReferencesVitae88 Energy demand estimation of South Korea using artificial neural network Original Research ArticleEnergy Policy , Volume 37, Issue 10, October 2009, Pages4049-4054Zong Woo Geem, William E. Roper Close preview | Related articles | Related reference work articlesAbstract | Figures/Tables | ReferencesPurchaseAbstractBecause South Korea's industries depend heavily on imported energy sources (fifth largest importer of oil and second largest importer of liquefied natural gas in the world), the accurate estimating of its energy demand is critical in energy policy-making. This research proposes an artificial neural network model (a structure with feed-forward multilayer perceptron, error back-propagation algorithm, momentum process, and scaled data) to efficiently estimate the energy demand for South Korea. The model has four independent variables, such as gross domestic product (GDP), population, import, and export amounts. The data are obtained from diverse local and international sources. The proposed model better estimated energy demand than a linear regression model (a structure with multiple linear variables and least square method) or an exponential model (a structure with mixed integer variables, branch and bound method, and Broyden–Fletcher–Goldfarb–Shanno (BFGS) method) in terms of root mean squared error (RMSE). The model also forecasted better than the other two models in terms of RMSE without any over-fitting problem. Further testing with four scenarios based upon reliable source data showed unanticipated results. Instead of growing permanently, the energy demands peaked at certain points, and then decreased gradually. This trend is quite different from the results by regression or exponential model.Article Outline1. Introduction2. Artificial neural network model3. Case study of South Korea4. Results of linear regression model5. Results of exponential model6. Results of ANN model7. Validation of the ANN model8.Future estimation with different scenarios9. ConclusionsReferences89 Catching up through developing innovation capability: evidence from China's telecom-equipmentindustry Original Research ArticleTechnovation , Volume 26, Issue 3, March 2006,Pages359-368 Peilei FanShow preview | Related articles | Related reference work articlesPurchase90 Optimization of material and production to develop fluoroelastomer inflatable seals for sodium cooled fastbreeder reactor Original Research ArticleNuclear Engineering and Design , In Press, Corrected Proof, Available online 16 February 2011N.K. Sinha, Baldev RajShow preview | Related articles | Related reference work articlesPurchase Research highlights► Production of thin fluoroelastomer profiles by cold feed extrusion and continuous cure involving microwave and hot air heating. ► Use of peroxide curing in air during production . ► Use offluoroelastomers based on advanced polymer architecture (APA) for the production of profiles. ► Use of the profiles in inflatable seals for critical application of Prototype Fast Breeder Reactor. ► Tailoring of material formulation by synchronized optimization of material and production technologies to ensure that the produced seal ensures significant gains in terms of performance and safety in reactor under synergistic influences of temperature, radiation, air and sodium aerosol.91 The dynamic transfer batch-size decision for thin film transistor –liquid crystal display array manufacturing by artificialneural-network Original Research ArticleComputers & Industrial。
2021届高三精准培优专练 阅读理解——细节理解题(含答案)

阅读理解——细节理解题题题真题在线1.应用①全国卷(2020·全国II卷,A)The Lake District Attractions GuideDalemain Mansion & Historic GardensHistory, Culture&Landscape(景观). Discover and enjoy 4 centuries of history, 5 acres of celebrated and award-winning gardens with parkland walk. Owned by the Hasell family since 1679, home to the International Marmalade Festival. Gifts and antiques, plant sales, museums & Mediaeval Hall Tearoom.Open: 29 Mar-29 Oct, Sun to Thurs.Tearoom, Gardens & Gift Shop: 10:30-17:00(16:00 in Oct).House: 11:15-16:00(15:00 in Oct).Town: Pooley Bridge & PenrithAbbot Hall Art Gallery & MuseumThose viewing the quality of Abbot Hall’s temporary exhibitions may be forgiven for thinking they are in a city gallery. The impressive permanent collection includes Turners and Romneys and the temporary exhibition programme has Canaletto and the artists from St Ives.Open: Mon to Sat and Summer Sundays. 10:30-17:00 Summer. 10:30-16:00 Winter.Town: KendalTullie House Museum & Art GalleryDiscover, explore and enjoy award-winning Tullie House, where historic collections, contemporary art and family fun are brought together in one impressive museum and art gallery. There are four fantastic galleries to visit from fine art to interactive fun, so there’s something for everyone!Open: High Season 1 Apr-31 Oct: Mon to Sat 10:00-17 00, Sun 11:00-17:00.Low Season 1 Nov-31 Mar: Mon to Sat 10:00-16:30, Sun 12:00-16:30.Town: CarlisleDove Cottage & The Wordsworth MuseumDiscover William Wordsworth’s inspirational home. Take a tour of his Lakeland cottage, walk through his hillside garden and explore the riches of the collection in the Museum. Visit the shop and relax in the café. Exhibitions, events and family activities throughout the year.Open: Daily, 09:30-17:30(last admission 17:00).Town: Grasmere21. When is the House at Dalemain Mansion & Historic Gardens open on Sundays in July?A. 09:30-17:30.B. 10:30-16:00.C. 11:15-16:00.D. 12:00-16:30.22. What can Visitors do at Abbot Hall Art Gallery & Museum?A. Enjoy Romney’s works.B. Have some interactive fun.C. Attend a famous festival.D. Learn the history of a family.23. Where should visitors go if they want to explore Wordsworth’s life?A. Penrith.B. Kendal.C. Carlisle.D. Grasmere.(2020·全国II卷,B)Some parents will buy any high-tech toy if they think it will help their child, but researchers said puzzles help children with math-related skills.Psychologist Susan Levine, an expert on mathematics development in young children at the University of Chicago, found children who play with puzzles between ages 2 and 4 later develop better spatial skills. Puzzle play was found to be a significant predictor of cognition(认知) after controlling for differences in parents’ income, education and the amount of parent talk, Levine said.The researchers analyzed video recordings of 53 child-parent pairs during everyday activities at home and found children who play with puzzles between 26 and 46 months of age have better spatial skills when assessed at 54 months of age.“The children who played with puzzles performed better than those who did not, on tasks that assessed their ability to rotate(旋转) and translate shapes,” Levine said in a statement.The parents were asked to interact with their children as they normally would, and about half of the children in the study played with puzzles at one time. Higher income parents tended to have children play with puzzles more frequently, and both boys and girls who played with puzzles had better spatial skill. However, boys tended to play with more complex puzzles than girls, and the parents of boys provided more spatial language and were more active during puzzle play than the parents of girls.The findings were published in the journal Developmental Science.24. In which aspect do children benefit from puzzle play?A. Building confidence.B. Developing spatial skills.C. Learning self-control.D. Gaining high-tech knowledge.25. What did Levine take into consideration when designing her experimental?A. Parents’ age.B. Children’s imagination.C. Parents’ education.D. Child-parent relationship.26. How do boys differ from girls in puzzle play?A. They play with puzzles more often.B. They tend to talk less during the game.C. They prefer to use more spatial language.D. They are likely to play with tougher puzzles.27. What is the text mainly about?A. A mathematical method.B. A scientific study.C. A woman psychologistD. A teaching program2.应用②非全国卷(2020·山东卷,A)POETRY CHALLENGEWrite a poem about how courage, determination, and strength have helped you face challenges in your life.Prizes3 Grand Prizes: Trip to Washington, D.C. for each of three winners, a parent and one otherperson of the winner’s choice. Trip includes round-trip air tickets, hotel stay for two nights, and tours of the National Air and Space Museum and the office of National Geographic World.6 First Prizes: The book Sky Pioneer: A Photobiography of Amelia Earhart signed by author Corinne Szabo and pilot Linda Finch.50 Honorable Mentions: Judges will choose up to 50 honorable mention winners, who will each receive a T-shirt in memory of Earhart’s final flight.RulesFollow all rules carefully to prevent disqualification.■Write a poem using 100 words or fewer. Your poem can be any format, any number of lines.■Write by hand or type on a single sheet of paper. You may use both the front and back of the paper.■On the same sheet of paper, write or type your name, address, telephone number, and birth date.■Mail your entry to us by October 31 this year.1. How many people can each grand prize winner take on the free trip?A. Two.B. Three.C. Four.D. Six.2. What will each of the honorable mention winners get?A. A plane ticket.B. A book by Corinne Szabo.C. A special T-shirt.D. A photo of Amelia Earhart.3. Which of the following will result in disqualification?A. Typing your poem out.B. Writing a poem of 120 words.C. Using both sides of the paper.D. Mailing your entry on October 30.(2020·江苏卷,B)Train InformationAll customers travelling on TransLink services must be in possession of a valid ticket before boarding. For ticket information, please ask at your local station or call 13 12 30.While Queensland Rail makes every effort to ensure trains run as scheduled, there can be no guarantee of connections between trains or between train services and bus services.Lost property(失物招领)Call Lost Property on 13 16 17 during business hours for items lost on Queensland Railservices.The lost property office is open Monday to Friday 7:30am to 5:00pm and is located(位于) at Roma Street station.Public holidaysOn public holidays, generally a Sunday timetable operates. On certain major event days, i.e. Australia Day, Anzac Day, sporting and cultural days, special additional services may operate. Christmas Day services operate to a Christmas Day timetable. Before travel please visit translink. com. au or call TransLink on 13 12 30 anytime.Customers using mobility devicesMany stations have wheelchair access from the car park or entrance to the station platforms. For assistance, please call Queensland Rail on 13 16 17.Guardian trains(outbound)21. What would you do to get ticket information?A. Call 13 16 17.B. Visit translink .com.au.C. Ask at the local station.D. Check the train schedule.22. At which station can you find the lost property office?A. Altandi.B. Roma Street.C. Varsity Lakes.D. Fortitude Valley.23. Which train would you take if you go from Central to Varsity Lakes?A.6:42pm.B.7:29pm.C.8:57pm.D.11:02pm.Passage 1Bus Tours in Washington DCThe Blossoms Tour In Washington DCDuration: 3 hours $56.99BEST WAY to Experience the Cherry Blossoms! Each year from mid March to mid April, see the beautiful Cherry Blossoms in Washington DC and get great photos because you’ll be led to all the best spots by the best guides. The annual spring bloom in DC is a magical time and this tour promises to provide the very best tour opportunity for you!The Lights Night Tour in Washington DCDuration: 3 hours $56.33Highest-rated Night Tour in DC! The ONL Y DC Night Tour where the Tour Guides HOP OFF with you at each stop and tell you about each monument and attraction. HOP aboard the The Lights Night Tour! The best time to take a tour of Washington DC is at night.The Best Minibus Tour in Washington DCDuration: 3 hours $ 46.92See all the key attractions DC has to offer in a 3-hour format. You will learn all about the history and trivia(琐事) that surrounds Washington and visit the major monuments and attractions DC has to offer.Please Note: Rates for this tour vary by day of the week. When you choose your specific date on the availability calendar, the rates for that date will be displayed.Best Mount Vernon & Arlington Cemetery Tour from Washington DCDuration: 6 hours $ 78.96See Arlington Cemetery, Old Town Alexandria and George Washington’s Mount Vernon Estate on this small group bus tour from Washington DC. Your tour guide will accompany you through Mount Vernon, telling you about all of the attractions there and the history of George Washington’s home on the Potomac River.1. Which date suits The Blossoms Tour most?A. July 4.B. August 15.C. March 27.D. October 8.2. What is special about The Best Minibus Tour?A. Its price is not fixed.B. The best time to take it is at night.C. The tour guide accompanies you.D. You can get great photos of cherry.3. Which tour would offer you a chance to learn about George Washington’s home?A. The Blossoms Tour.B. The Lights Night Tour.C. The Best Minibus Tour.D. Best Mount Vermon & Arlington Cemetery Tour.Passage 2How did the sea horse get its name? It’s not hard to guess. The top half of this fish looks like a small horse. But looking at th e sea horse’s tail, you might think “sea monkey” is a better name. Then there’s the sea hors e’s pouch(袋). “Sea kangaroo” might also be a good name for this fish.Sea horses live in warm ocean waters all over the world. They keep safe from other fish by hiding in plants and grasses that grow under the sea. They can also change colors to match their surroundings(环境). A sea horse remains in one place for hours at a time by winding(缠绕) its tail around a plant. It feeds on live food, such as small shrimp. For a fish that doesn’t move around much, the sea horse eats a lot—in just one day, a sea horse can eat 3,000 shrimp!A sea horse keeps the same mate for its whole life, and it’s the male(雄的) sea horse that gives birth to baby sea horses. How does this happen? Baby sea horses start out as eggs, which come from the female’s body. The male carries the eggs in its pouch for about three weeks until they hatch(孵化). Soon after the babies are born, the female gives her mate a new set of eggs. The male sea horse spends most of its life carrying eggs.Sadly, the number of sea horses is becoming smaller. Why is this happening? Some places where sea horses once lived have been filled in to make new land. Also, many sea horses are caught and sold as aquarium(水族馆,养鱼缸) fish. This really is not a good idea because most sea horses don’t live long in aquariums. The best place for a sea horse is the ocean.4. The sea horse got its name because of its .A. headB. tailC. skinD. pouch5. We can learn from the text that sea horses .A. like to move aroundB. live in cold ocean watersC. feed on small sea animalsD. change colors with the temperature6. What does a female sea horse do with her eggs?A. She puts them in the male’s pouchB. She hides them in sea grasses.C. She carries them around.D. She hatches them.7. Why is the number of sea horses becoming smaller?A. They grow at a very low speed.B. Their homes are being destroyed.C. They are killed by people for food.D. Their food is becoming less and less.Passage 3Amazon has changed the way we shop — you can get anything on the site, right? Actually, the retail(零售) giant has to draw the line on some products. Here are the items you’ll have to find elsewhere.PetsThankfully, you cannot expect to purchase the family pet on Amazon. Pets, livestock, and marine mammals are strictly prohibited from being sold on the site and with good reason — primarily being that none of these should be kept in a warehouse awaiting an order. If you’re prepared to adopt an animal, one option is to search Petco’s listing of adoptable pets in your area. And, of course, rescuing an animal from a local shelter will do a world of good for both your family and its newest member.Lottery(彩票) ticketsMost of us wouldn’t turn down an opportunity to strike it rich, but you’re still going to have to wait in line if you want to score a lottery ticket. On Amazon’s list of prohibited items are lottery tickets. Rules and regulations about selling lotto tickets vary by state and merchants must apply to become a retailer of lottery tickets. For example, the California Lottery asks that potential sellers have more than 200 customers daily, be able to accommodate official lottery equipment, and be in a retail setting like a grocery or gas station, among others.TobaccoYou can find a variety of things for a smoking habit, like ashtrays, pipes, and cigarette paper, on Amazon, but don’t expect to find any actual tobacco products. E-cigarettes, regardless of whether or not they contain nicotine, are also a no-no on the site. It would simply be boring for the company to check the age of buyers ordering tobacco products online.8. Why is there a ban on selling pets on Amazon?A. Because selling pets on the Internet is illegal in the world.B. Because animals can’t be put in the storehouse to sell.C. Because it’s not safe to buy animals on the Internet.D. Because animals can only be bought from local shelters.9. What can you do if you want to buy a lottery ticket?A. Accommodate official lottery equipment yourself.B. Apply to become a retailer of lottery tickets yourself.C. Queue at a lottery ticket store to get one on the spot.D. Live a life yourself near a grocery store or gas station.10. What can you buy on Amazon according to the text?A. E-cigarettes.B. Marine mammals.C. Lottery equipment.D. Cigarette paper.Passage 4“This isn’t Disneyland, I’m not a novelty(新奇), this is as real as it gets.” sing The Sisters of Invention.The young women—Annika, Michelle, Jackie, Aimee and Carolme—are a pop group with a difference. All have learning difficulties and some have extra disabilities.The five are based in Adelaide, Australia, and met in 2010 when they sang together in a choir(合唱队) run by Tutti, an organization which supports disabled artists. Tutti saw they had talent and invited them to form a group. Now they perform together two or three times per month, and this is how they make a living.Michelle is 25 and has cerebral palsy(脑瘫) and a mild learning disability. She says, “We choose the name The Sisters of Invention because we are like sisters and we support each other on and off stage.For the invention part, we are trying to change people’s view of people with disabilities. We are reinventing the rules.”All their songs are based on the members’ own experiences and were written as a group in their twice weekly meetings at Tutti. “We would arrive in the morning and I’d say, ‘What do you want to talk about today?’” says their manager and producer Michael Ross. He then noted down everything they said until lyrics took shape. Ross says that putting “their truth” out there is important. He says, “What I’m interested in is that we get to see the world in a way that people in pop culture almost never get to see. It is creative gold.”When they perform their songs, the physical side of their disabilities is more obvious, but Ross says, “They’re not up there to show their barriers or difficulties. They’re up there to show their strengths.”11. What do we know about The Sisters of Invention?A. All its members are disabled.B. It was founded all by five girls.C. It has existed for less than ten years.D. They perform not in order to make money.12. The girls choose the name The Sisters of Invention because .A. they all have great talentB. they help each other like sistersC. they have the same experiencesD. they are good at inventing things13. How does Michael Ross produce lyrics for The Sisters of Invention?A. By talking with the girls.B. By asking the girls questions.C. By learning about pop culture.D. By using his personal experiences.(2020·全国II卷,A)【答案】21-23 CAD【解析】本文是一篇应用文,介绍了湖区(英国著名的国家公园)的几个景点。
生活中经历的歧视英语作文
In our daily lives,discrimination can take many forms and can be based on various factors such as race,gender,age,or social status.Here is an essay on the experience of discrimination in life,highlighting some common scenarios and the impact it can have on individuals.Title:Encountering Discrimination in Everyday LifeIntroduction:Discrimination is a pervasive issue that affects countless individuals across the globe.It is an unjust behavior that stems from prejudice and ignorance,often leading to the unfair treatment of others.This essay delves into personal experiences with discrimination and the broader implications it has on society.Experiencing Racial Discrimination:One of the most common forms of discrimination is racial.It can manifest in subtle ways, such as being overlooked for a job opportunity,or more overtly,through verbal abuse or physical violence.For instance,a person of color might find themselves the target of derogatory comments or stereotypes,which can be deeply hurtful and dehumanizing. Gender Discrimination in the Workplace:Women often face discrimination in professional settings,where they may be paid less than their male counterparts for the same work,or be passed over for promotions despite equal qualifications.This gender bias can be frustrating and demoralizing,as it undermines the principle of equal opportunity.Ageism in Society:Age discrimination is another form of prejudice that affects people of all ages,but is particularly prevalent against the elderly.Older individuals may find themselves marginalized or dismissed based on their age,which can lead to feelings of isolation and a lack of respect.Social Status and Economic Discrimination:People from lower socioeconomic backgrounds often face discrimination based on their financial status.This can result in limited access to quality education,healthcare,and other essential services.The stigma associated with poverty can also lead to social exclusion and a lack of representation in decisionmaking processes.The Impact of Discrimination:The effects of discrimination are farreaching and can lead to a range of negative outcomes,including psychological distress,social isolation,and a reduced quality of life.It can also perpetuate cycles of poverty and inequality,as those who are discriminated against may find it more difficult to access opportunities for social and economic mobility.Overcoming Discrimination:To combat discrimination,it is essential to foster a culture of inclusivity and respect for diversity.This can be achieved through education,awareness campaigns,and legal protections that ensure equal rights for all individuals,regardless of their background.It is also crucial for individuals to stand up against discrimination when they witness it,and to support those who have been affected by it.Conclusion:Discrimination is a complex and multifaceted issue that touches many aspects of life.By understanding the various forms it can take and the impact it has on individuals and society,we can work towards creating a more equitable and just world for everyone.It is through collective action and a commitment to fairness that we can hope to overcome the scourge of discrimination.。
correlation

correlationCorrelationIntroductionCorrelation is a statistical measure that determines the degree to which two variables are related to each other. It is an important concept in many fields, including statistics, economics, social sciences, and healthcare. In this document, we will explore the concept of correlation, its types, and its significance in various applications.What is Correlation?Correlation quantifies the statistical relationship between two variables. It measures how changes in one variable correspond to changes in another variable. Correlation is typically represented by the correlation coefficient, which ranges from -1 to +1. A positive correlation indicates a direct relationship, while a negative correlation indicates an inverse relationship. A correlation coefficient close to zero indicates a weak or no relationship between the variables.Types of CorrelationThere are three main types of correlation: positive correlation, negative correlation, and zero correlation.1. Positive Correlation: When two variables increase or decrease together, they are said to have a positive correlation. For example, there is a positive correlation between the amount of study time and test scores. As the study time increases, the test scores also tend to increase. The correlation coefficient for a positive correlation ranges from 0 to +1.2. Negative Correlation: In contrast to a positive correlation, a negative correlation exists when one variable increases while the other decreases. For instance, there is a negative correlation between the number of hours spent watching TV and academic performance. As the hours spent watching TV increase, the academic performance tends to decrease. The correlation coefficient for a negative correlation ranges from 0 to -1.3. Zero Correlation: Zero correlation, as the name suggests, implies no relationship between the variables. The changes in one variable do not correspond to any changes in the othervariable. When the correlation coefficient is close to zero, it indicates a weak or no correlation.Significance of CorrelationCorrelation has several practical applications in different fields.1. Statistics: Correlation analysis is used to determine the strength and direction of the relationship between variables. It helps statisticians to understand the patterns and trends in data. Correlation coefficients are widely used in regression analysis and predictive modeling.2. Economics: In economics, correlation analysis helps to identify relationships between different economic variables such as inflation and unemployment rates, interest rates and investment, or GDP and consumer spending. Understanding these relationships is essential for making informed economic decisions.3. Social Sciences: Correlation is used in social sciences to study various phenomena, such as the relationship between education and income, crime rates and poverty, or healthbehaviors and disease outcomes. Correlation can provide insights into social trends and patterns.4. Healthcare: Correlation plays a crucial role in healthcare research. It helps to identify risk factors, assess treatment effectiveness, and understand the relationship between lifestyle choices and health outcomes. For example, studying the correlation between smoking and lung cancer can help healthcare professionals develop effective prevention strategies.ConclusionCorrelation is a powerful statistical tool that measures the relationship between two variables. It helps us understand how changes in one variable relate to changes in another variable. By analyzing correlation coefficients, we can determine the strength and direction of the relationship. Correlation has wide-ranging applications in statistics, economics, social sciences, healthcare, and other fields. Understanding correlation is essential for making informed decisions and drawing meaningful conclusions from data.。
mydreamcity英语作文三句话

In the realm of my imagination, where the boundaries of possibility stretch far beyond the confines of reality, lies a city that encapsulates the pinnacle of human ingenuity, environmental harmony, and societal well-being. This dream city, an exquisite tapestry woven from the threads of cutting-edge technology, sustainable practices, and cultural richness, transcends the conventional definition of urban living to offer its inhabitants a life of unparalleled quality. With an unwavering commitment to innovation, inclusivity, and sustainability, this metropolis stands as a beacon of hope for the future of urban civilization. In this comprehensive exploration, I shall delve into the intricate details of this utopian vision, elucidating the various facets that make my dream city a paradigm of excellence.1. **A Technological Marvel: The Backbone of Efficiency and Convenience**At the heart of my dream city beats a robust, interconnected network of smart systems, seamlessly integrating artificial intelligence, the Internet of Things (IoT), and advanced robotics into every aspect of daily life. These technologies, acting as the city's nervous system, ensure unparalleled efficiency, convenience, and safety for all residents.Firstly, autonomous vehicles ply the city's meticulously planned, multi-modal transport network, powered by clean energy sources like hydrogen fuel cells or electric batteries, significantly reducing congestion and pollution. Smart traffic management systems dynamically adjust signal timings, optimizing traffic flow and minimizing delays. Public transit, including driverless buses and high-speed rail, is seamlessly integrated with ride-sharing services, ensuring rapid, reliable, and eco-friendly mobility for all.Secondly, smart homes, equipped with AI-powered appliances, voice-activated assistants, and intuitive energy management systems, cater to residents' needs while conserving resources. Waste management is revolutionized through the deployment of automated sorting and recycling systems, coupled with IoT-enabled waste bins that signal when they need emptying.Lastly, a comprehensive, AI-driven public safety infrastructure monitorsthe city round-the-clock, utilizing predictive analytics to identify potential risks and swiftly deploy emergency services. Drones and robots assist in tasks ranging from firefighting to maintenance, enhancing response times and minimizing human risk.2. **Sustainability Reimagined: An Ecological Haven in Concrete Jungle**My dream city is not just technologically advanced; it is also a testament to the harmonious coexistence of urban development and nature. It subscribes to the principles of circular economy and green architecture, ensuring minimal ecological footprint and fostering biodiversity.The cityscape is adorned with vertical gardens, green roofs, and verdant parks, providing ample green spaces for residents to unwind and connect with nature. These green lungs also serve as carbon sinks, purify the air, and mitigate the urban heat island effect. Moreover, urban agriculture initiatives, such as rooftop farms and community gardens, promote local food production, reducing reliance on long-distance supply chains and fostering a sense of community.The city's infrastructure is designed for maximum resource efficiency. Buildings are constructed using eco-friendly materials and adhere to rigorous energy-efficient standards, harnessing renewable energy sources like solar, wind, and geothermal power. Water conservation is paramount, with systems in place for rainwater harvesting, greywater reuse, and stringent leak detection.Waste is viewed as a valuable resource, with robust recycling and upcycling programs in place. A zero-waste policy encourages residents to adopt minimalist lifestyles and reduce consumption, complemented by a thriving sharing economy that promotes the use of goods and services over ownership.3. **Cultural Melting Pot: Celebrating Diversity and Fostering Creativity**My dream city thrives on the vibrant interplay of diverse cultures, traditions, and ideas, nurturing a cosmopolitan spirit that enriches the lives of its inhabitants. It is a sanctuary for artists, intellectuals, and innovators, where creativity and free expression flourish unhindered.Public spaces abound with art installations, murals, and sculptures,reflecting the city's commitment to artistic expression and cultural preservation. Museums, galleries, theaters, and concert halls showcase both local and international talent, hosting a year-round calendar of festivals and events that celebrate the arts in all their forms.Education is prioritized, with world-class institutions offering inclusive and interdisciplinary learning opportunities, fostering critical thinking, empathy, and lifelong learning. Language exchange programs, multicultural festivals, and community workshops encourage cross-cultural understanding and dialogue, knitting the social fabric tighter.Moreover, the city's urban planning ensures equitable access to amenities and opportunities for all residents, regardless of socioeconomic background. Affordable housing policies, mixed-income neighborhoods, and robust public services break down socio-spatial barriers, fostering a strong sense of belonging and social cohesion.4. **Inclusive Governance: Empowering Citizens and Ensuring Equity**Democratic participation and transparency are the cornerstones of governance in my dream city. Citizens actively engage in decision-making processes through regular town hall meetings, online platforms, and participatory budgeting initiatives. Open data policies ensure public access to vital information, enabling informed civic discourse and holding elected officials accountable.The city administration prioritizes social welfare, investing in comprehensive healthcare, mental health support, and universal basic services like education, housing, and sanitation. Progressive taxation, coupled with robust social safety nets, ensures income equality and mitigates the effects of economic inequality.Furthermore, the city is designed to be accessible for all, with universal design principles incorporated into infrastructure and facilities. Assistive technologies, Braille signage, and auditory cues ensure ease of navigation for individuals with disabilities, while age-friendly amenities cater to the needsof senior citizens.In conclusion, my dream city is a harmonious fusion of technological prowess, environmental stewardship, cultural richness, and inclusive governance. It is a testament to human ingenuity and the boundless possibilities that can be realized when we aspire to create urban environments that prioritize people's well-being and the planet's sustainability. This visionary metropolis may seem like a distant utopia today, but with concerted efforts and a shared commitment to progress, it could well become the blueprint for tomorrow's cities – a shining exemplar of what we can achieve when we dare to dream big and work together towards a brighter, more equitable, and sustainable future.。
- 1、下载文档前请自行甄别文档内容的完整性,平台不提供额外的编辑、内容补充、找答案等附加服务。
- 2、"仅部分预览"的文档,不可在线预览部分如存在完整性等问题,可反馈申请退款(可完整预览的文档不适用该条件!)。
- 3、如文档侵犯您的权益,请联系客服反馈,我们会尽快为您处理(人工客服工作时间:9:00-18:30)。
a r X i v :c o n d -m a t /9810060v 1 [c o n d -m a t .s o f t ] 6 O c t 1998Spatial correlations of mobility and immobility in a glassforming Lennard-Jones liquidClaudio Donati 1,Sharon C.Glotzer 1,Peter H.Poole 2,Walter Kob 3,and Steven J.Plimpton 41Polymers Division and Center for Theoretical and Computational Materials Science,NIST,Gaithersburg,Maryland,USA208992Department of Applied Mathematics,University of Western Ontario,London,Ontario N6A 5B7,Canada 3Institut f¨u r Physik,Johannes Gutenberg Universit¨a t,Staudinger Weg 7,D-55099Mainz,Germany 4Parallel Computational Sciences Department,Sandia National Laboratory,Albuquerque,NM 87185-1111(February 1,2008)Using extensive molecular dynamics simulations of an equilibrium,glass-forming Lennard-Jones mixture,we characterize in detail the local atomic motions.We show that spatial correlations exist among particles undergoing extremely large (“mobile”)or extremely small (“immobile”)displace-ments over a suitably chosen time interval.The immobile particles form the cores of relatively compact clusters,while the mobile particles move cooperatively and form quasi-one-dimensional,string-like clusters.The strength and length scale of the correlations between mobile particles are found to grow strongly with decreasing temperature,and the mean cluster size appears to diverge at the mode-coupling critical temperature.We show that these correlations in the particle displace-ments are related to equilibrium fluctuations in the local potential energy and local composition.PACS numbers:02.70.Ns,61.20.Lc,61.43.FsI.INTRODUCTIONThe bulk dynamical properties of many cold,dense liquids differ dramatically from what might be expected from extrapolation of their high temperature behavior [1].For example,many liquids cooled below their melt-ing temperature exhibit rapid non-Arrhenius increases of viscosity and relaxation time with decreasing tempera-ture,and two-step,stretched exponential decay of the intermediate scattering function F (q ,t ).Such behavior is often discussed as a “signature”of the approach to the glass transition.It has long been a central goal of theories of the glass transition to account for these bulk phenom-ena in terms of the microscopic dynamical motions of the molecules of the liquid.As a consequence,computer simulations of supercooled liquids,in which this micro-scopic information is immediately available,are increas-ingly used to complement theoretical and experimental efforts.In particular,simulations in recent years have focused on the study of “dynamical heterogeneity”to understand the microscopic origin of slow dynamics and stretched exponential relaxation in glass-forming liquids [2–6].Recently we reported the observation of dynamical het-erogeneity [7]and also cooperative molecular motion [8]in extensive molecular dynamics simulations of a super-cooled Lennard-Jones (LJ)mixture.These spatially cor-related dynamics were observed in a regime of tempera-ture T ,density ρand pressure P for T above the dynam-ical critical temperature T c obtained [9,10]from fits by the ideal mode coupling theory (MCT)[11]to other data on the same system.The principle goals of the present paper are twofold:(1)To test directly for spatial corre-lations of particles assigned (according to their displace-ment over some time)to subsets of extreme mobility or immobility,and (2)to establish connections between this “dynamical heterogeneity”and local structure.This paper is organized as follows.In Section II we present relevant background information,and in Sec-tion III we describe the model and computer simulation techniques.In Sec.IV,we examine the bulk dynamics and equilibrium structure of the liquid.In Sec.V we examine the mean square displacement and analyze the shape of the time-dependent distribution of particle dis-placements to define a time scale which we use to study dynamical heterogeneity throughout the remainder of the paper.In Sec.VI we group particles into subsets accord-ing to the maximum displacement they achieve on the time scale defined in the previous section,and show that particles of extremely high or low displacement are spa-tially correlated.From this we are able to identify a length scale that grows with decreasing T .In Sec.VII we show that fluctuations of the local mobility are cor-related to fluctuations of the potential energy,or alter-natively to fluctuations in the local composition of the liquid.In Sec.VIII we examine certain time dependent quantities associated with the observed dynamical het-erogeneity,and finally in Sec.IX we conclude with a dis-cussion.II.BACKGROUNDIt has been proposed that the stretched exponential behavior exhibited by the long time relaxation of F (q ,t )can be attributed to a sum of many independent local ex-ponential relaxations with different time constants,i.e.,to a distribution of relaxation times [12].This interpre-tation is one form of the so-called“heterogenous”sce-nario for relaxation[6,12–17].A number of recent experi-ments[13–15]have shown that in liquids such as orthoter-phenyl and polystyrene within10K of their glass tran-sition temperature T g,subsets of molecules rotate slowly relative to the rest of the molecules on time scales long compared with collision times,but shorter than the re-laxation time of densityfluctuations.These liquids were thus termed“dynamically heterogenous.”None of these experiments were able to explicitly demonstrate whether slow molecules are spatially correlated,but typical dis-tances over which slow molecules may be correlated were inferred[13].There have been numerous attempts to indirectly mea-sure a characteristic length scale over which molecular motions are correlated at the glass transition both in ex-periments[18–21]and in simulations[3,22].Donth[18] relates the distribution of relaxation times in systems ap-proaching their glass transition to equilibrium thermo-dynamicfluctuations having a characteristic size of∼3 nm at T g.Thermodynamic measurements on orthoter-phenyl[19],and dielectric measurements on salol[20],N-methyl-ǫ-caprolactan and propylene glycol[21],showed a shift in T g due to confinement in pores of the order of a few nanometers.Mountain[3]showed that the size of regions that support shear stress in a simulation of a glass-forming mixture of soft spheres grows with decreas-ing temperatures.Monte Carlo simulations of polymer chains in two dimensions demonstrated strongfinite size effects on diffusion[22].A number of experiments and simulations on polymers confined to thinfilms all found a shift of T g due to confinement[23–27].These effects have all been attributed to the presence of cooperatively rearranging regions that grow with decreasing T.How-ever,the origin of this characteristic length has never been shown explicitly.In particular,the connection of the characteristic length to a cooperative mechanism of molecular motion has not been experimentally demon-strated.The intuitively-appealing picture of cooperative molec-ular motion was proposed in1965by Adam and Gibbs[28].In their classic paper,they proposed that significant molecular motion in a cold,densefluid can only occur if the molecules rearrange their positions in a concerted,cooperative manner.They postulated that a glass-forming liquid can be viewed as a collection of in-dependently relaxing subvolumes within which the mo-tion of the particles is cooperative.As the temperature of the liquid is lowered,the number of particles involved in cooperative rearrangements increases.If structural re-laxation occurs through the cooperative rearrangement of groups of molecules,the liquid observed over a time-scale shorter than the structural relaxation time will appear as a collection of regions of varying mobility.These predic-tions can be tested by selecting subsets of molecules that relax slower(or faster)than the average,and determining whether the molecules in a subset are randomly scattered through the sample or tend to cluster in a characteristic way.The explicit connection between dynamical hetero-geneity and cooperative motion is only recently being in-vestigated experimentally in detail[20].However,there have been a number of recent computational investiga-tions addressing these issues.For example,Muranaka and Hiwatari[2]showed that displacements of particles measured over a timescale of the order of5collision times are correlated within a range of about two inter-particle distances in a two-dimensional binary mixture of soft disks below the freezing point.Wahnstr¨o m[29] showed that hopping processes in a strongly supercooled binary mixture are cooperative in nature.Hurley and Harrowell[4]identifiedfluctuating local mobilities in a supercooled two-dimensional(2-d)soft-disk system,and showed an example of correlated particle motion on a timescale of the order of20collision times.Mountain [3]demonstrated similar correlated particle motion in a 2-d supercooled Lennard-Jones mixture.By examining the time at which two neighboring particles move apart in2-d and3-d simulations of a supercooled soft-sphere mixture,Yamamoto and Onuki demonstrated the growth of correlated regions of activity[5].They further stud-ied the effect of shear on these regions[5],and showed that the size of the regions diminished in high shear.The clusters of“broken bonds”(denoting pairs of neighboring particles that separate beyond the nearest neighbor dis-tance)identified in that work are similar in some respects to the clusters of highly mobile particles in a3-d binary Lennard-Jones liquid reported previously by us[7],and described in detail in the present paper.The connec-tion between the clusters of Ref.[7],which demonstrate a form of dynamical heterogeneity,and cooperative par-ticle motion,was shown in Ref.[8].III.SIMULATION DETAILSWe performed equilibrium molecular dynamics(MD) simulations of a binary mixture(80:20)of N=8000 particles in three dimensions.The simulations were per-formed using the LAMMPS molecular dynamics code[30] which was designed for use on distributed memory par-allel MMPS partitions particles(atoms or molecules)across processors via a spatial decomposition [31]whereby each processor temporarily“owns”parti-cles in a smallfixed region of the simulation box.Each processor computes the motion of its particles and ex-changes information with neighboring processors to com-pute forces and allow particles to migrate to new proces-sors as needed.The6400particles of type A and1600particles of type B interact via a6-12Lennard-Jones potential,V αβ(r )=4ǫαβσαβr6,(1)where αβ∈{A,B }.The interaction forces between par-ticles are zero for all r >r c =2.5σAA .Both types of particles are taken to have the same mass m .The Lennard-Jones interaction parameters ǫα,βand σα,βfor this mixture are:ǫAA =1.0,ǫAB =1.5,ǫBB =0.5,σAA =1.0,σAB =0.8,σBB =0.88.Both the relative concentration of particle types and the interaction pa-rameterswerechosentoprevent demixing and crystal-lization [9].Throughout this paper,lengths are defined in units of σAA ,temperature T in units of ǫAA /k B ,and time t in units ofN αj ∈αei q ·(r j (t )−r j (0)),(2)where r j (t )is the position of particle j at time t ,and ··· indicates an average over independent configura-tions.This quantity describes the relaxation of density fluctuations due to single particle displacements on an inverse length scale 2π/q ,where q ≡|q |.If we assume rotational invariance of the system,F s (q,t )depends only on q .The time dependence of F s (q,t )for the A particles for q =q max is shown in Fig.1.(Throughout this paper,q is chosen as q max ,the position of the first maximum of the static structure factor S (q,0)).At high T ,F s (q,t )decays to zero exponentially.As the system is cooled,F s (q,t )develops a plateau that separates a short time relaxation process from a long time relaxation process.This plateau indicates a transient “localization”of par-ticles in the “cages”formed by their neighbors,and is a characteristic feature of all glassforming liquids.The mode-coupling theory developed for supercooled liquids by G¨o tze and Sj¨o gren makes a number of predic-tions concerning the decay of the intermediate scattering function [11].These predictions have been tested and verified for the LJ potential used here in a regime of P ,T ,and ρsimilar but not identical to that simulated here [9].There it was shown,e.g.,that the early and late β-relaxation regimes are well described by power laws,and that the late time behavior of F s (q,t )exhibits time-temperature superposition with a time constant ταthat diverges as a power law as T approaches T c ≃0.432,with exponent γ≃2.7.The diffusion constant was found to scale as D ∼(T −T c )−γ,with γ=2.0for the A particles,γ=1.7for the B particles,and T c =0.435.The simulations performed in the present work extend from a point in the phase diagram where two-step re-laxation begins to emerge,down to a state point thatis within approximately 4%of T c .Over this range,we find that ταincreases by 2.4orders of magnitude,and fits well to the power lawformfound in Ref.[9],with approximately the same critical temperature and critical exponent.It is well known that although relaxation becomes strongly nonexponential and relaxation times increase by many orders of magnitude as a supercooled liquid ap-proaches a glass transition,changes in the static structure of most liquids are far less remarkable.To demonstrate this for our system,we examine the pair correlation func-tions g αβ(r )given byg αβ(r )=VN α(N α−1)i,j ∈αδ(r +r j −r i ),(4)where N α(N β)is the total number of particles of species α(β).With this normalization,g αβ(r )converges to unity for r →∞in the absence of long range correlations.Assuming rotational invariance,the correlation functions do not depend on the direction of the vector r ,but only on the distance r =|r |.In Figs.2,3and 4we show the pair correlation func-tions g AA (r ),g AB (r ),and g BB (r )for three temperatures.The figures show that these functions do not change dra-matically as a function of the state point.As the tem-perature is lowered,the main effect on all three func-tions is that the maxima and the minima become slightly more pronounced.Additionally,the second maximum of g AA (r )and g AB (r )at low T shows a splitting that has commonly been interpreted as a signature of an amor-phous solid,although at these state points our system is an equilibrium liquid.Recently,evidence has been re-ported [35]that in a 2-d system of hard-disks the splitting of the second peak in the pair correlation function is due to the formation of regions with hexagonal close-packed order.V.SINGLE PARTICLE DYNAMICSHaving established that the model liquid studied here exhibits the characteristic bulk phenomena of a glass-forming liquid,we examine in this section the distribu-tion of individual particle motions.The most basic dynamical bulk quantity that is easily accessible to simulation is the particle mean square dis-placement (MSD), r 2(t ) .Because we are investigating a binary mixture,we refer in the following to a MSD for the A particles and a MSD for the B particles.At high T ,the MSD for both species exhibits two distinct regimes(see Fig.5).In the short time limit (regime I)the MSD is ballistic,i.e. r 2(t ) ∝t 2.For longer times (regime III),the MSD is diffusive,i.e. r 2(t ) ∝t .As the system is cooled,an intermediate regime (II)between these two limiting behaviors develops.Before entering the diffu-sive regime, r 2(t ) exhibits a plateau,analogous to the plateau in the intermediate scattering function,that like-wise arises from a transient “caging”of each particle by its neighbors.As seen in the figure,the time the sys-tem spends in the plateau depends strongly on T ,and increases with decreasing T .The MSD for the B par-ticles (not shown)exhibits qualitatively the same time dependence as shown in Fig.5,but the diffusive regime is reached at shorter times,and the diffusion constant is larger,than for the A particles [9].This difference can be explained by the different sizes of the A and B parti-cles and by the fact that the interaction constant ǫBB is smaller than ǫAA .In this paper,we are interested in whether spatial cor-relations exist between particles that exhibit either ex-tremely large or extremely small displacements over some time interval.To determine this,we must first define the time interval over which the particle displacements will be monitored.Obviously,displacements may be mon-itored over any time interval,from the ballistic regime to the diffusive regime.To see whether there is a natu-ral time scale on which the particle displacements might exhibit a particularly strong correlation,we turn to the self part of the van Hove correlation function,G s (r,t ),which gives the probability to find a particle at time t at a distance r from its position at t =0[34]:G s (r ,t )=12π r 2(t )32 r 2(t )(6)and where r 2(t ) is equal to the measured one.The Gaussian form appears to be a good approximation to G s (r,t )at both short and long times.However,it is apparent from the figure that G s (r,t )is significantly dif-ferent from G 0(r,t )at intermediate times.In particu-lar,while many of the particles have traveled less than would be expected from the knowledge of r 2(t ) alone,a small number of particles have traveled significantly far-ther.As a result,at intermediate times G s (r,t )displays a long tail that extends beyond one interparticle distance at T =0.4510(cf.Fig.7).This“long tail”behavior is most pronounced at a time t∗when G s(r,t)deviates most from a Gaussian(cf. Fig.7)as characterized by the“non-Gaussian”parame-ter[36],3 r4(t)α2(t)=The subsets of mobile particles selected using the defi-nition of Ref.[7]and that used here have a large overlap, since particles that have moved relatively far at some time in the interval[0,t∗]are likely to remain relatively far at the end of the interval.However,subsets of im-mobile particles selected with the two different rules do not have as large an overlap,since a particle with a small displacement at some time may have previously traveled far,and then returned to its original position.The dis-tribution4πµ2P(µ,t∗)at t∗is shown in Fig.9.For com-parison,the probability distribution4πr2G s(r,t∗)is also shown.Note that,although at t∗particles can be found arbitrarily close to their position at t=0,P(µ,t∗)is zero forµ<0.17.In Fig.10,we show the320mobile particles(light spheres)and the320immobile particles(dark spheres) at the beginning of an arbitrary time interval[t,t+t∗] for one configuration at T=0.4510.The other7360 particles are not shown.Thefigure shows that particles of similar mobility are spatially correlated and that par-ticles with different mobility tend to be anticorrelated. These correlations can be quantitatively studied by cal-culating static pair correlation functions between parti-cles belonging to the different subsets.In Fig.11we show the pair correlation function g MM(r)between mobile particles for four different tem-peratures.g MM(r)is defined by Eq.4with the sum restricted to the mobile particles..For all T,g MM(r)is appreciably higher that the average g AA(r)(cf.Fig.2) for all r.The“excess”correlation given by the ratio Γ(r)=[g MM(r)/g AA(r)]−1is plotted as a function of r in Fig.12.With the exception of the excluded volume sphere of the LJ potential,Γ(r)>0at intermediate dis-tances and converges to zero for large r.It is clear from thefigure that the total excess correlation,given by the area under the curve,increases with decreasing T.We can obtain an estimate of the typical distance over which mobile particles are correlated by identifying clus-ters of nearest-neighbor mobile particles[40].To do this, we use the following rule:two particles belong to the same cluster if their distance at t=0is less than r nn, the radius of the nearest neighbor shell,which is defined by thefirst minimum in g AA(r)and has a weak temper-ature dependence.In our hottest run r nn=1.45,while in the coldest run r nn=1.40.The distribution P(n)of clusters of size n is shown in Fig.13.Although most of the clusters have only a modest size,the data show that a significant fraction of the mobile particles,which them-selves make up only5%of the sample(320particles), are part of big clusters.For instance,at T=0.4510, there is typically at least one cluster in each configuration that contains≈100particles.For that T,P(n)∼n−τwithτ=1.86.In the inset we show the mean cluster size S= n2P(n)/ nP(n)[41],plotted log-log versus T−T c,where T c=0.435is thefitted critical temperature of the mode coupling theory[9,10].Although there is less than a decade on either axis,thefigure shows that the temperature dependence of S is consistent with a diver-gence at T c of the form S∼(T−T c)−γ,withγ≈0.618. Note that MCT makes no predictions about clustering or the divergence of any length scales as the critical point is approached[42].To test the sensitivity of the apparent percolation tran-sition at the mode-coupling temperature,we repeat the cluster size distribution analysis for the3%and7%most mobile particles.For each subset,the mean cluster size S is shown vs.T−T c in Fig.14.The bestfit of S∼(T−T p)−γto each set of data gives T p=0.440 for the set containing the3%most mobile particles, T p=0.431for the set containing the5%most mobile particles,and T p=0.428for the set containing the7% most mobile particles.However,within the accuracy of the data the three sets are also consistent with a diver-gence at T c.If we further increase the fraction of mobile particles beyond the fraction corresponding to a random close-packed percolation transition[43],the mobile parti-cles percolate and most of the mobile particles are found in a single cluster that spans the whole simulation box. In Fig.15we show one of the largest clusters of mobile particles found in our coldest simulation.It is evident from thefigure that these clusters cannot be described as compact,as often supposed either implicitly or explic-itly in phenomenological models of dynamically hetero-geneous liquids[13,44].Instead,the clusters formed by the mobile particles appear to have a disperse,string-like nature.As discussed in[8],a preliminary calculation of the fractal dimension of the clusters,although hampered by a lack of statistics,indicates that the clusters have a fractal dimension close to1.75,similar to that for both self-avoiding random walks and the backbone of a ran-dom percolation cluster in three dimensions[45].In Ref.[8],it was shown that this quasi-one-dimensionality appears to arise from the tendency for mobile particles to follow one another.This is demon-strated in Fig.16,where we plot the time-dependent pair correlation function for the mobile particles,g MM(r,t∗) for different temperatures.At t=0,this function co-incides with g MM(r)in Fig.11.For t>0,the nearest neighbor peak moves toward r=0,demonstrating that a mobile particle that at t=0is a nearest neighbor of an-other mobile particle tends to move toward that particle at later times.Wefind that the peak at r=0is highest near t=t∗,and decreases for later times.A small but discernable peak at r=0is also present in g(r,t∗)[46]. Fig.17shows a cluster of mobile particles at two dif-ferent times,t=0and t=t∗,to demonstrate the coop-erative,string-like nature of the particle motion.In a manner identical to our analysis of the mobile par-ticles,we define as immobile the5%of the A particles that have the lowest value ofµ.The pair correlation func-tion g II(r)between immobile particles shown in Fig.18 shows that these particles also tend to be spatially corre-lated.It is interesting to note that while the maxima in g II(r)are higher at all T than the corresponding max-ima in g AA(r),the depth of the minima does not change appreciably for the lowest temperatures.Fig.19shows the ratioΓ(r)=[g II(r)/g AA(r)]−1as a function of r. In contrast to what wefind for the most mobile parti-cles,the correlation between immobile particles does not show any evidence of singular behavior as T decreases. Instead,the correlation appears to grow and then“satu-rate”to some limiting behavior for all T<0.468.More-over,Fig.19shows that the local structure of the liquid appears to be more ordered in the vicinity of an immobile A particle than in the vicinity of a mobile A particle.In Fig.20we show the size distribution of the clusters of immobile particles,formed with the same rule used for the mobile ones.One of the largest clusters found at T=0.4510is shown in Fig.21.In the inset of Fig.20we show the mean cluster size S versus T−T c.Wefind that the mean cluster size of immobile particles is relatively constant with T.This may be because immobile parti-cles are relatively well-packed,and cannot grow beyond some limiting size[47].Or,these clusters may be the “cores”of larger clusters of particles with small displace-ments,that may grow with decreasing T.To elucidate this,more particles(e.g.the next5%higher mobility) should be included in the analysis.We will return to this important point and provide further relevant data in the next section.The correlation between mobile and immobile parti-cles,measured by the pair correlation function g MI(r) (Fig.22),shows that mobile and immobile particles are anti-correlated.A comparison between g MI(r)and g AA(r),shown in Fig.23,demonstrates that,over several interparticle distances,the probability tofind an immo-bile A particle in the vicinity of a mobile one is lower than the probability tofind a generic A particle.The figure also shows that the characteristic length scale of the anticorrelation grows with decreasing T.This length scale does not show a tendency to diverge as T c is ap-proached.In particular,the curves for the two coldest runs(and closest to T c)are almost coincident.VII.LOCAL ENERGY AND LOCALCOMPOSITION VS.MOBILITYWe have seen in the previous section that despite the lack of a growing static correlation,a growing dynamical correlation—characterizing spatial correlations between particles of similar mobility—does exist.These corre-lations must therefore arise from subtle changes in the local environment that are not completely captured by the usual static pair correlation function.In this Sec-tion,we calculate several quantities to elucidate whether the mobility of a particle is related to its potential energy, and to the composition of its local neighborhood.In Fig.24we show the distributions of the potential energies of the5%most mobile,5%least mobile,and all particles at T=0.4510,calculated at the beginning of an arbitrary time interval[t,t+t∗].The distributions have been normalized such that the area under each curve is one.The distributions differ by a small relative shift of the mean value,approximately3%for the high mobil-ity distributions and somewhat less for the low mobility distribution.Wefind that the magnitude of the shift in-creases with decreasing T,but the relative shift appears to be independent of T.Since the liquid is in equilibrium, this shift will vanish for t→∞.Thus,not suprisingly, mobile particles are those that in a time t∗are able to rearrange their position so as to lower their potential en-ergy.It is worth noting that the mobility does not show any correlation with the kinetic energy of the particles measured at t=0.The kinetic energy distributions of the subsets with different mobility coincide exactly with the average distribution,showing that the mobility can-not be related to the presence of“hot spots”in the liquid. We next divide the entire population of A particles into 20subsets,each composed of5%of the particles.In the first subset we put the5%of the particles with the highest values ofµ(the mobile particles defined above),in the second subset the next5%,and so on.The last subset thus contains the5%most immobile particles.In Fig.25 we plot(on the x-axis)the average mobility of each subset versus(on the y-axis)the average potential energy of that subset at t=0.Wefind that the subset with the lowest mobility is also the one with the lowest potential energy. We alsofind that as the potential energy increases,the mobility increases.We see from thefigure that the mobile particles are the subset with the highest average potential energy at t=0.Two more points are worth noting in Fig.25.First, at all T the mobile particles move,on average,approx-imately one interparticle distance in the time interval [0,t∗].Second,for all T the difference in both mobil-ity and potential energy between the5%most mobile particles and the next subset is significantly larger than between any other two consecutive subsets.This obser-vation suggests that the choice of5%,while arbitrary,is a reasonable one.As shown in thefigure,the separation between the5%most mobile particles and the next sub-set shows a tendency to grow with decreasing T.Note however,that the distance between the lowest mobility subset and the next subset decreases with decreasing T, making it very difficult in the current approach to define an appropriate subset containing particles whose mobil-ity is distinctly lower than the rest.This,together with the result that the mean cluster size of immobile parti-cles is relatively constant over the range of temperatures studied,suggests that our analysis of the lowest subset is inadequate to fully characterize clusters of particles which do not move a substantial distance[48].Thus we see that the gross structural information con-。