变异量数样本标准差MeasuresofVariation
统计学专业名词中英对照
design of experiment实验设计
deviation from the mean离均差
diagnose accordance rate诊断符合率
difference with significance差别不显著
difference with significance差别显著
absence rate缺勤率
absolute number绝对数
absolute value绝对值
accident error偶然误差
accumulated frequency累积频数
alternative hypothesis备择假设
analysis of data分析资料
analysis of variance(ANOVA)方差分析
completely random design完全随机设计
confidence interval可信区间,置信区间
confidence level可信水平,置信水平
confidence limit可信限,置信限
constituent ratio构成比,结构相对数
continuity连续性
control对照
discrete variable离散变量
dispersion tendency离中趋势
distribution分布、分配
E
effective rate有效率
eigenvalue特征值
enumeration data计数资料
equation of linear regression线性回归方程
error误差
error of replication重复误差
统计学专业名词中英对照
coefficient of variation变异系数
left-skewed左偏
negative-skewed负偏
right-skewed右偏
positive-skewed正偏
contingency table列联表
sampling distribution (of a statistic)(某个统计量的)抽样分布
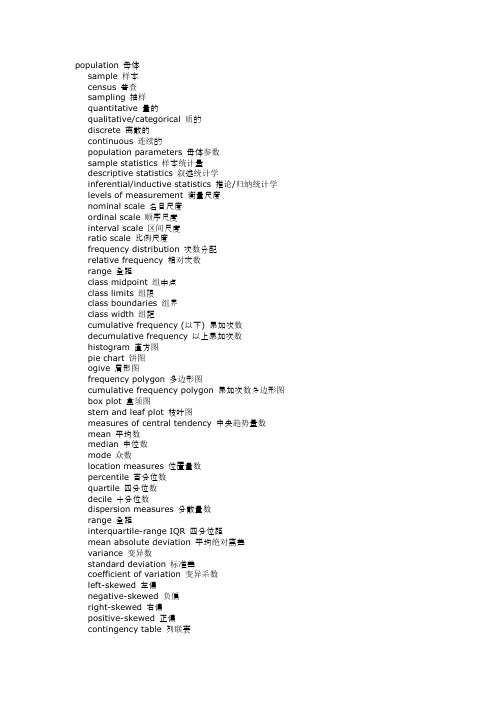
population母体
sample样本
census普查
sampling抽样
quantitative量的
qualitative/categorical质的
discrete离散的
continuous连续的
population parameters母体参数
sample statistics样本统计量
descriptive statistics叙述统计学
logarithmic normal distribution对数正态分布
logarithmic scale对数尺度
lognormal distribution对数正态分布
lower limit下限
M
matched pair design配对设计
mathematical statistics数理统计(学)
H
histogram直方图
homogeneity of variance方差齐性
homogeneity test of variances方差齐性检验
hypothesis test假设检验
hypothetical universe假设总体
I
incidence rate发病率
incomplete survey非全面调检
measures of variation在统计中的意思

measures of variation在统计中的意思
在统计学中,变异度(variation)是用来衡量数据集中的个体
或变量之间差异程度的指标。
变异度通常衡量数据分布的离散程度或分散程度,可以帮助了解数据集中的差异程度和变异程度。
常见的衡量变异度的指标有:
1. 范围(range):表示数据集的最大值和最小值之间的差异。
范围越大,数据集的变异度越高。
2. 方差(variance):表示数据集中每个数据点与其均值之差
的平方和的平均值。
方差越大,数据集的变异度越高。
3. 标准差(standard deviation):是方差的平方根,用于衡量
数据集中个体或变量相对于均值的平均偏离程度。
标准差越大,数据集的变异度越高。
4. 百分位数(percentile):用于衡量数据集中各个百分比位置处的数据点。
百分位数可以衡量整体数据分布的形状和变异度。
5. 四分位数(quartiles):包括三个数值,将数据集分为四个
等分,可用于衡量数据集的离散程度。
这些指标提供了不同角度和层次上的变异度度量方式。
通过对数据集的变异度进行分析和比较,可以更好地理解数据分布的特征和差异。
变异数与标准差

变异数与标准差1. 介绍在统计学中,变异数和标准差是衡量一组数据离散程度的重要指标。
它们可以帮助我们理解数据的分布以及数据点之间的差异。
在本文档中,我们将深入探讨变异数和标准差的概念、计算方法和应用。
2. 变异数2.1 概念变异数是一组数据离散程度的度量指标,它描述了数据集中数据点与其平均值之间的差异程度。
通俗来说,变异数越大,数据点之间的差异越大,反之亦然。
2.2 计算方法计算变异数的方法很简单,我们只需要依次将每个数据点与平均值的差异平方,并将所有差异平方的和除以数据点的个数即可。
下面是计算变异数的公式:\[ \text{Var}(X) = \frac{\sum_{i=1}^{n}(X_i - \bar{X})^2}{n} \]其中,\( X_i \) 表示第 i 个数据点,\( \bar{X} \) 表示平均值,n 表示数据点的个数。
2.3 应用变异数在实际应用中有着广泛的使用。
它可以用于比拟不同数据集之间的离散程度,从而帮助我们选择适宜的数据集来进行分析。
此外,变异数还可以用于评估某一组数据的稳定性,当变异数较大时,数据集的稳定性较差,反之亦然。
3.1 概念标准差是变异数的平方根,它可以进一步衡量数据集中数据点之间的差异程度。
标准差和变异数一样,也是描述数据的离散程度的重要指标。
3.2 计算方法计算标准差的方法很简单,我们只需要将变异数取平方根即可。
下面是计算标准差的公式:\[ \text{SD}(X) = \sqrt{\text{Var}(X)} \]其中,\( \text{SD}(X) \) 表示标准差,\( \text{Var}(X) \) 表示变异数。
标准差在实际应用中有着广泛的使用。
它可以帮助我们判断数据集中数据点的分布情况以及数据点之间的相似性。
当标准差较大时,数据点之间的差异较大,反之亦然。
因此,标准差可以用于筛选出符合特定条件的数据点,从而进行进一步分析。
4. 总结变异数和标准差是统计学中用于描述一组数据离散程度的重要指标。
卫生统计学名词解释

脉搏(次/分)、血压(KPa)等。
(2)计数资料:将观察单位按某种属性或类别分组,所得的观察单位数称为计数资料
(count data)。计数资料亦称定性资料或分类资料。其观察值是定性的,表现为互不相容的
值,记为P(A),P(A)越大,说明A事件发生的可能性越大。0﹤P(A)﹤1。
频率:在相同的条件下,独立重复做n次试验,事件A出现了m次,则比值m/n称为随
机事件A在n次试验中出现的频率(freqency)。当试验重复很多次时P(A)= m/n。
6.随机误差:随机误差(random error)又称偶然误差,是指排除了系统误差后尚存的
3、生存时间:是任何两个有联系事件之间的时间间隔。
4、截尾值:指在随访过程中,由于某种原因未能观察到病人的明确结局(即终止事件),所以不知道该病人的确切生存时间,它提供的生存时间的信息是不完全的。
5、生存函数:又称为累积生存率,简称生存率。表示具有协变量X的观察对象其生存时间T大于时间t的概率,常用S(t,X)=P(T>t,X)表示。
3均方:每种来源的离均差平方和用相应的自由度去除,可得到平均的离均差平方和,简称均方(mean square,MS)
4、LSD-t检验:即最小显著性差异t检验,适用于一对或几对在专业上有特殊意义的样本均数间的比较。
5、SNK(student-Newman-Keuls)法:又称q检验,是根据q值的抽样分布作出统计推论,适用于多个样本均数两两之间的全面比较。
3、Q型聚类:又称样品聚类,是指将n个样品归类的方法,其目的是找出样品间的共性。
1、潜在变量(latent variable):不能或不易直接观测得到的变量。这种变量往往是根据某种理论假设的。如:交感神经等。
统计学专业名词中英对照

population 母体sample 样本census 普查sampling 抽样quantitative 量的qualitative/categorical 质的discrete 离散的continuous 连续的population parameters 母体参数sample statistics 样本统计量descriptive statistics 叙述统计学inferential/inductive statistics 推论/归纳统计学levels of measurement 衡量尺度nominal scale 名目尺度ordinal scale 顺序尺度interval scale 区间尺度ratio scale 比例尺度frequency distribution 次数分配relative frequency 相对次数range 全距class midpoint 组中点class limits 组限class boundaries 组界class width 组距cumulative frequency (以下) 累加次数decumulative frequency 以上累加次数histogram 直方图pie chart 饼图ogive 肩形图frequency polygon 多边形图cumulative frequency polygon 累加次数多边形图box plot 盒须图stem and leaf plot 枝叶图measures of central tendency 中央趋势量数mean 平均数median 中位数mode 众数location measures 位置量数percentile 百分位数quartile 四分位数decile 十分位数—dispersion measures 分散量数range 全距interquartile-range IQR 四分位距mean absolute deviation 平均绝对离差variance 变异数standard deviation 标准差coefficient of variation 变异系数left-skewed 左偏negative-skewed 负偏right-skewed 右偏positive-skewed 正偏contingency table 列联表sampling distribution (of a statistic)(某个统计量的) 抽样分布point estimate 点估计值point estimator 点估计式unbiased estimator 不偏点估计式efficient estimator 有效点估计式consistent estimator 一致点估计式confidence level 信赖水准confidence interval 信赖区间null hypothesis 虚无假设alternative hypothesis 对立假设left-tailed test 左尾检定right-tailed test 右尾检定two-tailed test 双尾检定test statistic 检定统计量critical value 临界值Aabscissa 横坐标absence rate 缺勤率absolute number 绝对数absolute value 绝对值accident error 偶然误差accumulated frequency 累积频数alternative hypothesis 备择假设analysis of data 分析资料analysis of variance(ANOVA) 方差分析arith-log paper 算术对数纸arithmetic mean 算术均数assumed mean 假定均数—arithmetic weighted mean 加权算术均数asymmetry coefficient 偏度系数average 平均数average deviation 平均差Bbar chart 直条图、条图bias 偏性binomial distribution 二项分布biometrics 生物统计学bivariate normal population 双变量正态总体Ccartogram 统计图case fatality rate(or case mortality) 病死率census 普查chi-sguare(X2) test 卡方检验central tendency 集中趋势class interval 组距classification 分组、分类cluster sampling 整群抽样coefficient of correlation 相关系数coefficient of regression 回归系数coefficient of variability(or coefficieut of variation) 变异系数collection of data 收集资料column 列(栏)combinative table 组合表combined standard deviation 合并标准差combined variance(or poolled variance) 合并方差complete survey 全面调查completely correlation 完全相关completely random design 完全随机设计confidence interval 可信区间,置信区间confidence level 可信水平,置信水平confidence limit 可信限,置信限constituent ratio 构成比,结构相对数continuity 连续性control 对照control group 对照组coordinate 坐标—correction for continuity 连续性校正correction for grouping 归组校正correction number 校正数correction value 校正值correlation 相关,联系correlation analysis 相关分析correlation coefficient 相关系数critical value 临界值cumulative frequency 累积频率Ddata 资料degree of confidence 可信度,置信度degree of dispersion 离散程度degree of freedom 自由度degree of variation 变异度dependent variable 应变量design of experiment 实验设计deviation from the mean 离均差diagnose accordance rate 诊断符合率difference with significance 差别不显著difference with significance 差别显著discrete variable 离散变量dispersion tendency 离中趋势distribution 分布、分配Eeffective rate 有效率eigenvalue 特征值enumeration data 计数资料equation of linear regression 线性回归方程error 误差error of replication 重复误差error of type II Ⅱ型错误,第二类误差error of type I Ⅰ型错误,第一类误差estimate value 估计值event 事件experiment design 实验设计experiment error 实验误差experimental group 实验组extreme value 极值—Ffatality rate 病死率field survey 现场调查fourfold table 四格表freguency 频数freguency distribution 频数分布GGaussian curve 高斯曲线geometric mean 几何均数grouped data 分组资料Hhistogram 直方图homogeneity of variance 方差齐性homogeneity test of variances 方差齐性检验hypothesis test 假设检验hypothetical universe 假设总体Iincidence rate 发病率incomplete survey 非全面调检indepindent variable 自变量indivedual difference 个体差异infection rate 感染率inferior limit 下限initial data 原始数据inspection of data 检查资料intercept 截距interpolation method 内插法interval estimation 区间估计inverse correlation 负相关Kkurtosis coefficient 峰度系数Llatin sguare design 拉丁方设计least significant difference 最小显著差数—least square method 最小平方法,最小乘法leptokurtic distribution 尖峭态分布leptokurtosis 峰态,峭度linear chart 线图linear correlation 直线相关linear regression 直线回归linear regression eguation 直线回归方程link relative 环比logarithmic normal distribution 对数正态分布logarithmic scale 对数尺度lognormal distribution 对数正态分布lower limit 下限Mmatched pair design 配对设计mathematical statistics 数理统计(学)maximum value 极大值mean 均值mean of population 总体均数mean square 均方mean variance 均方,方差measurement data 讲量资料median 中位数medical statistics 医学统计学mesokurtosis 正态峰method of least squares 最小平方法,最小乘法method of grouping 分组法method of percentiles 百分位数法mid-value of class 组中值minimum value 极小值mode 众数moment 动差,矩morbidity 患病率mortality 死亡率Nnatality 出生率natural logarithm 自然对数negative correlation 负相关negative skewness 负偏志no correlation 无相关—non-linear correlation 非线性相关non-parametric statistics 非参数统计normal curve 正态曲线normal deviate 正态离差normal distribution 正态分布normal population 正态总体normal probability curve 正态概率曲线normal range 正常范围normal value 正常值normal kurtosis 正态峰normality test 正态性检验nosometry 患病率null hypothesis 无效假设,检验假设Oobserved unit 观察单位observed value 观察值one-sided test 单测检验one-tailed test 单尾检验order statistic 顺序统计量ordinal number 秩号ordinate 纵坐标Ppairing data 配对资料parameter 参数percent 百分率percentage 百分数,百分率percentage bar chart 百分条图percentile 百分位数pie diagram 园图placebo 安慰剂planning of survey 调查计划point estimation 点估计population 总体,人口population mean 总体均数population rate 总体率population variance 总体方差positive correlation 正相关positive skewness 正偏态—power of a test 把握度,检验效能prevalence rate 患病率probability 概率,机率probability error 偶然误差proportion 比,比率prospective study 前瞻研究prospective survey 前瞻调查public health statistics 卫生统计学Qquality eontrol 质量控制quartile 四分位数Rrandom 随机random digits 随机数字random error 随机误差random numbers table 随机数目表random sample 随机样本random sampling 随机抽样random variable 随机变量randomization 随机化randomized blocks 随机区组,随机单位组randomized blocks analysis of variance 随机单位组方差分析randomized blocks design 随机单位组设计randomness 随机性range 极差、全距range of normal values 正常值范围rank 秩,秩次,等级rank correlation 等级相关rank correlation coefficent 等级相关系数rank-sum test 秩和检验rank test 秩(和)检验ranked data 等级资料rate 率ratio 比recovery rate 治愈率registration 登记regression 回归regression analysis 回归分析—regression coefficient 回归系数regression eguation 回归方程relative number 相对数relative ratio 比较相对数relative ratio with fixed base 定基比remainder error 剩余误差replication 重复retrospective survey 回顾调查Ridit analysis 参照单位分析Ridit value 参照单位值Ssample 样本sample average 样本均数sample size 样本含量sampling 抽样sampling error 抽样误差sampling statistics 样本统计量sampling survay 抽样调查scaller diagram 散点图schedule of survey 调查表semi-logarithmic chart 半对数线图semi-measursement data 半计量资料semi-guartile range 四分位数间距sensitivity 灵敏度sex ratio 性比例sign test 符号检验significance 显著性,意义significance level 显著性水平significance test 显著性检验significant difference 差别显著simple random sampling 单纯随机抽样simple table 简单表size of sample 样本含量skewness 偏态slope 斜率sorting data 整理资料sorting table 整理表sources of variation 变异来源square deviation 方差standard deviation(SD) 标准差—standard error (SE) 标准误standard error of estimate 标准估计误差standard error of the mean 均数的标准误standardization 标准化standardized rate 标化率standardized normal distribution 标准正态分布statistic 统计量statistics 统计学statistical induction 统计图statistical inference 统计归纳statistical map 统计推断statistical method 统计地图statistical survey 统计方法statistical table 统计调查statistical test 统计表statistical treatment 统计检验stratified sampling 统计处理stochastic variable 分层抽样sum of cross products of 随机变量deviation from mean 离均差积和sum of ranks 秩和sum of sguares of deviation from mean 离均差平方和superior limit 上限survival rate 生存率symmetry 对称(性)systematic error 系统误差systematic sampling 机械抽样Tt-distribution t分布t-test t检验tabulation method 划记法test of normality 正态性检验test of one-sided 单侧检验test of one-tailed 单尾检验test of significance 显著性检验test of two-sided 双侧检验test of two-tailed 双尾检验theoretical frequency 理论频数theoretical number 理论数treatment 处理—treatment factor 处理因素treatment of date 数据处理two-factor analysis of variance 双因素方差分析two-sided test 双侧检验two-tailed test 双尾检验type I error 第一类误差type II error 第二类误差typical survey 典型调查Uu test u检验universe 总体,全域ungrouped data 未分组资料upper limit 上限Vvariable 变量variance 方差,均方variance analysis 方差分析variance ratio 方差比variate 变量variation coefficient 变异系数velocity of development 发展速度velocity of increase 增长速度Wweight 权数weighted mean 加权均数Zzero correlation 零相关欢迎下载11。
最新医学统计学 名词解释 精心整理(带英文)

同质(Homogeneity):医学研究对象具有的某种共性。
变异(Variation) :同质研究对象变量值之间的差异。
总体(Population):根据研究目的确定的所有同质的观察单位某项观测值的全体称为总体。
样本(Sample):来自于总体的部分观察单位的观测值称为样本。
参数(Parameter):由总体中全部观测值所计算出的反映总体特征的统计指标。
统计量(Statistic):由样本观测值所计算出的反映样本特征的统计指标。
变量(Variable) :指观察单位的某项特征。
它能表现观察单位的变异性。
概率(Probability):是随机事件发生可能性大小,用P表示,其取值为[0,1]。
频率(Frequency) :在相同的条件下,独立地重复做n次试验,随机事件A 出现m次,则比值m/n为随机事件A出现的频率。
随机误差(Random error):是由于一系列实验或观察条件等因素的随机波动造成的测量值与真实值之间的差异。
随机误差是不可避免的,且大小和方向都不固定。
抽样误差(Sampling error):由个体变异产生、随机抽样造成的若干个样本统计量之间以及样本统计量与总体参数之间的差异称为抽样误差。
系统误差(Systematic error) :实际观测中,由于仪器未校正,测量者感官的某种偏差,医生掌握疗效标准偏高或偏低等,而使观测值有方向性、系统性或周期性地偏离真值。
四分位数间距(Quartile range) :上四分位数与下四分位数的差值,用Q 表示。
通常用来描述偏态分布资料的离散趋势。
变异系数(Coefficient of variation) CV :是标准差与均数之比,用于比较测量单位不同或均数相差较大的两组或以上数据的离散程度。
参考值范围(Reference range) :绝大多数“正常人”的解剖、生理、生化等某项指标的波动范围。
构成比(Proportion) :表示事物内部某一组成部分观察单位数与该事物各组成部分的观察单位总数之比,用以说明事物内部各组成部分所占的比重。
统计学试题及答案
一、名词解释1.总体(population)2.样本(sample)3.同质(homogeneity)4.变异(variation)5.参数(parameter)6。
统计量(statistic)7.抽样误差(sampling error)8.概率(probability)二、最佳选择题1。
若以舒张期血压≥90mmHg为高血压,调查某地100人,其中有36名高血压患者,此资料为( B ) A.计量资料B.计数资料C。
等级资料D.以上都不是2。
参数( D )A。
由样本数据计算得到的统计指标 B.无法由样本信息推测C。
任何情况,都无法计算D。
反映总体统计特征的量值3.资料类型转换( A )A。
计量资料可以转换为计数资料B。
计量资料不可以转换为等级资料C.等级资料可以转换为计量资料D.资料类型不可以互相转换4。
属于计量资料的是( D )A。
血型B。
病情程度C。
职业D。
细胞计数5。
通过样本信息推断总体特征,要求样本(D)A。
总体中的一部分B。
总体外的一部分C。
总体中随意部分D。
总体中的随机部分二、是非题1。
所谓“随机”就是“随意"或“随便"的意思. ( ×)2.样本是从总体中随机抽取的一部分观察对象。
(√ )3。
统计学中的变异是指研究对象有异常. ( ×)4。
小概率事件是指某随机事件发生概率小于等于0。
05的事件。
( ×)5。
同质的观测值之间无差异。
(×)参考答案一、名词解释(略)二、最佳选择题1。
B2。
D 3.A 4.D5。
D三、是非题1.×2。
√3。
×4.×5。
×一、名词解释1.均数(arithmetic mean)2.几何均数(geometricmean)3。
中位数(median)4。
百分位数(percentile)5.四分位数间距(quartilerange)6.方差(variance)7.变异系数(coefficient of variation)8.标准差(standard deviation)9。
- 1、下载文档前请自行甄别文档内容的完整性,平台不提供额外的编辑、内容补充、找答案等附加服务。
- 2、"仅部分预览"的文档,不可在线预览部分如存在完整性等问题,可反馈申请退款(可完整预览的文档不适用该条件!)。
- 3、如文档侵犯您的权益,请联系客服反馈,我们会尽快为您处理(人工客服工作时间:9:00-18:30)。
Example
❖ 10名學生目測書本的長度如下表,求其算術 平均數與平均差
❖ 標準差(Population)
標準差顯示觀測值與平均數的距離。」為總數 標準差的平方即為變異數。σ
❖ 樣本(Sample)標準差的計算公式
2
XX s
n -1
n-1 caused smaller denominator which produce large overall variance and SD statistics, which will be more accurate estimate the population parameters.
Why 變異量數?
❖ 要了解某個團體的分數的分配情形,光是知 道它的集中情形是不夠的,還需要知道它的 分散情形才可以
❖ 例如: 班級程度參差不齊與班級程度能力接近 所得的成績
❖ 全距 ❖ 平均差 ❖ 標準差 ❖ 四分差
常用變異量數
❖ 全距(Range)
觀察值資料中,最大值與最小值之差: Range=max-min
求以下分數之變異數及標準差
樣本變異數 (variance)
❖s2
變異量愈大,s 愈大
四分位差(Interquartiles Range;
IQR)
❖ Q代表一段距離,並不是一個點,距離愈長, 即表示分數愈分散
變異係數(Coefficient of relative
variation)
v 可以用來比較團體間 相對變異量大小的指 標
全距優缺點
❖ 當研究者只想大略粗估團體分數的分散情形 或只想知道極端分數的差距時,才會使用全 距
❖ (1 3 5 5 5 5 5 5 5 7 9) 和 (2 3 4 5 6 7 8 9 9 10) 哪一組分散情形較大?
平均差
❖ 團體中各分數與平均數之差的絕對值之合的 平均數。這種算法最主要避免離均差之合等 於零
CV S *100 X
變異係數在研究上的使用
❖ 有時候研究者想要了解同一群受試者在兩種 不同的情境下,接受同一種測驗時所產生的 變異情形,或兩個團體在某個變項上的平均 數相差不大時,而只想比較其個別差異的大 小
Example
❖ 已知 甲班智育平均為 89.85,標準差為6.24, 而體育平均數為87.69,標準差為2.60。試問 該班學生的這兩種成績何者的個別差異較大?
BOX Plot盒鬚圖