瑞典MALAMIRA三维探地雷达系统配套RTK设备测量与放样操作的指南v2版
地质雷达在地质灾害勘查中的应用
地质雷达在地质灾害勘查中的应用作者:梁明闭遗山来源:《西部资源》2021年第03期摘要:我国南方发生的滑坡、泥石流、岩溶塌陷等地质灾害,严重威胁人民的生命和财产安全,对这些地质灾害体空间分布的勘查和研究十分重要。
在滑坡勘查区,通过地质雷达探测,较准确推断出滑坡岩土体结构和滑动面位置;在泥石流勘查区,对于泥石流沟谷堆积物及其附近两侧山体的松散覆盖层,可以有效进行地层划分和深度解译,为判断泥石流的规模提供了重要依据;在岩溶塌陷区,利用三维地质雷达探测技术,较准确推断出隐伏土洞的空间分布形态,为岩溶塌陷的监测和防治提供较可靠的依据,具有广阔的应用前景。
关键词:三维地质雷达;滑坡;泥石流;岩溶塌陷Application of GPR in geological hazard explorationLiang Ming1,Bi Yishan21.Guangxi Zhuang Autonomous Region geological environment monitoring station,Guilin 541004,China2.Geology Team No.4 of Guangxi Zhuang Autonomic Region,Nanning 530033,ChinaAbstract: Geological disasters such as landslides,debris flows and karst collapses occur frequently in the south of China,which seriously threaten the safety of people’s lives and properties. It is very important to investigate and study the spatial distribution of these geological disasters. In the landslide exploration area,the structure of landslide rock and soil mass and the position of sliding surface can be accurately inferred through GPR detection;in the debris flow exploration area,the GPR can effectively divide the strata and interpret the depth of the debris flow gully deposits and the loose overburden of the mountains on both sides nearby,which provides an important basis for judging the scale of debris flow;in the karst collapse area,the three methods are used The 3D GPR detection technology can accurately infer the spatial distribution of the hidden soil cave,which provides a reliable basis for the monitoring and prevention of karst collapse and has a broad application prospect.Key words: 3D GPR;landslide;debris flow;karst collapse1.引言地质灾害是指在自然或者人为因素的作用下形成的,对人类生命财产、环境造成损失的地质作用(现象)。
测波雷达操作手册
WaMoS® IIWave Monitoring SystemOperating ManualVersion 3.03Installation GuideOceanWaveS GmbHMunstermannskamp 1D - 21335 LüneburgTable of Contents:1 Preface (8)2 Introduction (9)3 Technical Data (12)4 Hardware Description (14)4.1 WaMoS PCI-card (14)4.1.1 The components are: (14)4.1.3 LEDs on the PCI-card: (15)4.2 NMEA Input / Output (16)4.3 Failure Control (18)4.4 PC Watchdog (18)4.5 Antenna Motor Control (19)4.6 Alarm Interface (19)4.7 Hardware Error Logging (19)5 Control program: WinWaMoS (21)5.1 Installation (21)5.2 Program Modes (21)5.3 User Mode (21)5.3.1 Menu View (22)5.3.2 Menu Control (23)5.3.2.1 Menu Item: Configuration User Display (24)5.3.2.2 Menu Item: Start/Stop Automatic Recording (25)5.3.2.3 Menu Item: Save Screenshot (27)5.4 Install Mode (28)5.4.1 Menu Control - Menu Item: Configuration WaMoS (28)5.4.1.1 Station Setup (30)5.4.1.2 Measurement (31)5.4.1.3 Measurement Event Handling (33)5.4.1.4 Cartesian Transformation (35)5.4.1.5 Radar (37)5.4.1.6 PCI-Card (38)5.4.1.7 Program Mode (40)5.4.1.8 Quality Control (42)5.4.1.9 Calculation parameters (45)5.4.1.10 Sea state alarm (47)5.4.1.11 NMEA (48)5.4.2 Menu Control – Menu Item: Watchdog Buzzer (F4) (53)5.4.3 Menu Analysis (54)5.4.4 Menu Test (54)5.4.4.1 Test WaMoS Device ... .. (54)5.4.4.2 Test NMEA Service (55)5.4.4.3 Test WatchDog (56)5.4.4.4 Test User Display (57)5.4.4.5 Test ADC-Level (58)6 WaMoS II Data Products (59)6.1 File Name Convention (59)6.2 WaMoS II Data Formats (60)6.2.1 Polar Image Files (61)6.2.2 Cartesian Images (61)6.2.3 Two-Dimensional Wave Number Spectrum (62)6.2.4 Frequency Direction Spectrum (Frequency Theta Spectrum) (63)6.2.5 One-dimensional frequency spectrum (63)6.3 Time series of WaMoS II measurement (64)6.4 Log files of WaMoS II measurement (67)7 Configuration file: wamos.cfg (68)8 List of Notations, Symbols and Descriptions (69)9 Preventive mainenance WaMoS Processor Unit (71)Appendix1Appendix Header (74)1.1 Polar Image (74)1.1.1 Header of a Polar Image (74)1.1.2 Keywords of the Polar Header (75)1.2 Cartesian Image (76)1.2.1 Header of a Cartesian Image (76)1.2.2 Keywords of the Cartesian Header (77)1.3 Three-Dimensional Wave Number Frequency Spectrum (77)1.3.1 Header of the FFT (77)1.3.2 Keywords of the FFT Header (78)1.4 Two-Dimensional Wave Number Spectrum (79)1.4.1 Header of the Wave Parameters (79)1.4.2 Keywords of the Wave Analysis Header (80)2 Appendix Configuration File (82)2.1 Example of the configuration file: wamos.cfg (82)2.2 Example of the file: user.bat (88)2.3 Example of the file: backup.bat (88)3 Appendix Software Error Codes (89)4 Appendix Error Handling (91)FigureFigure 1: Components of WaMoS II (8)Figure 2: WaMoS II PCI card (11)Figure 3: WaMoS II wiring diagram (12)Figure 4: Functional block diagram of the WaMoS II sampling unit. (13)Figure 5: WaMoS II LEDs (14)Figure 6: WaMoS II polar image onboard the cruiser ‘Freedom of the seas’.22 Figure 7: Configuration of the display settings (23)Figure 8: WaMoS II while sampling (24)Figure 9: File dialogue to save screen shot (26)Figure 10: Station Setup tab of WaMoS II configuration menu (27)Figure 11: Measurement tab of WaMoS II configuration menu (29)Figure 12: Measurement event handling tab of configuration menu (31)Figure 13: Cartesian transformation tab of WaMoS II configuration menu (32)Figure 14: Hardware tab of WaMoS II configuration menu (33)Figure 15: ADC-Settings tab of WaMoS II configuration menu (35)Figure 16: Program Mode tab of WaMoS II configuration menu (37)Figure 17: Quality control tab of WaMoS II configuration menu (39)Figure 18: Calculation parameters tab of WaMoS II configuration menu (41)Figure 19: Sea state alarm tab of WaMoS II configuration menu (43)Figure 20: Sea state alarm window (44)Figure 21: Configuration of the NMEA of COM-port 1 (45)Figure 22: Selection of NMEA Service properties (45)Figure 23: Select NMEA service ‘Compass’ (46)Figure 24: Selection of NMEA Address (46)Figure 25: Manual selection of NMEA Address (47)Figure 26: Selection of NMEA service position (47)Figure 27: Selection of NMEA service format (48)Figure 28: Selection of NMEA service COM-port connection (48)Figure 29: Configured NMEA service (49)Figure 30: Test basic WaMoS II hardware functions (51)Figure 31: Test NMEA service (52)Figure 32: Test WatchDog Card (53)Figure 33: Activated Test WatchDog Card (53)Figure 34: Test ADC-Level (54)Figure 35: Error pop-up window indicating loss of video signal (82)Figure 36: Error pop-up window indicating loss of heading signal (82)Figure 37: Error pop-up window indicating hardware communication error.83 Figure 38: Error pop-up window indicating image size error (83)TableTable 1: WaMoS II wave and current parameters and accuracies (9)Table 2: NMEA Sentence Data Format Notation (15)Table 3: NMEA Sentence Unit Notation (16)Table 4: NMEA not standardized Sentence Description (16)Table 5: Quality index IQ (40)Table 6: WaMoS II standard products and the extensions and subdirectory.56 Table 7: Wave parameters stored in the PARA- and MPAR data files (60)Table 8: Wave parameters stored in the PEAK- and MPEK data files (61)1 PrefaceCOPYRIGHT© Copyright 2005 OceanWaveS GmbH. All rights reserved.No part of this publication may be reproduced or stored in any form, without the prior consent of OceanWaveS GmbH,Munstermannskamp1,D-21335Lüneburg, Germany.WaMoS® II and WaMoS® II Wave Monitoring System1 are registered trademarks of OceanWaveS GmbH, Lüneburg.CHANGESThis manual has been validated and reviewed for accuracy. The instructions and descriptions are accurate at the time of the production of this manual. The material in this manual is for information only and is subject to change without notice.OceanWaveS GmbH reserves the right to make changes in the product design without reservation and without notification to its users.1 WaMoS® II is a registered trademark. In the following of the manual the notation of WaMoS® II takeplace without trademark label.Changes Control PageThis section is being used as a template to control and track modifications made to this document.Modifications since version 3.02Revision Date: 17.09.2007Author: Dieter GronholzSection: 5.3 Figure 7; 8 and 9 modifiedPage number: 25; 26; 28Wrong link to appendix corrected.Section: 6.2; 6.2.1; 6.2.2; 6.2.4; 7Page number: 62; 63; 64; 65; 70Border between wind see and swell set from 10 s to 9 s.Section: 6.3Page number: 67Summary of changes: Screenshots form the new softwere implemented.2 IntroductionReal-time information about the sea state, such as wave height, wave period, wave direction,and surface currents is crucial for coastal protection and off-shore operations (e.g. oil platforms or ships). Wave Monitoring System – WaMoS II is a state-of-the-art system developed to measure the spectral sea state and surface current parameters remotely. The system is especially designed for the operation from fixed and moving platforms, and on board all types of ocean going vessels as well as coastal sites.The overall advantage of WaMoS II is,the continuous availability of wave data in very rough sea conditions even under harsh weather conditions and during night with limited visibility.The system uses the output from a standard marine X-Band radar which is typically used for traffic control and navigation purposes.WaMoS II permits objective measurements of the sea state.By analysing the spatial and temporal evolution of the radar backscatter from the sea surface the system allows to obtain unambiguous directional wave information.The measurement is based on the backscatter of microwaves from the sea surface, that is known as 'sea clutter' on common nautical radar units. All the important sea state parameters,such as significant wave height,wave periods,wave lengths and directions are derived from the unambiguous directional wave spectrum in near real time.Figure 1: Components of WaMoS II.The system consists of both hardware and software components. The hardware components are comprised of a standard marine X-Band radar,the WaMoS II Connection Box and a standard PC.The specially developed WaMoS II control program (software “WinWaMoS”), which captures and stores the sequences of radar images of the sea surface, includes the radar test routines, the configuration facilities, the wave analysis and the display, storage and data handling routines.The wave and current data are displayed graphically as well as being made available as a text output,in data files and/or remotely via modem or internet, intranet or serial line (NMEA 0183).Table 1 gives the standard wave and current parameters with the corresponding accuracies as delivered by WaMoS II. The resolution depends on the radar which is used and the installation configurations. Typical values are provided:Table 1: WaMoS II wave and current parameters and accuracies.Notes:1) Depending on which one is larger2) The first and second peak refers to the first and second energy maximum in thefrequency-direction spectrumThe system can operate in an automatic mode for unattended stand-alone wave monitoring. Data sampling and wave analysis are carried out in user-defined time intervals.WaMoS II can be operated on board moving vessels,from offshore platforms and from coastal sites.3 Technical DataWaMoS II can be connected to almost any type of marine X-Band radar. The following radars have been used successfully with WaMoS II:•FURUNO FR 2125 B•FURUNO FR 1525 MK III•JRC JMA-5526-6•JRC JMA-9823-7XA•Litton Marine System BridgeMaster E•STN-ATLAS Radarpilot Atlas 1000•RAYTHEON Pathfinder MK I•Kelvin Hughes Nucleus 2-5000/2-6000/3-5000.The list is only a short excerpt.Please contact us if you want to use a radar different from these.WaMoS II is a PCI plug in card for standard PCs. This card is easy to install to any PC providing a free PCI slot.Minimum Hardware requirement:Pentium© III with 800 MHz256 MB RAM80 GB Hard diskFigure 2 shows a picture of the WaMoS II PCI card.Figure 2: WaMoS II PCI card.The WaMoS II radar image sampling unit is connected via an isolated buffer amplifier to the radar. Four signals from the radar are required as input signals to obtain the radar images and synchronization.These signals are:―VIDEO―TRIGGER/SYNC―HEADING―BEARING.Figure 3: WaMoS II wiring diagram.4 Hardware DescriptionThe different hardware components of WaMoS II are described in this chapter.4.1 WaMoS PCI-cardFigure 4: Functional block diagram of the WaMoS II sampling unit.4.1.1 The components are:A/D-Converter High speed flash analog-to-digital converterFiFo Memory Fast FiFo (First-in-First-out) memory for radar range bursts Clock Logic Programmable clock oscillator to provide 10 – 200 MHz Control Logic CPLD (Complex Programmable Logic Device) control logic PCI-Bridge Bridge to connect the PCI bus of the PCReset Relay The integrated Watchdog uses this relay to restart the PC Connector 2 x 40 pins For the connection of additional circuits4.1.2 Principal functions:Commands are sent from the control software via the PCI-Bridge to the Control Logic. The control logic runs the sampling under its own control. The Video signal from the radar will be prepared by the signal preparation. The Control Logic controls the A/D-Converter to sample beams of the radar and stores these with the full sample frequency in the FiFo Memory. The sample frequency is provided by the clock logic and can be chosen by the software between 20 and 50 MHz in 1 MHz steps. The Control Logic also contains a Watchdog. The watchdog must be triggered by the software, otherwise it will restart the PC after a programmable time (30 sec, 20 min, 40 min or 12 h). The required radar signals for the sampling are provided by the WIBA (WaMoS Isolated Buffer Amplifier). These are Video, Trigger, Heading and Bearing. On the PCI card are two connectors for further expansions to prepare the radar signals. The PC software sends different commands to the control unit setting up the hardware and controlling the sampling process.4.1.3 LEDs on the PCI-card:On the PCI card is a section with four LEDs located, as shown in the following picture:Figure 5: WaMoS II LEDsLED Description:4.2 NMEA Input / OutputWaMoS II accepts serial inputs from navigational instruments such as compass and GPS. The inputs must comply to NMEA 0183 standard and can be enabled in the WaMoS II configuration (see chapter 5.4.1). The WaMoS II outputs are wave parameters in not standardized NMEA format.The values in NMEA sentences are separated by comma. The commas are not part of the NMEA data. The NMEA sentence starts with '$' and ends with '∗' followed by the hexadecimal check sum in the form of two ASCII characters. This check sum is calculated by exclusive disjunction the8data bits of each character in the sentence between '$' and '∗'.The NMEA sentence ends with <CR> and <LF>. These are single byte characters with ASCII values 13 (0D hex) and 10 (0A hex). These characters act as the ‘end of sentence’ marker and are not separated by a comma (i.e. they follow direct after the check sum).The values of the NMEA sentence can have three different formats:•numeric data,•alpha numeric data,•time stamps.The data types represented in the NMEA sentence description are given in Table 2.Table 2: NMEA Sentence Data Format Notation.All other characters are literal. They appear in the data as noted in the format (hyphens in date formats, colons etc.). Sentence formats also include a unit column indicating the unit of the value. The abbreviations of used units are described in the following table:Table 3: NMEA Sentence Unit Notation.The WaMoS II NMEA not standardized sentence has the format as described in the following table with a total length of 118 characters including separating commas:Table 4: NMEA not standardized Sentence Description.An example output is:$PWAM,0001.0,0006.2,0236.4,0007.2,0082.1,0237.6,0007.0,0076.9,0192.2,0007.8, 0097.1,0044.1,0007.6,2000-02-17 16:54:00*214.3 Failure ControlWhile booting, the WaMoS II PC executes BIOS, CPU and RAM/ROM tests. When the program starts an additional hardware check is performed.This check is repeated before measurement starts. Any failure (e.g. radar is disconnected) results an error message on the screen and is stored in a Log-File (‘HWERRORMMyyyy.LOG’ MM =>month yyyy => year). This file is stored in the same directory where the WinWaMoS.exe is located. This is usually C:\WinWaMoS\. The program controls the data output for plausibility (see chapter 5.4.1.8). A fail-safe potential-free relay (located in the WIBA see Figure 3) sends an alarm in case of hardware errors or power failure. If WaMoS II sends data to another system a parity check sum test is performed.4.4 PC WatchdogFor an unattended WaMoS II operation, a PC Watchdog is integrated into the PCI-card. This ensures that in case of a PC system error due to an electrical discharge (for instance), the system reboots automatically. The PC Watchdog observes the WaMoS II control program WinWaMoS by an independent logic part inside the control logic (see Figure 4) of the PCI-card. The PC Watchdog relay is connected parallel to the reset push button of the PC.A LED on the PC front panel indicates the PC Watchdog's operation:― A two Hertz flashing light indicates that the PC Watchdog is set to20 minutes.― A 0,5 Hertz flashing light indicates that the PC Watchdog is set to 12 hours.The PC Watchdog is always activated independent of the WinWaMoS program. During start up, the PC Watchdog is set to 12 hours, if WinWaMoS is in sampling mode the PC Watchdog is set to 20 minutes. This means, if WinWaMoS did not trigger the PC Watchdog during this time, the PC Watchdog will reboot the PC.A buzzer will give a warning sound 120 seconds before the PC Watchdog resets the computer to give an operator the chance to save his work or to restart the application.If the sampling mode is stopped or WinWaMoS is terminated,the PC Watchdog is set to 12 hours.a)b)Figure 6: a) Connection between PC Watchdog relay to reset push button andb) excerpt of the board pin out4.5 Antenna Motor ControlIf WaMoS II wave measurement is set to intervals (see chapter 5.4.1.2) the radar antenna can be switched on and off automatically and the radar transmitter can be switched to stand-by mode.This increases the life time of the radar and its magnetron and also saves electrical power. The switch unit is located inside the WIBA.4.6 Alarm InterfaceThe alarm interface is connected to a normal closed relay contact.If a not correctable error occurs, for instance a radar defect, the relay opens the contact. This can be used to activate an alarm circuit or an operator bell.The alarm interface can also be programmed for any kind of output parameter (e.g. critical wave height, wave length, period) to activate an external warning (see chapter 5.4.1.3). The alarm interface is also located inside the WIBA.4.7 Hardware Error LoggingIn case of an error during data sampling,transfer or analysis occurs,the corresponding error codes and error messages are logged to error files (hardware error => HWERRORMMyyyy.LOG (MM =>month yyyy => year); analysis error => ERROR.LOG). A list of error codes and the corresponding error messages can be found in the appendix of section 3 and 4.The error codes and messages are popping up as a window on the screen. This window can be closed by confirming the OK button. Independent what kind of error occurs, the WinWaMoS is always trying to repeat the measurement. The error log files are stored in the same directory where the WinWaMoS.EXE is located. This is usually C:\WinWaMoS.If an error occurs, the alarm relay inside the WIBA signals the error condition to a remote system (if connected) by a potential free contact. The error relay is safe of failure, which means that under normal operating conditions the contact is open. Hardware errors can occur when a signal of the radar is missing or has wrong information, for example due to a bad cable connection or internal failure of the radar or WaMoS II. If WinWaMoS is configured to receive NMEA data, the missing input or format errors are also logged.Format and description of HWERRORMMyyyy.LOG:Sample output:12-13-2005 08:14:48 Error CNMEACom::ConnectToCom: PurgeComm for <COM1>failed. GetLastError()=995 The I/O operation has beenaborted because of either a thread exit or an applicationrequest.@12-13-2005 10:53:17 Error CAutoRecord::ReadNMEAData: NMEA ship speed servicefailed (66) sec12-13-2005 10:54:26 Error CAutoRecord::GetImage: Failed res= -2 bearing= 0NumBytes= 0 ErrorCode= 0 resBearing= 0 resErrorCode= 0 12-13-2005 11:04:44 Error Radar Error: Start of radar failed. @Check communicationand heading signal!12-13-2005 11:06:02 Error ThreadProc_ReadDMA: Error: <ReadDMABlock: Unable toperform DMA transfer. Err=518>.12-13-2005 11:06:34 Error CPCIWamos::WaitForHeading failed.Probably no heading signal.12-13-2005 14:12:27 Error CUserDisp::ShowPTMSpectrum: File<d:\radar\fthspec\200512131410fos.pth> not found or illegalformat.Errors are logged with date and time, error code and error message. The date and time is given in the format: MM-dd-yyyy hh:mm:ss.5 Control program: WinWaMoSWinWaMoS is the software that controls the WaMoS II hardware, carries out the wave analysis and displays the results.5.1 InstallationThe WinWaMoS software will be installed by starting the ‘install.bat’ file on the WaMoS II CD-ROM. The install program creates a directory called WinWaMoS on the hard drive ‘C:\’ (e.g. C:\WinWaMoS) and copies the ‘WinWaMoS.exe’ file and the configuration file ‘wamos.cfg’ (see chapter 7) into the directory.5.2 Program ModesWinWaMoS can operate in two different running modes:•user mode(see chapter 5.3) and•the install mode (see chapter 5.4).The user mode is the basic setting of WinWaMoS.The control program ‘WinWaMoS’starts in the user mode automatically.This mode is for normal sampling activity and displays the results. The install mode allows to configure the basic measurement setup and to test the hardware.5.3 User ModeThe user mode has four menu items:•View: display of existing data sets (see 5.3.1).•Control:―configuration of the display settings (see 5.3.2.1),―start/stop the automatic data recording and wave analysis (see 5.3.2.2)―save screen-shots of the display (see 5.3.2.3).•User Display: If there are different user displays set up (see 5.3.2.1), it is possible to choose the different user settings here.•Night Display: Changes the colours and brightness for a glare-free night time display and the other way round. For a propper and easy to usenight display it is additional necessary that the monitor has a brightnessturning knob at the frontside.5.3.1 Menu ViewThe different WaMoS II wave data products (see chapter 6) can be displayed under the menu item ‘View’.These data products are:•‘Polar file’: ... shows the radar image sequence (see Figure 7). It is also possible to view Polar files wich are compressed to a ZIP-file. In thiscase the drive where the zipped polar files are stored must not be writeprotected. Also on this drive must be enough free disk space to unpackthe files which should be displayed.The files must be zipped withPKZIP25.exe and this file must be present in the WinWaMoS folder (i. e.C:\WinWaMoS\).•‘Cartesian file’: ... shows the subsection of the radar image sequence in the area from which the wave analysis is performed.•‘Wave Number Spectrum’: … shows the wave energy as a function of wave number in x- and y-direction.•‘Frequency Direction Spectrum’: ... shows the wave energy as a function of frequency and direction.•‘1D-Frequency spectrum’: ... shows the wave energy as a function of frequency.•‘Wave Parameter History’: …shows the history of selectable wave parameters (e.g. significant wave height and/or peak wave period). Inaddition the start day of the history and an according number of days canbe chosen.The selection of one of these menu items opens a file-dialogue window, containing the available data files. The selection of one or more of these data files displays sequential the data. To stop displaying or to select another data product use the break button. The display of a sequence of polar or cartesian images can be paused by using the ‘Pause’ button and continued by using the ‘Continue’ button.Figure 7: WaMoS II polar image onboard the container vessel ‘Gray Fox’.5.3.2 Menu ControlThe control menu in the user mode contains 5 menu items:•Goto Install Mode: change the program mode•Configuration User Display (see section 5.3.2.1)•Start/stop automatic recording (see section 5.3.2.2)•Save screen shot (see section 5.3.2.3)•Exit program(will end the program and requires the password 'gohome')To change the program to install mode, or to exit the program it is necessary to stop the automatic recording first.5.3.2.1 Menu Item: Configuration User Display ...The WaMoS II data display can be configured from the main menu ‘Control => Configuration User Display’. Individual settings can be saved for an unlimited amount of users.Figure 8: Configuration of the display settings.The parameters that can be displayed are 'selected' or 'deselected' in the check boxes. The order of the parameters can be changed by 'sort up' and 'sort down' buttons. For the history plots the number of days to be displayed, as well as the minimum and maximum values of the plot can be chosen. Additional the display colours for daylight as well as for night time viewing can be selected individual. Typing in a user name together with the'save changes'button will save the configuration under this name.5.3.2.2 Menu Item: Start/Stop Automatic RecordingWhen WaMoS II is set to operational measurements, it automatically records the radar image sequences and calculates the wave and surface current parameters.The procedure can be separated into the following steps:1.Sampling of the polar radar image sequences: The hardware (see chapter4) samples a sequence of digital radar images of the sea surface and storesthe sequence on the hard drive.2.Cartesian Transformation:For the wave analysis a rectangular sub-area,called the analysis area,is extracted from the full polar radar image (see chapter 6.2.1)and is transformed into cartesian coordinates(see chapter6.2.2). The size of the analysis area, its position and the length of the timeseries is configurable in the install mode under the menu item Control/ Configuration WaMoS.3.Discrete Fourier Transformation:The sequence of cartesian radar imagesis transformed into a3D-wave number frequency spectrum by applying a discrete Fourier Transformation.4.Filtering the 3D-image spectrum and surface current determination: Thedispersion relation is applied as a band-pass filter to separate the energy associated with the ocean waves from the background noise and the surface current is determined.5.Determination of the unambiguous 2D-image spectrum: The unambiguouswave-number spectrum is obtained by integrating over the frequency domain and applying a modulation transfer function (MTF). (See chapter 6.2.3).putation of the directional wave spectrum:The2D-wave numberspectrum from the wave number domain is transformed into the frequency direction domain (see section 6.2.4).7.Determination of the frequency spectrum and all other sea stateparameters(see Table 1):Several statistical wave parameters are derived from the 1D-wave spectrum (see chapter 6.2.5).8.Determination of the mean wave parameter over the chosen timeinterval: The mean 2D-wave spectrum is determined by spectral averaging.The results of the different analysis steps will be stored on the hard drive. The file name convention and the data format are described in chapter 6.1.In case of an analysis failure, the measurement is discarded. The corresponding error code and message is stored in an error log file named ‘CERRxxxx.LOG’ located also in the WaMoS II working directory (e.g.C:\WinWaMoS).Description of the analysis errors are given in appendix 3 and 4.To start the automatic recording, choose ‘Control => Start Automatic Recording’ from the main menu.Figure 9 shows the screen while in automatic recording (this is the standard setting, the appearance depends on the settings in Configuration User Display):Figure 9: WaMoS II while sampling.The example of the user display shows:•Time and status of the measurement (top left: yellow)•Current sea state parameters such as: significant wave height, peak wave period, peak wave length, and peak wave direction(middle left: red)•Radar image (bottom left).。
爱马尔水晶式遥感雷达传感器说明书
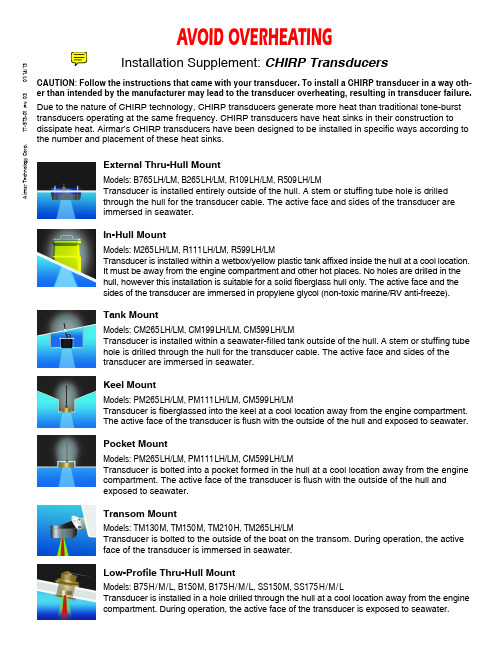
A i r m a r T e c h n o l o g y C o r p .17-573-01 r e v . 0301/14/13External Thru-Hull Mount Models: B765LH/LM, B265LH/LM, R109LH/LM, R509LH/LM Transducer is installed entirely outside of the hull. A stem or stuffing tube hole is drilledthrough the hull for the transducer cable. The active face and sides of the transducer areimmersed in seawater.In-Hull MountModels: M265LH/LM, R111LH/LM, R599LH/LMTransducer is installed within a wetbox/yellow plastic tank affixed inside the hull at a cool location.It must be away from the engine compartment and other hot places. No holes are drilled in thehull, however this installation is suitable for a solid fiberglass hull only. The active face and thesides of the transducer are immersed in propylene glycol (non-toxic marine/RV anti-freeze).Tank MountModels: CM265LH/LM, CM199LH/LM, CM599LH/LMTransducer is installed within a seawater-filled tank outside of the hull. A stem or stuffing tubehole is drilled through the hull for the transducer cable. The active face and sides of thetransducer are immersed in seawater.Keel MountModels: PM265LH/LM, PM111LH/LM, CM599LH/LMTransducer is fiberglassed into the keel at a cool location away from the engine compartment.The active face of the transducer is flush with the outside of the hull and exposed to seawater.Pocket MountModels: PM265LH/LM, PM111LH/LM, CM599LH/LMTransducer is bolted into a pocket formed in the hull at a cool location away from the enginecompartment. The active face of the transducer is flush with the outside of the hull andexposed to seawater.Transom MountModels: TM130M, TM150M, TM210H, TM265LH/LMTransducer is bolted to the outside of the boat on the transom. During operation, the activeface of the transducer is immersed in seawater.Low-Profile Thru-Hull MountModels: B75H/M/L, B150M, B175H/M/L, SS150M, SS175H/M/LTransducer is installed in a hole drilled through the hull at a cool location away from the enginecompartment. During operation, the active face of the transducer is exposed to seawater.AVOID OVERHEATINGInstallation Supplement: CHIRP Transducers CAUTION : Follow the instructions that came with your transducer. To install a CHIRP transducer in a way oth-er than intended by the manufacturer may lead to the transducer overheating, resulting in transducer failure.Due to the nature of CHIRP technology, CHIRP transducers generate more heat than traditional tone-burst transducers operating at the same frequency. CHIRP transducers have heat sinks in their construction to dissipate heat. Airmar’s CHIRP transducers have been designed to be installed in specific ways according tothe number and placement of these heat sinks.。
瑞典MALA探地雷达采集软件Groundvision2快速使用指南V2012.12

瑞典MALA探地雷达采集软件快速使用指南白雪冰V 2012.12版1、将雷达系统与电脑连接成功后,等大约5~10秒钟,这时候电脑的本地连接提示“连接受限制或无连接”,不用担心,它不影响雷达系统和电脑的连接,直接点击电脑桌面的采集软件快捷方式进入到采集软件的界面下,如果这时雷达系统与电脑连接正常的话,窗口界面工具栏的变为红色;2、点击电脑键盘的“M”键(关掉输入法),进入到的窗口下进行测量任务的设置:①首先点击,选择你要存储测试数据的路径,建议在采集前,先在电脑硬盘分区里建立好测试数据的存放文件夹;②然后点击,如果天线的光纤模块或高频模块在主机的“Slot A”位置,就选择,如果在“Slot B”,就选择,接着选择该模块的数据通道,因为我们的ProEx主机标准配置是双通道,所以有四个数据通道,“Internal”表示此模块连接天线的电磁波信号自发自收的数据通道,“External”表示此模块的天线接受另外一个模块天线的发射信号,称为它发我收的数据通道,一般来说我们都是选择“Internal”自发自收的数据通道,选择完毕后一定要在后面的点上“勾”,表示激活此通道;③选择下拉条里天线,模块上连接的是什么天线就选择什么天线,如果不知道天线的型号,可以在每个天线的铭牌上查到天线型号,对应选择就是;④选择测量方式:“Wheel”表示用测距轮触发的方式采集数据(适合于测试现场表面平整的情况),“Time”表示用时间触发的方式采集数据(适合于测试现场表面不平整的情况),“Keyboard”表示用点击电脑的回车键触发采集数据(适合于超前地质预报或野外勘察等深部探测的情况),“Wheel”和“Time”都属于连续测量,建议尽量用“Wheel”测量方式;“Keyboard”属于点测,超前地质预报或地质勘查都必须使用点测;选择“Time”和“Keyboard”则不需要进行以下⑤和⑥的选择;⑤如果是选择“Wheel”的测量方式,就要选择里的测量轮文件:250MHz、500MHz、800MHz天线的直径150mm的测量轮文件是,250MHz、500MHz、800MHz 天线的MALA测链的文件是1200 MHz、1600 MHz、2300 MHz天线的单测量轮的文件是如果是车载天线测试路面,则需要先校准一个以汽车轮胎为测量轮的文件,然后选择;⑥接着选择里测距轮的信号来源位置,如果测距轮文件是150mm的测量轮文件或MALA测链的文件,就选择“Master wheel”,如果测距轮文件是单测量轮的文件,高频模块在主机的“Slot A”位置,就选择“Slot A wheel”,高频模块在主机的“Slot B”位置,就选择“Slot B wheel”3、点击进入到接收信号参数的设置窗口:①里显示的是雷达主机当前通道连接的天线的发射和接受天线的偶极子间距,为系统默认,不能改动!②为每道脉冲的采样间隔:25 MHz和50 MHz非屏蔽天线的采样间隔一般为0.3~0.5米,适用于点测;100 MHz屏蔽天线的采样间隔一般为0.1米,适用于连续测量或点测;250 MHz屏蔽天线的采样间隔一般为0.05米,适用于连续测量;500 MHz和800 MHz屏蔽天线的采样间隔一般为0.02米,适用于连续测量;1200 MHz、1600 MHz和2300 MHz屏蔽天线的采样间隔一般为0.01米,必要时可以最小设置到0.005米(测线很短的情况下),适用于手持式连续测量;如果是车载天线进行路面测试,采样间隔一般可以设置为0.2米、0.25米或0.5米;③和这两个选项不用选择4、进入,进行单道脉冲波形的设置:①点击的滑动块,选择连接天线的相应的采样频率,这里不能直接输入采样频率,必须点击水平滑动块来选择,也可使用电脑键盘的左右键来调整,以下为各个常用天线的采样频率经验值:25 MHz天线的采样频率一般为300~400MHz50 MHz天线的采样频率一般为500~600MHz100 MHz天线的采样频率一般为1000~1200MHz250 MHz天线的采样频率一般为2500~3000MHz500 MHz天线的采样频率一般为7500~8000MHz800 MHz天线的采样频率一般为10000~12000MHz1200 MHz天线的采样频率一般为30000~35000MHz1600 MHz天线的采样频率一般为35000~40000MHz2300 MHz天线的采样频率一般为40000~45000MHz②点击来选择每个电磁脉冲信号的时窗和采样点,这里同样不能直接输入时窗和采样点,必须点击水平滑动块来选择采样点,也可使用电脑键盘的左右键来调整采样点,采样点的调整间隔是“2”,时窗是通过采样点的大小来决定,采样点越大,时窗就越大;这里存在一个公式:时窗=采样点/采样频率,采样频率一旦确定了,时窗的大小就通过采样点来调整,一般采集软件默认的电磁波在介质中的传播波速为0.1m/ns,那么每20ns就等于1米的测深,通过这个换算,我们可以很自由的定义采样点和时窗的大小,当然一般调整时窗的大小时,都要超出既定测深的10%~20%的范围,以免测试深度达不到需要的测深;③去掉的勾,调整的滑动块来调整每道脉冲的信号叠加值;如果是“Wheel”和“Time”等连续测量方式的话,选择“8”次叠加,然后打上的勾,如果是“Keyboard”的测量方式,选择“128”次叠加值,不要打的勾,意思就是每道脉冲采样点的叠加值都必须是128;④为每个天线的最大时间窗,这里不用选择,软件会根据你选择的不同天线自动默认;⑤以上设置完成后,将天线放置到测线的起点处,并贴紧(如果是车载天线测试路基或路面,就将测试车开到测试的起点处即可)后,用鼠标点击,让雷达系统自动去寻找时间剖面的零点,即让红色水平标尺对准单道脉冲波形的第一个波峰或波谷位置,如果自动对不准,可以用按住鼠标左键拖动红色标尺对准。
瑞典MALA探地雷达在管线探测中的应用

瑞典MALA探地雷达在管线探测中的应用汤博【摘要】Swedish MALA ground penetrating radar (GPR) is applied in this article has carried on the research of under-ground pipeline detection. According to the material of underground pipeline and the surrounding medium and the different choices of different embedding depth, different frequencies of the antenna at the same time set up necessary working param-eters, the different types of underground pipeline detection, and the anomaly characteristics of the engineering examples of typical pipeline are analyzed.%应用瑞典MALA探地雷达进行了地下管线探测的研究。
根据地下管线的材质、周围介质及埋设深度的不同选择,不同频率的天线同时设置必要的工作参数,对不同类型的地下管线进行了探测,并对工程实例中典型的管线异常特征进行了分析。
【期刊名称】《水科学与工程技术》【年(卷),期】2015(000)001【总页数】2页(P95-96)【关键词】MALA;探地雷达;管线探测【作者】汤博【作者单位】河北省水利水电勘测设计研究院,天津 300250【正文语种】中文【中图分类】P624探地雷达(Ground Penetrating Radar,简称CPR)是利用超高频(106~109Hz)脉冲电磁波探测地下介质分布的一种地球物理勘探方法。
第二讲 探地雷达天线系统构成与硬件参数青岛

常见探地雷达系统
国外
仪器类型
美国GSSI公司的SIR系列雷达( 美国劳雷公司代理销售) 瑞典MALA公司的RAMAC/GPR雷达系列 加拿大Sensrs&Software公司pulse EKKO型探地雷达 …….. 国内
电子部22所,青岛电波所的LTD系列,航天部爱迪尔公司、 中国矿大(北京)等单位相继推出了自己的雷达产品。
探地雷达天线
天线作用与类型
探地雷达天线的基本作用
• 发射天线:将电磁波尽量有效地发射出 去; • 接收天线:接收所要的电磁波信号; • 数学作用:是一种滤波作用
探地雷达天线
天线设计
探地雷达天线的基本作用
• 探地雷达系统
• 数学过程
探地雷达天线的基本作用
• 接受信号可以视为: R(f) = S(f)*At(f)*Ar(f)*T(f)*P(f) S(f) 发射信号 At(f) and Ar(f) 发射天线和接收天线的频谱响应 T(f) 目标体的频率响应 P(f) 雷达波传播衰减和几何扩散等响应
探地雷达系统与技术参数
曾昭发 吉林大学地球探测科学与技术学院 2018-11-8
目录
• 探地雷达系统构成
• 探地雷达仪器发展概况
• 探地雷达天线
• 探地雷达参数
探地雷达系统构成
概念结构
探地雷达系统构成
概念结构
• 1、天线系统——信号发射与接收 • 2、控制系统——产生信号、控制天线系统、信号转换 • 3、计算机系统——控制系统运行、储存数据、成
信号机制
• 控制系统 信号产生机制:时间域信号 频率域信号 频率域探地雷达(FMCW):连续波雷达根据发射 电磁波的频率特性可分为未调制连续波雷达和调制连续 波雷达这两种体制雷达; 冲击脉冲探地雷达是在时间域内进行的,硬件实现较 为简单,脉冲信号产生、传播、接收、处理都是在时间 域上进行的,能够直观的观测出探测的结果。在探地雷 达商业仪器上占据主导地位。
三维探地雷达技术在市政工程中的应用研究

三维探地雷达技术在市政工程中的应用研究赵镨【摘要】为了提高城市地下管线探测精度,对道路病害(尤其是空洞)进行提前预测,及时治理,避免或大大减少管线事故和道路塌陷事故发生,我们开展了三维探地雷达技术研究,并将其应用于城市地下管线探测、道路病害检测等市政工程领域.结果表明,由于三维探地雷达具有空间采样率高,成像准确,分辨能力强,解译技术手段丰富等优势,在城市地下管线探测、道路病害检测工作中应用效果显著.【期刊名称】《城市地质》【年(卷),期】2017(012)003【总页数】5页(P100-104)【关键词】三维探地雷达;管线探测;道路病害检测【作者】赵镨【作者单位】中国煤炭地质总局,北京 100038【正文语种】中文【中图分类】U418近年来,城市道路塌陷事件频繁发生。
北京、大连、哈尔滨、深圳、广州、南京、合肥、长沙、南宁、太原等都出现过城区道路塌陷事件,轻则影响交通,重则造成生命财产的重大损失。
特别是近5年来,全国范围城市道路塌陷灾害开始进入集中爆发期。
因此有效防范和减少我国城市道路空洞塌陷灾害的发生,保护城市公众安全和城市的可持续和谐发展,道路空洞塌陷灾害的探测与防范治理已经刻不容缓。
探地雷达作为一种非破坏性的探测技术,可以安全地用于城市建设中的工程场地,并具有较高的探测精度和分辨率,目前已在管线探测、道路病害探测等领域广泛应用。
三维探地雷达是近年来发展起来的一项新技术,可以进行高密度、快速无缝扫描。
与二维探地雷达相比,具有海量数据、真三维归位、地下物体真实还原等优势。
近年来的实践表明,其在管线探测、道路病害检测等领域,效果显著。
探地雷达是利用超高频脉冲电磁波探测地下介质分布特征的一种地球物理方法(Harry,2011)。
其工作原理是,宽带脉冲发射天线将纳秒高压脉冲源提供的电脉冲信号转化为脉冲电磁场,并以脉冲电磁波形式射向目标体。
宽带脉冲接收天线将来自目标体的反射脉冲电磁波转化为电脉冲信号传送给宽带采样器后,用显示器以时域方式显示出来,再经计算机处理后给出时域特性或频域特性显示。
瑞典MALA探地雷达操作使用和保养2009
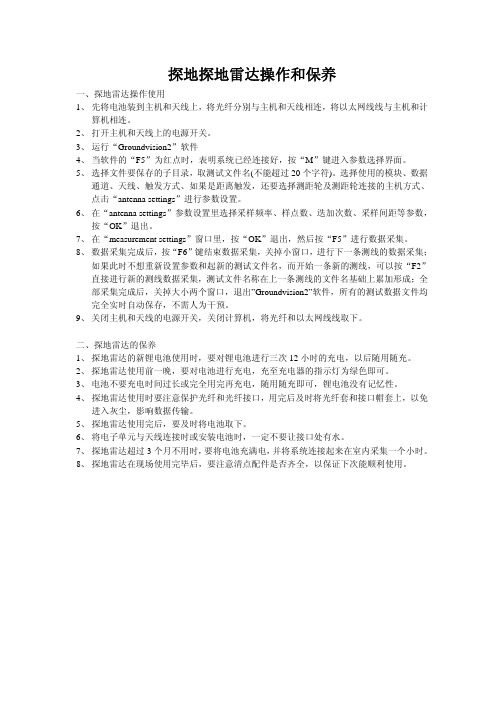
探地探地雷达操作和保养一、探地雷达操作使用1、先将电池装到主机和天线上,将光纤分别与主机和天线相连,将以太网线线与主机和计算机相连。
2、打开主机和天线上的电源开关。
3、运行“Groundvision2”软件4、当软件的“F5”为红点时,表明系统已经连接好,按“M”键进入参数选择界面。
5、选择文件要保存的子目录,取测试文件名(不能超过20个字符)。
选择使用的模块、数据通道、天线、触发方式、如果是距离触发,还要选择测距轮及测距轮连接的主机方式、点击“antenna settings”进行参数设置。
6、在“antenna settings”参数设置里选择采样频率、样点数、迭加次数、采样间距等参数,按“OK”退出。
7、在“measurement settings”窗口里,按“OK”退出,然后按“F5”进行数据采集。
8、数据采集完成后,按“F6”键结束数据采集,关掉小窗口,进行下一条测线的数据采集;如果此时不想重新设置参数和起新的测试文件名,而开始一条新的测线,可以按“F2”直接进行新的测线数据采集,测试文件名称在上一条测线的文件名基础上累加形成;全部采集完成后,关掉大小两个窗口,退出”Groundvision2”软件,所有的测试数据文件均完全实时自动保存,不需人为干预。
9、关闭主机和天线的电源开关,关闭计算机,将光纤和以太网线线取下。
二、探地雷达的保养1、探地雷达的新锂电池使用时,要对锂电池进行三次12小时的充电,以后随用随充。
2、探地雷达使用前一晚,要对电池进行充电,充至充电器的指示灯为绿色即可。
3、电池不要充电时间过长或完全用完再充电,随用随充即可,锂电池没有记忆性。
4、探地雷达使用时要注意保护光纤和光纤接口,用完后及时将光纤套和接口帽套上,以免进入灰尘,影响数据传输。
5、探地雷达使用完后,要及时将电池取下。
6、将电子单元与天线连接时或安装电池时,一定不要让接口处有水。
7、探地雷达超过3个月不用时,要将电池充满电,并将系统连接起来在室内采集一个小时。
- 1、下载文档前请自行甄别文档内容的完整性,平台不提供额外的编辑、内容补充、找答案等附加服务。
- 2、"仅部分预览"的文档,不可在线预览部分如存在完整性等问题,可反馈申请退款(可完整预览的文档不适用该条件!)。
- 3、如文档侵犯您的权益,请联系客服反馈,我们会尽快为您处理(人工客服工作时间:9:00-18:30)。
瑞典MALA MIRA三维探地雷达系统
配套RTK设备测量及放样操作指南
(华星A10)v2版
20170330
一、准备工作:MIRA三维探地雷达系统及RTK设备均已安装、连接到位,开机预热;
十字校准标放置到位:
二、RTK基准站及移动站新建项目、工作模式设置调试:
1、打开iHand20手薄,点击app按键进入项目菜单
2、进入项目信息菜单
3、新建项目信息名称,然后点击确定,会自动转换到系统界面,
4、在系统界面,坐标系统选择“BJ54”
5、中央子午线可以点击十字标自动计算,也可以手动计算更改中央子午线(中央子午线=当地经度的整数÷6,然后整数部分+1,再将所得结果×6后减去3,百度可查)保存点击确认后更新参数至对应投影列表,按返回键。
6、连接并设置基准站的工作模式 连接
●平滑计算
●计算完后,拍照保留基准站的经纬度及高程坐标
设置完成后切换至移动站设置
移动站设置完成后,基准站和移动站上的通讯指示灯(中间)会一秒钟闪烁一次红灯,代表通讯正常。
三、MIRA三维探地雷达系统进行数据采集:
四、利用RTK移动站测量五个十字校准标的精确经纬度,并换算为格网座标:
1、在测量项目里选择“碎步测量”
2、测量出第一个“十字校准标”的经纬度,保存名字为“pt1”
3、进行格网座标定义的参数计算
添加“pt1”点的经纬度进行计算
计算类型选择为“三参数”
进行计算,计算完成后,点击“应用”
4、继续对剩下的四个十字校准标“pt2-pt5”进行测量并保存测试量值,这时可以用格网座标测量,保存值有格网座标和经纬度坐标
中间几个校准点测量的图片省略~~~~
5、查看存储的五个十字校准标的格网座标及经纬度坐标
五、根据rSlicer三维成像软件上缺陷位置得到的格网座标,在手簿上计算得到换算的经纬
度:
1、根据缺陷格网座标在手簿上添加放样点
●点击“→”图标进入放样点添加界面
●如图所示进行放样点添加
●第一个放样点添加成功,按同样的方法可以添加后续的放样点
2、到工具项目里选择“坐标换算”将已添加的放样点换算为经纬度
●按图片标示进行参数选择和添加放样点
●选择完毕后选择“反算”进行换算
●拍照或手动记录下放样点的经纬度(或加上高程)值,因为只有在现场用移动站定出放样
点并测量出经纬度后才能保存放样点的经纬度。
六、现场放样找点,一定先将基准站放到原始测试时的位置,找到准确的投影点,开机连
接完基准站和移动站后,先对一下基准站的经纬度和高程是否和初期测试时一致,如果不一致,要手动修改;完成后,就可以用移动站进行缺陷位置的放样找点,可以用格网座标,也可以使用经纬度进行找点。
当然最把稳的方式,最好先比对一下五个“十字校准标”中的一个点的坐标值是否跟之前的一致,一致了再去放样找点,这样保证没有问题。
(因此在最初测试一定要调平基准站的基座并现场标记清楚准确的投影点,另外在其中“pt1”校准点留一个标记。
)。