Cognos dashboard开发实例
Dashboard入门例子

Dashboard 入门Dashboard作为一个强大的数据展示工具,有很灵活的展示功能,用户可以根据自己的需要选择不同的图表,实现动态的交互展示,以及多维度数据交互作用的数据可视化。
作为数据可视化工具,最终要的当然是使用数据模块,本文中将对使用数据简单介绍一下。
1 使用数据源我们在使用Dashboard时,一般最主要的就两种数据使用方式,一种是静态的将查询结果导出到电子表格,然后在电子表格(excel)中将数据处理成你需要的格式,再使用,另一种就是通过信息设计工具,制作你需要的数据格式的universe,并将其发布到资源库,然后直接使用查询结果画图。
1.1内嵌电子表格数据假设你已经有一份需要展示的excel数据,你就可以如图一,点击导入,选择相应的文件,然后将数据导入到Dashboard的内嵌电子表格中,进行分析使用。
图一例:假设你有一份2009年到2014年各个月在某购物网站购物次数的统计结果,数据截图如下图二:图二现在你就可以画出年份数据的饼图,并且点击某一个年份时,就可以出来该选中年份的每个月详细交易次数的数据。
效果如图三:图三选中右边的年份,在左边的柱状图中展示这一年的详细数据。
详细配置条形图和饼图。
在部件中选择饼图和柱形图。
如图四中所示:图四然后配置饼图数据,因为数据结构前面看到了,是列数据,所以选择的时候我们选择列数据,如图五、六所示:在图中我们要添加红色标注部分的数据。
有图的名称,画图使用的数据,以及饼图中每一部分显示的标签。
图五这里是饼图自己显示的数据,现在我们要启用数据插入,也就是点击饼图某一部分对应的数据能够显示到柱形图中,配置如图六:图六主要起用数据插入,然后选择源数据和目标数据的单元格,这样当点击饼图时就相当于一次数据插入的触发操作。
接下来配置条形图了,一定要讲饼图的目标数据单元格与条形图的值单元格相一致,这样才会动态的在条形图中展示不同的数据。
柱形图的主要配置如图七所示:图七到这里,使用一个饼图和柱形图相互作用,具备大略信息与详细信息同图交互的图表就完成了。
Cognos报表开发

谢谢!
+ 由于mdc文件中的数据需要和数据库同步,
所以需要对mdc文件做定期更新,就需要编 写Cognos脚本来完成更新任务,再使用 Cognos自带的任务调度工具 Scheduler 来完 成定期更新。 + 脚本文件代码如下:
+ + + + + + + + + + + + + + + + + + + + + + + + + + + + + + + + + + + + + + + +
PowerPlay Enterprise Server 作为一个多 平台企业级的应用程序服务器,其功能是将 多维立方体进行统一的部署,以达到企业级 OLAP分析的目的,PowerPlay Enterprise Server 具有强大的部署能力和可扩展性,可以部署 在多台服务器上以达到负载均衡的目的。
– PowerPlay Transformation Server
+ Impromptu 模块 – Impromptu Administrator + 安全管理工具(LDAP) – Microsoft Active Direcotry Server – Netscape Directory Server
+ 一、Cognos 产品介绍 + 二、Impromptu 平面数据制作 + 三、Powerplay 多维数据体制作 + 四、Powerplay 数据立方体发布
Cognos基础知识及操作入门

调整数据库连接池大小, 以适应并发访问需求。
使用缓存技术,提高数据 访问速度。
05 报告设计技巧与实践
报告布局与样式设置方法
布局原则
遵循简洁明了、重点突出、信息完整等原则,合理规 划报告布局。
样式设置
通过调整字体、颜色、背景等样式元素,提升报告整 体视觉效果。
标题与段落
实时数据刷新机制设置方法
数据源配置
确保数据源连接正常,并设置合适的数据刷新频率。
缓存策略
合理利用缓存机制,减轻服务器负担,提高数据加载速度。
异步加载
采用异步加载技术,避免页面卡顿和数据延迟现象。
实时推送
结合WebSocket等实时通信技术,实现数据的实时推送和更新。
仪表板性能优化建议
数据预处理
在数据源端进行数据清洗、聚合等预处理操 作,减少数据传输量和计算复杂度。
最近访问
显示用户最近访问的报告或仪表板,方便快速进 入。
菜单栏与工具栏功能详解
01
菜单栏
包括文件、编辑、查看、插入、 格式、工具、窗口和帮助等菜单 项,提供全面的操作选项。
工具栏
02
03
右键菜单
提供常用功能的快捷按钮,如保 存、打印、剪切、复制、粘贴、 撤销和重做等。
在报告或仪表板中右键单击元素 ,可弹出针对该元素的特定操作 菜单。
立方体(Cube)
多维数据集的一种表现形式,由多个维度和度量组成,用于数据分析 和报表展示。
维度(Dimension)
描述数据业务特性的层级结构,如时间、地区、产品等。
度量(Measure)
用于聚合计算的数值型数据,如销售额、利润等。
多维数据集(Multidimension…
Cognos常用操作手册
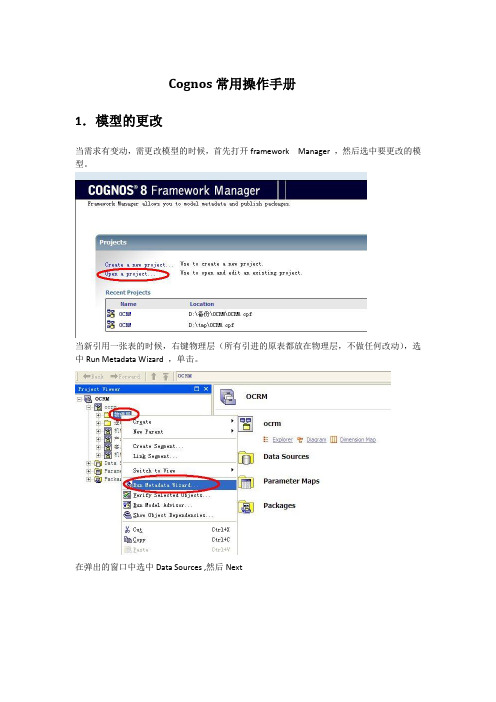
Cognos常用操作手册1.模型的更改当需求有变动,需更改模型的时候,首先打开framework Manager ,然后选中要更改的模型。
当新引用一张表的时候,右键物理层(所有引进的原表都放在物理层,不做任何改动),选中Run Metadata Wizard ,单击。
在弹出的窗口中选中Data Sources ,然后Next选中数据源,单击Next选中OCRMINST展开,展开后选中所要添加表的表名选中后,选择下面的的第一项import and create a unique name ,点击确定去掉前面的钩,不把表所带的任何关系引进来(一般都是引进表之后,自己建立关系)点击import后,导入之后点击finish。
这样就完成表的导入。
接下来完成对表的汉化(翻译),右键逻辑层(对表进行一些加工,抽取有用的字段,过滤所需要的数据等等)选择creat—>Query Subject。
填写表名,单击ok点击后拖拽到右边即可,选好后ok。
如果要对某个字段进行加工计算时(如通过汇率转换币种),单击右下角的add填写字段名称,选好加工字段后,左边的标签切换到Funotions(一些常用的函数),个字段也可以直接翻译。
接下来是展示层(就是打包后能给报表制作人员看的部分),首先在根目录ocrm下,右键create—>Namespace(这是在建模型时为了划分不同的主题,而建多个namespace,但是如果添加的表属于某个名字空间下,那么直接加到他的目录下,不用新建一个新的namespace。
如果是要单独成立一个主题,那么就需要新建一个namespace),建好namespace或选好namespace后,右键单击新建一个Query Subject,之后的步骤跟上面在逻辑层汉化一张表的步骤一样,唯一不同的就是不需要再进行一次汉化了。
这样一张新表从数据源中就引到模型中,进行了汉化和展示。
2.表与表之间建立关系选中两张要建关系的表,右键单击选中Create Relationship,选好相关联的字段,和关系类型(1:1&1:n&n:1…)确定3.切换的数据源如果数据源改变,模型也可以切换数据源,但要保证所切换的数据源要有与模型里的表相同的表名。
2024年Cognos中级培训教程

Cognos中级培训教程引言:本文档旨在为Cognos软件的中级用户提供一个全面且系统的培训教程。
通过对Cognos中级功能的深入讲解和实际操作示例,帮助用户提升数据处理和分析的能力,进一步挖掘Cognos的强大功能。
本教程适用于已经具备Cognos基础使用经验的用户,通过本文档的学习,用户将能够熟练掌握Cognos的中级功能,并能够进行更复杂的数据分析和报告制作。
第一部分:Cognos建模1.1数据库连接和模型创建在Cognos中,建模是进行数据分析和报告制作的基础。
我们需要建立与数据库的连接,并创建相应的数据模型。
在本节中,我们将介绍如何连接数据库,以及如何创建和编辑数据模型。
1.2数据源和模型管理Cognos提供了丰富的数据源和模型管理功能,用户可以方便地管理和维护数据模型。
在本节中,我们将介绍如何导入和导出数据模型,如何进行数据源的备份和恢复,以及如何进行数据模型的权限管理。
第二部分:Cognos报告制作2.1报告设计Cognos提供了强大的报告设计功能,用户可以根据需求创建各种类型的报告。
在本节中,我们将介绍如何创建和编辑报告,如何使用各种报告元素(如表格、图表、文本框等),以及如何进行报告布局和格式设置。
2.2报告查询和过滤在Cognos中,用户可以通过查询和过滤功能对数据进行筛选和排序,以便更好地展示和分析数据。
在本节中,我们将介绍如何使用Cognos的查询和过滤功能,包括如何设置查询条件、如何使用过滤器和如何进行数据排序。
2.3报告交互和钻取Cognos提供了丰富的报告交互和钻取功能,用户可以与报告进行交互,并查看更详细的数据信息。
在本节中,我们将介绍如何设置报告的交互功能,如何使用钻取功能查看详细数据,以及如何使用参数和提示器进行数据交互。
第三部分:Cognos高级功能3.1多维数据分析Cognos提供了多维数据分析功能,用户可以从多个维度对数据进行深入分析。
在本节中,我们将介绍如何使用Cognos的多维数据分析功能,包括如何创建多维数据集、如何设置维度和度量,以及如何进行数据切片和切块。
Cognos资料

分页、1.拖一个一行两列的表格到报表画布中。
2.分别拖一个块对象到表格的每一列中。
3.拖一个交叉表到表格左边一列的块中。
4.拖入相应字段填充交叉表,在本例中,所用字段为cognos自带示样包中的Go Sales(query)--> Sales (query) 中的一些字段,具体如下图5.按住Ctrl键,同时点击所有的交叉表行,交叉表列以及交叉表度量,在属性窗格的字体和文本下设置空白属性为无换行,然后设置交叉表行标题的水平排列为居中。
6.复制交叉表,将其粘贴到表格右边一列的块中。
7.在属性窗格中,命名左边的交叉表为leftCrosstab,右边的交叉表为rightCrosstab。
8.隐藏左边交叉表leftCrosstab的交叉表列和交叉表度量,按住Ctrl键,点击左边交叉表的所有列和所有度量,在属性窗格中的方框对象下,设置方框类型属性为无。
同样地隐藏右边交叉表rightCrosstab的交叉表角和交叉表行。
9.分别拖两个HTML项目到表格右边列的块对象的两边,使块在HTML项目包裹之中复制下面的代码到前面的HTML项目中,该段代码中可以根据需要修改width的值,以适应度量区域的宽度:<div id="freeze" style=" overflow:auto; overflow-y: hidden; white-space:nowrap; width:500px;">复制下面的代码到后面的HTML项目中:</div>10.点击表格右边一列中的块对象,在属性窗格中的方框对象的填充属性中设置其下填充为14px,这样是为了保证滚动条没有挡住最下面的一条数据。
11.拖一个HTML项目到表格的下面,然后复制下面的代码到该HTML项目中,根据自己电脑分辨率的大小,需要修改代码中original_width的值:<script>var original_width = 1280; // Original screen width in which report was developedvar current_width = screen.width; // Detects width of the screenif(current_width != original_width){//Get width of the ‘right’ blockvar set_width = parseInt(document.getElementById("freeze").style.pixelWidth);if ((set_width + current_width – original_width) > 0){//Add the difference of current screen width and// original screen width to adjust the block sizeset_width = (set_width + current_width – original_width) +"px";document.getElementById("freeze").style.width = set_width;}}</script>12.选中表格左边一列,设置其水平排列为居右,垂直排列为顶部,在大小和溢出属性中设置其宽度为1%。
2024版Cognos介绍与应用

Cognos介绍与应用目录contents•Cognitive Cognos•Cognos Core Components •Application of Cognos in DataAnalysis•The Value of Cognos in Business Intelligence•Cognos Implementation and Deployment Precautions•Cognos training support and after sales service01CognitiveCognosCognos Definition and FunctionalityDefinitionCognos is a business intelligence and performancemanagement software suite that provides reporting,analysis, dashboard, scoring, and event managementcapabilitiesFunctionalityCognos enables organizations to transform data intoinsights and make informed decisions by providingtools for data integration, modeling, visualization, andcollaborationDevelopment history and market positionDevelopment historyCognos was founded in the 1960s and has since grown to become aleading provider of business intelligence solutions Over the years, it hasacquired several companies and technologies to enhance its productoffersMarket positionCognos is a well recognized brand in the business intelligence market,known for its robust functionality, scalability, and ease of use It competeswith other leading BI vendors such as Tableau, Power BI, and QlikViewCognos is widely used in various industries such as finance, healthcare, retail, manufacturing, and government It can be applied to areas such as financial reporting, operational analysis, market research, and customer relationship managementApplication fields Some of the key advantages of using Cognosinclude its ability to handle large volumes of data, provide real-time analytics, support collaborative decision making, and offer a wide range of customization options Additionally, its intuitive interface and drag and dropfunctionality make it easy for users to create and share reports and dashboardsAdvantagesApplication fields and advantages02Cognos CoreComponentsReport Studio Report DesignIntuitive report design interfaceEnable users to create pixel perfect reports with a drag and drop interface,providing full control over report layout and formattingData visualizationIncorporates charts, graphs, and other visual elements to enhance datapresentation and understandingInteractive reportingSupports drill down, filtering, and sorting capabilities to enable users to interactwith and explore data dynamicallyQuery Studio Data QueryPowerful data query toolAllow users to retrieve data from multiple sources,including relational databases, cubes, and other datarepositoriesIntrinsic query builderProvides a graphical interface for building complexqueries without requiring extensive knowledge ofSQL or other query languagesReal time data accessEnable users to run queries and view results in realtime, facilitating fast decision makingAnalysis Studio data analysisAdvanced analyticsProvides a range of statistical andpredictive analytics tools to helpusers gain deeper insights intotheir dataData visualizationUtilize charts, graphs, and othervisual aids to simplify complexdata sets and highlight key trendsand patternsInteractive analysis Supports ad hoc analysis anddata exploration through dragand drop functionality anddynamic filteringEvent Studio event handlingEvent driven architecture01Enable real-time event handling and response, allowing users totrigger actions based on specific events or conditionsCustomized event rules02Provide a flexible framework for defining event rules andresponses, enabling users to detail the system to their specificneedsIntegration with other systems03Facilities integration with external systems and applications toenable seamless event handling and automation of businessprocesses03Application ofCognos in DataAnalysisData source connection and integrationConnect to multiple data sourcesCognos can connect to various data sources such as relational databases,multi-dimensional databases, and data warehousesData integrationIt can integrate data from different sources and transform them into a unifiedformat for analysisData virtualizationCognos provides data virtualization technology, which can integrate multipledata sources into a virtual data layer for easier data access and analysisData cleaningCognos provides data cleaning functions such as data deduplication, missing value filling, and outlier processing to ensure data qualityIt can convert data fromdifferent formats andstructures into a unifiedformat for analysis, such asconverting text data intonumerical dataCognos also provides datatransformation functionssuch as data aggregation,calculation, and filtering tomeet different analysisneedsDataconversionDatatransformationData cleaning and conversionData visualization displayDiverse chart typesCognos supports a variety of chart types such as barcharts, line charts, pie charts, scatter plots, etc., whichcan visually display data and enhance understandingInteractive visualizationIt provides interactive visualization functions such asdrill down, slicing and dicing, and filtering, allowingusers to explore data more deeplyDashboard customizationUsers can customize dashboards according to theirneeds, combining different charts and widgets todisplay key indicators and analysis resultsReport designCognos provides a report designer tool that allows users to design reports with a variety of layouts and formats Interactive reportsIt supports interactive reports,which can be viewed andanalyzed in real time based onuser input and selectionsReport schedulingand distributionUsers can schedule reportgeneration and distribution tasks,automatically sending reports tospecific recipients via email orother channels010203 Interactive report production04The Value ofCognos inBusinessIntelligenceImprove decision making efficiency and accuracy•Provide comprehensive data analysis and visualization tools: Cognos offers a variety of data analysis and visualization functions, such as charts, graphs, and dashboards, which can help users quickly understand market trends, customer needs, and business situations•Real time data monitoring and alerting: With Cognos, users can set up real-time data monitoring and alerting mechanisms to track key business indicators and receive timely notifications when data changes occur, enabling faster and more accurate decision making•Data driven predictive analysis: By leveraging historical data and advanced algorithms, Cognos can help users predict future trends and outcomes, providing valuable insights for strategic planning and decision makingAutomated routing tasks and workflows: Cognos can automate routing data collection, processing, and reporting tasks, freeing up human resources for more value added work and reducing operational costs Optimize resource allocation:Through data analysis, Cognoscan help enterprises identifyefficient or redundant processesand resources, enabling morerational allocation of resourcesand cost savingsImprove collaboration andcommunication efficiency: Withits powerful collaboration andsharing functions, Cognos canfacilitate better communicationand collaboration betweendepartments and teams,improving overall businessefficiency010203 Optimize business processes and reduce costsEnhance enterprise competitiveness and innovation capability•Gain insights into market and competitor information: By analyzing external data sources such as market research reports and competitor information, Cognos can help enterprises gain a deep understanding of market trends and competitor strategies, enabling more targeted business decisions•Foster a data-driven culture of innovation: With easy access to data and insights provided by Cognos, enterprises can cultivate a culture of data-driven innovation where employees are resourced to explore new ideas and opportunities based on data insights•Accelerate product development and market launch: By leveraging data insights from Cognos, enterprises can identify customer needs and preferences more accurately and develop products that better meet market demands, then accelerate product development cycles and time to market05CognosImplementation andDeploymentPrecautionsSystem environment setup requirementsOperating SystemEnsure compatibility with the Cognos software, such asWindows, Linux, or UnixHardware RequirementsAdequate memory, storage, and processing power to supportCognos operationsNetwork ConfigurationPropose network setup to allow for effective data transmissionand accessDatabase ConnectivityEnsure seamless integration with variable databases for dataretrieval and storageUser permission setting policyRole Based Access Control (RBAC)Implement RBAC to manage user permissions and restrictaccess to sensitive data and functionsUser AuthenticationUtilize secure authentication mechanisms to verify useridentity and prevent unauthorized accessPermission LevelsDefine different permission levels for users based on theirroles and responsibilities within the organizationRegular AuditingConduct regular audits to monitor user activity and detect anysuspicious or unauthorized behaviorData security measuresEncryptionApply encryption techniques toprotect sensitive data both during transmission and at restAccess Controls Implement strict access controls to prevent unauthorized users from accessing or modifying dataData MaskingUse data masking to hide sensitive information from unauthorized users while maintaining data integrityBackup and Recovery Establish robust backup andrecovery mechanisms to ensure data availability in case of disasters or failures06Cognostrainingsupport andafter salesservice1 2 3Offers a variety of training materials, including video tutorials, user guides, and webinarsCognos Official WebsiteCognos has a team of certified trainers who provide in person and online training coursesCertified TrainersCognos partners with several training organizations to offer a wide range of courses and certificatesTraining PartnersIntroduction to Official Training ResourcesGuidelines for Using Online Learning Platforms •Access to Online Courses: Customers can ACTHANKS感谢观看。
IBM 基于Cognos的零售POS信息分析系统 ARPOS销售指南

什么是ARPOS 分析系统?ARPOS 分析系统: 即ADM Retail POS为主,借助BI 商业智能的先进分析技术(门业务人员提供高价值的决策支持。
ARPOS 系统能带来什么?ARPOS 分析系统为企业提供了完备、购、运营、商品主题: 让商品的定位更明确消费者的行为在不断发生改变,的实现目标。
ARPOS • 综合分析各分类商品的平均销量、平均销额和毛利指标,以及同比、环比信息; • 分析各分类商品的销售获利能力;• 分析各分类下商品的综合贡献度指标排名情况; • 分析各分类商品在不同系列下的结构分布情况; • 分析各价格带区间内的商品销售贡献情况;• 从商品的部门、品牌、供货商、尺码、客层、角色等角度来分析各类商品的顾客消费特点。
• ……ARPOS 系统“基于模糊逻辑的虚拟顾客分类”方法,对不同群体的顾客进行深入分析,发掘其各自结构变化、购买力波动、消费规律、敏感产品及关联产品等关键指标。
为零售企业的营销、策划人员制订促销推广主题、组织促销商品、确定促销周期及受众范围提供行之有效的数据支持。
例如:• 分析整个企业下,不同顾客群体的购买力指标、结构分布、阶梯贡献情况; • 分析不同区域或店铺下,不同顾客群体的购买力波动、顾客结构波动等各项指标差异情况。
• 关注不同顾客群体的周、日、时段消费规律,获取有价值的营销时间线索,了解不同时期下的顾客消费走势情况。
• 分析能够吸引各类顾客群体的敏感产品、品类(即目的性产品); • 分析各类顾客群体在购买敏感产品时最有可能购买的关联产品和品类(即冲动性产品);• 按客品数(单笔购买产品的个数)对顾客进行分类并分析其构成比及喜爱的产品和品类信息。
•……ARPOS 系统针对零售店铺的日常运营指标进行智能预警分析,其中包括营业指标、退货指标、库存指标、客流指标、成长率指标等,为企业实际的店铺运营人员提供及时、有力的决策依据。
例如: • 分析各区域店铺的销售比例成长情况,评估各区域的业绩贡献能力及增长潜力; • 关注各店铺的退货数据在一定时期内的波动情况,并对异常区域或店铺进行预警; • 由店铺至单品,钻透分析店铺的库存结构组成,发现库存积压源头; • 分析退货、赠品等特殊销售类型数据的结构变化情况; • 分析各店铺的促销费效比指标,及时发觉各地的异动经营状况; • 关注不同时段的客流波动情况,不断总结、把握商圈内客流消费规律; • 综合了解各店铺在销售额、利润率方面的综合贡献情况。