09年沃尔沃财务报表
沃尔沃

沃尔沃沃尔沃沃尔沃,英文名为Volvo,瑞典著名汽车品牌,又译为富豪,该品牌汽车是目前世界上最安全的汽车。
沃尔沃汽车公司是北欧最大的汽车企业,也是瑞典最大的工业企业集团,世界20大汽车公司之一。
创立于1927年,创始人是古斯塔夫·拉尔松和阿萨尔·加布里尔松。
吉利收购沃尔沃2009年12月23日,中国汽车企业浙江吉利控股集团有限公司宣布,已与福特汽车公司就收购沃尔沃轿车公司的所有重要商业条款达成一致,预计将于2010年第1季度与福特签署股权收购协议。
2010年3月28日,密西根州迪尔伯恩市——福特汽车公司今天宣布,已与浙江吉利控股集团有限公司就沃尔沃汽车集团及相关资产出售达成了确定的协议。
中国杭州/瑞典哥德堡2010年3月28日–中国发展最快的汽车制造商之一浙江吉利控股集团有限公司今天宣布已与福特汽车签署最终股权收购协议,获得沃尔沃轿车公司100%的股权以及相关资产。
沃尔沃所面临的问题近年来,沃尔沃轿车的销售收入下滑严重。
随着2008年全球金融危机的蔓延,沃尔沃轿车出现了15亿美元的巨额亏损,其销量相比2007年降幅为20%以上。
而收购方吉利汽车早在2007年就已确定下来要进行战略转型——从“造老百姓买得起的好车”转为“造最安全、最环保、最节能的好车”。
2009年上半年吉利汽车实现净利润5.595亿元人民币,虽然比前一年同期增长了110%,但与沃尔沃的亏损比起来还是小巫见大巫。
面对深处困境的沃尔沃公司,应该怎么做呢?在新的所有权框架下,沃尔沃将保留目前的管理、业务计划、生产和研发设施、工会协议和经销商网络?那将是错误的。
当公司处于困境或是亏损的状态,一个新的所有人要做的事情就是进行巨大的变革。
否则,沃尔沃会继续它现在亏损的状况。
在不远的将来,像沃尔沃这样的全球汽车品牌会发现赢利很难。
当然,在接下来几年中,吉利将在中国出售沃尔沃汽车,但也要花时间为沃尔沃品牌发展中国市场。
此外,沃尔沃已不再是过去那么强大的品牌了。
沃尔沃降价分析
沃尔沃在华大幅降价李书福挑起豪价格战问题分析1.为什么降价?为什么豪华车品牌“沃尔沃”在被吉利收购之后会选择一场秘而不宣的价格战,通过自降身价打折卖车策略来实现销售?----我觉得我们得先从吉利收购沃尔沃的背景入手。
沃尔沃在被收购之前:2005年沃尔沃轿车公司盈利约3亿美元,但此后的三年该公司亏损严重。
2008年巨亏15亿美元,其销量相比07年降幅达20%以上。
以下为沃尔沃近四年经营数据:销量金融风暴来袭,主营豪华车业务的沃尔沃轿车公司遭到重创,其在2008年的销量仅约36万辆,同比降幅达20%以上。
销售收入在金融危机肆虐的2008年,沃尔沃轿车公司的总收入出现了大幅下滑,由07年的约180亿美元跌至约140亿美元。
税前利润这些一系列数据和图形说明了沃尔沃轿车销售额在过去数年来一直呈下滑状态,而且随着2008年国际金融危机的蔓延,沃尔沃轿车出现巨额亏损。
可见当吉利以18亿美元购得沃尔沃时,如何拯救昔日的豪车十足给了李书福一个难题。
由于受国际金融危机的冲击,2009年,全球豪华车市场大幅萎缩。
奔驰、宝马、奥迪等一线豪华品牌年销量均出现了较大幅度的下滑,但与此同时,中国豪华车市场却以超过40%的速度高速增长,其中,沃尔沃轿车2009年在中国的销量增长了80%以上。
因此,对于吉利来说,进行降价销售不失为一个好的急救策略。
所以我们可以得出以下几个原因:1)在全球经济危机的大背景下,企业的进出口严重受阻,消费者需求减少,企业为了保持利润的增长甚至是为了生存被迫降价2)出于企业自身发展的一种计划。
沃尔沃为了能在汽车市场上占得属于自己的地位,摆脱金融危机的困扰,必须做出同等品所未达到的优惠来刺激消费者。
3)出自于消费者的心理的分析,为消费者服务。
沃尔沃通过观察与调查发现如今的汽车市场,消费者更多的关注的是价格,而非外形与配置。
2.是战略还是战术?“战略”的含义是指统领性的、全局性的、左右胜败的谋略、方案和对策。
09年沃尔沃财务报表
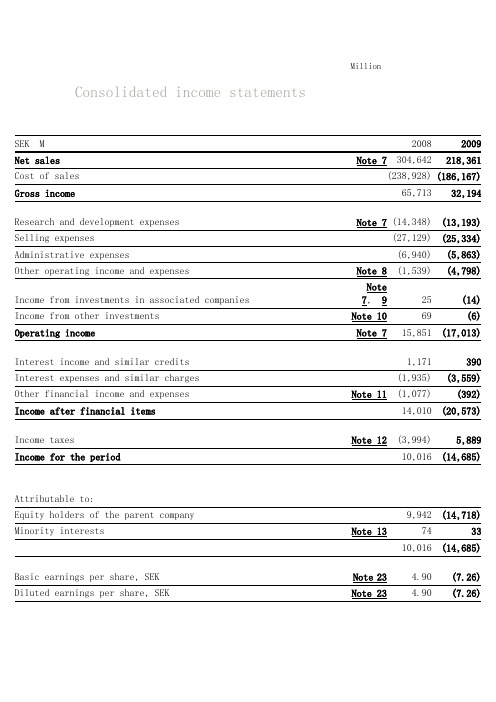
MillionConsolidated income statementsSEK M 2008 2009 Net sales Note 7304,642 218,361 Cost of sales (238,928) (186,167) Gross income65,713 32,194Research and development expenses Note 7(14,348) (13,193) Selling expenses (27,129) (25,334) Administrative expenses (6,940) (5,863) Other operating income and expenses Note 8(1,539) (4,798)Income from investments in associated companiesNote7, 925 (14)Income from other investments Note 1069 (6) Operating income Note 715,851 (17,013)Interest income and similar credits 1,171 390 Interest expenses and similar charges (1,935) (3,559) Other financial income and expenses Note 11(1,077) (392) Income after financial items14,010 (20,573)Income taxes Note 12(3,994) 5,889 Income for the period10,016 (14,685)Attributable to:Equity holders of the parent company 9,942 (14,718) Minority interests Note 1374 3310,016 (14,685)Basic earnings per share, SEK Note 23 4.90 (7.26) Diluted earnings per share, SEK Note 23 4.90 (7.26)Consolidated balance sheetsSEK MDecember 31, 2008 D ecember 31, 2009 AssetsNon-current assetsIntangible assets Note 14 43,958 41,628Tangible assetsNote 14Property, plant and equipment 56,248 54,289 Investment property1,022 991 Assets under operating leases 25,429 82,699 20,388 75,668Financial assetsAssociated companiesNote 15652 588 Other shares and participationsNote 151,3011,456 Non-current customer-financing receivables Note 1650,43239,713 Deferred tax assets Note 1211,18012,595 Prepaid pensionsNote 242,4422,049Other comprehensive income Income for the period10,016 (14,685) Exchange differences on translation of foreign operations6,149 (1,246) Exchange differences on hedge instruments of net investment in foreign operations (414) 159 Accumulated translation difference reversed to income (82) (136)Available-for-sale investments(459)86 Cash flow hedges(2,249)2,313 Other comprehensive income, net of income taxes 2,9451,176Total comprehensive income for the period 12,961 (13,509)Attributable to:Equity holders of the parent company 12,874 (13,561)Minority interests 875212,961 (13,509)Non-current interest-bearing receivables Note 17694 585Other non-current receivables Note 173,023 69,724 3,03860,024 Total non-current assets 196,381 177,320Current assetsInventories Note 1855,045 37,727 Current receivablesCustomer-financing receivables Note 1948,057 42,264Tax assets 1,810 1,523Interest-bearing receivables Note 201,965 410 Accounts receivable Note 2030,523 21,337 Other receivables Note 2015,024 12,082Non interest-bearing assets held for sale Note4–1,684Interest-bearing assets held for sale –97,379 879,308 Marketable securities Note 215,902 16,676 Cash and cash equivalents Note 2217,712 21,234 Total current assets 176,038 154,945 Total assets372,419 332,265Shareholders’ equity and liabilitiesShareholders’ equity Note 23Share capital 2,554 2,554Additional contributed capital ––Reserves 5,078 6,235Retained earnings 66,436 72,334Income for the period 9,942 (14,718)Equity attributable to the equity holders of the parentcompany 84,010 66,405Minority interests 630 629Total shareholders’ equity 84,640 67,034Non-current provisionsProvisions for post-employment benefits Note 2411,705 8,051Provisions for deferred taxes Note 128,260 3,638 Other provisions Note 258,136 28,101 6,36018,049Non-current liabilities Note 26Bond loans 35,798 49,191 Other loans 47,298 56,035Other liabilities 10,442 93,538 9,888 115,114Current provisions Note 2510,883 9,487Current liabilities Note 27Loans62,631 51,626 Non interest-bearing liabilities held for sale Note 4–272 Trade payables 51,025 35,955 Tax liabilities 1,204 623Other liabilities40,397 155.257 34,105 122,581Total shareholders’ equity and liabilities 372,419 332,265Assets pledged Note 281,380 958 Contingent liabilitiesNote 299,4279,607Changes in consolidated Shareholders' equityShareholders ´ equity attributable to equityholders of the parent company Share Other Translation Retained Minority TotalSEK Mcapital reserves1) reserve earnings Total i nterests equity Balance at December 31, 2007 2,554435 1,711 77,502 82,202579 82,781Income for the period – – – 9,942 9,942 74 10,016Other comprehensive incomeTranslation differences––6,126–6,12623 6,149Translation differenceson hedge instruments ofnet investments inforeign operations ––(414) –(414) –(414)Accumulated translationdifference reversed toincome ––(82) –(82) –(82)Available-for-sale investments:Note 15, 23valuation to fairvalue –(459) ––(459) –(459)Change in hedge reserve Note 23– (2,239) ––(2,239) (10) (2,249)Other comprehensiveincome – (2,698) 5,630 –2,932 13 2,945Total income for theperiod–(2,698)5,6309,94212,8748712,961 Transactions withshareholdersDividends –––(11,150) (11,150) (54) (11,204)Share based payments Note34–––73 73 –73Changes in minorityinterests –––––(62) (62)Other changes –––11 11 80 91Transactions withshareholders (11,066) (11,066) (36) (11,102)Balance at December 31,20082,554(2,263)7,34176,37884,01063084,640 Income for the period –––(14,718) (14,718) 33 (14,685) Other comprehensiveincomeTranslation differences ––(1,252) –(1,252) 6 (1,246)Translation differenceson hedge instruments ofnet investments inforeign operations ––159 –159 –159Accumulated translationdifference reversed toincome ––(136) –(136) –(136)Available-for-sale investments:Note 15, 23valuation to fairvalue –86 ––86 –86Change in hedge reserve Note23–2,300 ––2,300 13 2,313Other comprehensiveincome for the period –2,386 (1,229) –1,157 19 1,176Total income for theperiod–2,386(1,229)(14,718)(13,561)52(13,509) Transactions withshareholdersDividends –––(4,055) (4,055) (15) (4,070)Share based payments Note34––– 4 4 – 4Changes in minorityinterests –––––(2) (2) Other changes –––7 7 (36) (29)Transactions withshareholders (4,044) (4,044) (53) (4,097)Balance at December 31,20092,5541236,11257,61666,40562967,0341 For specification of other reservesplease see Note 23.Consolidated cash-flow statementsSEK M 2008 2009 Operating activitiesOperating income 15,851 (17,013) Depreciation and amortization Note 1413,524 15,227 Other items not affecting cash Note 30(133) 4,397 Changes in working capital:(Increase)/decrease in receivables 3,209 10,271 (Increase)/decrease incustomer finance receivables (10,174) 12,806 (Increase)/decrease in inventories (6,664) 15,225 Increase/(decrease) inliabilities and provisions (9,675) (21,387) Interest and similar items received 1,100 353 Interest and similar items paid (1,302) (2,905) Other financial items 109 (514) Income taxes paid (5,076) (1,604) Cash-flow from operating activities769 14,856Investing activitiesInvestments in fixed assets (12,664) (10,464) Investments in leasing assets (5,440) (4,246) Disposals of fixed assets and leasing assets 2,905 3,849Shares and participations, net Note 30(29) (38)Acquired and divested subsidiaries and otherbusiness units, net Note 4, 30 (1,317) 149Interest-bearing receivables including marketablesecurities 10,882 (5,663) (8,866)(19,616) Cash-flow after net investments (4,894) (4,760)Financing activitiesIncrease/(decrease) in bond loans and other loans Note 3018,230 12,655Cash payment to AB Volvo shareholders' (11,150) (4,055) Dividends to minority shareholders (54) (15)Other 8 7,034 (58)8,527Change in cash and cash equivalents, excludingtranslation differences2,140 3,767Translation difference on cash and cash equivalents 1,028 (245) Change in cash and cash equivalents3,168 3,522Cash and cash equivalents, January 1Note 2214,544 17,712 Cash and cash equivalents, December 31Note 2217,712 21,234。
盈利能力与偿债能力分析。
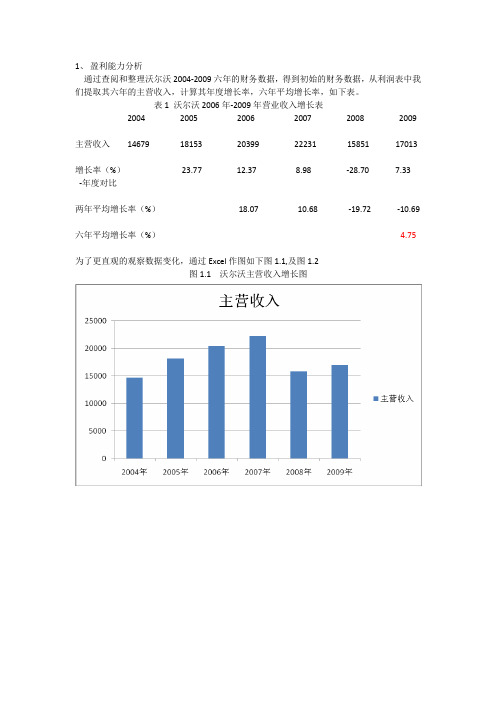
1、盈利能力分析通过查阅和整理沃尔沃2004-2009六年的财务数据,得到初始的财务数据,从利润表中我们提取其六年的主营收入,计算其年度增长率,六年平均增长率,如下表。
表1 沃尔沃2006年-2009年营业收入增长表2004 2005 2006 2007 2008 2009主营收入14679 18153 20399 22231 15851 17013增长率(%)23.77 12.37 8.98 -28.70 7.33 -年度对比两年平均增长率(%)18.07 10.68 -19.72 -10.69 六年平均增长率(%) 4.75为了更直观的观察数据变化,通过Excel作图如下图1.1,及图1.2图1.1 沃尔沃主营收入增长图图1.2沃尔沃主营收入增长率-年度对比曲线2004年至2007年,沃尔沃实现了主营业务收入的快速增长,尤其是2004年至2005年间,主营收入增长最为迅速,公司的获利能力在这四年中不断提升,可以看出,受金融危机的影响,沃尔沃主营收入增长率受到了负面影响,在2008年跌至最低点,但增长率自2008年后开始加速,逐渐恢复至2007年增长水平。
主营收入增长并不能代表获利能力一定强,还需要关注其他三点重要因素:毛利率,净利率,净利润增长率。
计算得表1.3表1.3 沃尔沃利润增长表2004年2005年2006年2007年2008年2009年毛利率(%)22.22 22.40 23.10 23.06 21.76 14.74净利润43777 48989 55800 59276 62095 26305利润增长率(%) 11.91 13.90 6.23 4.76 -57.64毛利是企业经营获利的基础,企业要经营获利,首先要获得足够的毛利,在其他条件不变的情况下,毛利额大,毛利率高,则意味着利润总额也会增加,对毛利率作图1.4图1.4 沃尔沃毛利率变化曲线由图1.4可以看出,沃尔沃的毛利率在经历缓慢增长之后逐渐下降,且下降幅度越来越大,表明企业盈利能力降低,盈利水平不断下降。
吉利收购沃尔沃案例分析报告

而金融风暴来袭,主营豪华车业务的
2005
沃尔沃轿车公司更是遭到重创,其在
2008年的销量仅约36万辆,同比降幅
达20%以上。在金融危机肆虐的2008年, 沃尔沃轿车公司的总收入出现了大幅下
2006
滑,由07年的约180亿美元跌至约140
亿美元。据福特2009年财报披露, 2009年沃尔沃累计亏损达到6.53亿美元
2. 吉利汽车盈利能力分析
对经营者来讲,通过对盈利能 力的分析,可以发现经营管理 中存在的问题,对公司盈利能 力的分析,就是对公司利润率 的深层次分析,本文主要选用 2006年-2013年吉利汽车资产回 报率和净资产收益率来进行分 析,如下图所示。
分析
由上图我们不难看出,总资产回报率在2009 年下降但是在2010年呈明显上升的趋势, 2010年到2013年总资产回报率也大体上呈上 升趋势。净资产收益率在2007年和2009年的 呈下降趋势,而完成并购的2010您到现在大 体上都呈现上升趋势,这表明吉利汽车净资产 收益率在上升。但是通过和同行业进行对比不 难看出吉利汽车盈利能力在减弱,这说明并购 并没有马上发挥他的优势,并在一定程度上影 响了吉利汽车的盈利能力。
的品牌价值和核心技术。在收购沃尔沃之前, 吉利就已经开始了从低端品牌向中高端发展的 战略转型。吉利提出了“生产世界上最环保、 最安全的车”的主张,正是基于这一战略思想, 沃尔沃成为吉利的首要购买对象。
2、沃尔沃选择吉利原因
首先,沃尔沃轿车销售额在过去数年来一直下 滑,随着2008年国际金融危机的蔓延,沃尔 沃轿车出现巨额亏损,成为福特汽车的巨大包 袱。2009年,沃尔沃轿车在全球销售约33.5 万辆,同比下降10.6%。出售沃尔沃这个亏损 大户,并获得一笔宝贵的流动资金,对于正执 行拯救计划的福特汽车公司而言,是一个必须 完成,而且要尽快完成的任务。
吉利成功跨国收购沃尔沃的案例分析
吉利成功跨国收购沃尔沃的案例分析摘要:吉利收购沃尔沃已经过去了7个年头,7年后的“两兄弟”因为本次收购财务状况较收购前得到了显著的改善。
本次收购值得学习和借鉴的地方在于整个并购前期和过程中的并购方案设计、调查和杠杆收购的运用。
但是跨国并购也存在突出的整合问题。
总体来说,本次跨国并购对我国其他的海外并购有着深远的借鉴学习意义。
关键词:吉利沃尔沃跨国收购杠杆收购一、背景分析浙江吉利控股集团(下简称“吉利”或“吉利集团”)始建于1986年,于1997年开始生产经营汽车及汽车零部件的大型企业集团。
凭借民营企业的灵活机制和勇于创新的理念,吉利集团连续10年进入全国企业500强,连续八年进入中国汽车行业十强。
2012年7月,吉利控股集团你总营业收入179.8亿欧元进入世界500强,成为唯一入围的中国民营汽车企业。
沃尔沃作为瑞典著名豪华汽车品牌,是目前世界上最安全的汽车之一,沃尔沃汽车以质量和性能优异在北欧享有很高声誉,美国公路损失资料研究所曾评比过十种最安全的汽车,沃尔沃荣登榜首。
沃尔沃汽车原是美国福特汽车公司旗下的品牌,2010年3月28日,中国本土汽车制造商吉利集团正式宣布收购了沃尔沃百分之百的股权及相关资产(包括知识产权),使其成为吉利集团旗下品牌。
2010年8月2日,吉利集团收购沃尔沃的交割仪式在伦敦举行,吉利集团完成了对沃尔沃汽车公司的全部股权收购。
二、并购动因分析曾经有这么一种说法,吉利汽车的发动机可以宝马汽车的发动机相媲美,虽然吉利汽车在这一方面做得非常突出,但是由于其他技术层面的限制,吉利汽车一直专注于中低端领域,相凭借自主研发进入高端市场必定困难重重。
吉利公司为了克服这方面的短板,也收购了国外一些著名的汽车制造商来填补技术方面的不足。
为了快速提升吉利汽车的品牌优势,进军海外高端市场,也趁金融危机之后,欧洲和美国汽车市场大幅滑坡,各大国际汽车品牌身陷囹圄,,吉利集团决定展开对沃尔沃公司的收购。
财务报表分析课后习题参考答案
《财务报表分析》课后习题参考答案第1章总论1.练习题(1)不愿意。
原因如下:一方面,经营活动现金流量净额是在净利润基础上调增折旧、摊销、应付款项的本年增加额,同时调减应收款项本年增加额得出的结果。
尽管该公司2011年的经营结果为盈利,但其经营活动现金流量净额为-500万元,很可能是因为当年应收款项大量增加所致,由此将会降低资金周转速度和企业的短期偿债能力。
另一方面,1.5亿元的总负债中包含了一部分有息负债,需要在2012年还本付息,由于该公司2011年经营活动现金流量净额小于0,因而需要通过2012年的经营收益或者外部筹资额来解决。
可见,该公司短期内的还本付息压力较大,能否按期归还本息,有赖于2011年形成净利润的应收款项的回收情况,出于资金安全考虑,信贷主管很可能不愿意为其提供贷款。
(2)股票投资价值取决于公司未来盈利情况及现金流水平,尽管该公司当前经营活动现金流量净额为负数,但仍然处于盈利状态,只要短期内不会陷入财务困境并保持一定的增长率,还是值得投资的。
相比之下,短期融资券的还本付息期限在1年以内,而公司在2012年的经营活动现金流量存在不确定性。
因此,作为潜在投资者更倾向于选择投资股票。
第2章财务报表分析的信息来源1.练习题(1)金融资产=0.8+2.2=3(亿元);金融负债=1.2+2=3.2(亿元);净金融资产=金融资产-金融负债=3-3.2=-0.2(亿元),即净金融负债为0.2亿元。
(2)净利润=利润总额-所得税费用=17-4.25=12.75(亿元);其他综合收益=0.5+0.8=1.3(亿元),综合收益=12.75+1.3=14.05(亿元)(3)筹资活动现金流量净额=2.5+1.9-0.8=3.6(亿元);现金及现金等价物净增加额=5+3.6+(-0.5)=8.1(亿元);现金及现金等价物期末余额=3+8.1=11.1(亿元)(4)所有者权益期初余额=50-26=24(亿元);所有者权益本年增加额=股权融资额+留存收益+其他综合收益=2.5+(12.75-0)+1.3=16.55(亿元)【假定当年没有支付股利】所有者权益年末余额=24+16.55=40.55(亿元)(5)营业外收支净额=利润总额-营业利润=17-6=11(亿元),可见该企业2011年的利润主要是非经常性损益,而非经常性损益不具有可持续性,从而降低了公司的盈利质量。
{财务管理财务报表}年沃尔沃财务报表

{财务管理财务报表}年沃尔沃财务报表MillionConsolidatedinestatementsSEKM 2008 2009Netsales Note7304,642 218,361Costofsales (238,928) (186,167) Grossine65,713 32,194Researchanddevelopmentexpenses Note7(14,348) (13,193)Sellingexpenses (27,129) (25,334) Administrativeexpenses (6,940) (5,863)Otheroperatingineandexpenses Note8(1,539) (4,798)Inefrominvestmentsinassociatedpanies Note7,925 (14)Inefromotherinvestments Note1069 (6)Operatingine Note715,851 (17,013)Interestineandsimilarcredits 1,171 390 Interestexpensesandsimilarcharges (1,935) (3,559)Otherfinancialineandexpenses Note11(1,077) (392)Ineafterfinancialitems14,010 (20,573)Inetaxes Note12(3,994) 5,889Inefortheperiod10,016 (14,685) Attributableto:Equityholdersoftheparentpany 9,942 (14,718)Minorityinterests Note1374 3310,016 (14,685)Basicearningspershare,SEK Note23 4.90 (7.26)Dilutedearningspershare,SEK Note23 4.90 (7.26)OtherprehensiveineInefortheperiod10,016 (14,685) Exchangedifferencesontranslationofforeignoperations 6,149 (1,246)ConsolidatedbalancesheetsSEKM December31,2008 D ecember31,2009AssetsNon-currentassetsIntangibleassets Note14 43,95841,628TangibleassetsNoteExchangedifferencesonhedgeinstrumentsofnetinvestmentinforeignoperations (414) 159 Accumulatedtranslationdifferencereversedtoine (82) (136) Available-for-saleinvestments (459) 86 Cashflowhedges(2,249) 2,313 Otherprehensiveine,netofinetaxes 2,9451,176Totalprehensiveinefortheperiod 12,961 (13,509)Attributableto:Equityholdersoftheparentpany 12,874 (13,561)Minorityinterests875212,961 (13,509)14Property,plantandequipment 56,248 54,289 Investmentproperty 1,022 991 Assetsunderoperatingleases 25,429 82,699 20,38875,668 FinancialassetsAssociatedpanies Note15652 588Othersharesandparticipations Note151,301 1,456Non-currentcustomer-financingreceivables Note1650,432 39,713Deferredtaxassets Note1211,180 12,595Prepaidpensions Note242,442 2,049Non-currentinterest-bearingreceivables Note17694 585Othernon-currentreceivables Note173,023 69,724 3,03860,024Totalnon-currentassets 196,381 177,320CurrentassetsInventories Note1855,045 37,727CurrentreceivablesCustomer-financingreceivables Note1948,057 42,264Taxassets 1,810 1,523Interest-bearingreceivables Note201,965 410Accountsreceivable Note2030,523 21,337Otherreceivables Note2015,024 12,082Noninterest-bearingassetsheldforsale Note4–1,684Interest-bearingassetsheldforsale –97,379 879,308Marketablesecurities Note215,902 16,676Cashandcashequivalents Note2217,712 21,234Totalcurrentassets 176,038 154,945 Totalassets372,419 332,265 Shareholders’equityandliabilitiesShareholders’equity Note 23Sharecapital 2,554 2,554 Additionalcontributedcapital ––Reserves 5,078 6,235 Retainedearnings 66,436 72,334 Inefortheperiod 9,942 (14,718) Equityattributabletotheequityholdersoftheparentpany 84,010 66,405 Minorityinterests 630 629 Totalshareholders’equity84,640 67,034 Non-currentprovisionsProvisionsforpost-employmentbenefits Note2411,705 8,051Provisionsfordeferredtaxes Note128,260 3,638Otherprovisions Note258,136 28,101 6,36018,049Non-currentliabilities Note 26Bondloans 35,798 49,191 Otherloans 47,298 56,035 Otherliabilities 10,442 93,538 9,888115,114Currentprovisions Note2510,883 9,487Currentliabilities Note 27Loans 62,631 51,626Noninterest-bearingliabilitiesheldforsale Note4–272Tradepayables 51,025 35,955 Taxliabilities 1,204 623 Otherliabilities 40,397 155.257 34,105122,581 Totalshareholders’equityandliabilities372,419 332,265Assetspledged Note281,380 958Contingentliabilities Note299,427 9,607ChangesinconsolidatedShareholders'equityShareholdShare SEKM capital r es BalanceatDecember31,20072,554 Inefortheperiod –OtherprehensiveineTranslationdifferences –Translationdifferencesonhedgeinstrumentsofnetinvestmentsinforeignoperations –Accumulatedtranslationdifferencereversedtoine –Available-for-saleinvestments: Note 15,23Gains/lossesatvaluationtofairvalue –Changeinhedgereserve Note23–Otherprehensiveine –Totalinefortheperiod–TransactionswithshareholdersDividends –Sharebasedpayments Note34–Changesinminorityinterests –Otherchanges –TransactionswithshareholdersBalanceatDecember31,20082,554(2 Inefortheperiod –OtherprehensiveineTranslationdifferences –Translationdifferencesonhedgeinstrumentsofnetinvestmentsinforeignoperations –Accumulatedtranslationdifferencereversedtoine –Available-for-saleinvestments: Note 15,23Gains/lossesatvaluationtofairvalue –Changeinhedgereserve Note23–Otherprehensiveinefortheperiod –Totalinefortheperiod–TransactionswithshareholdersDividends –Sharebasedpayments Note34–Changesinminorityinterests –Otherchanges –TransactionswithshareholdersBalanceatDecember31,20092,554 1ForspecificationofotherreservespleaseseeNote 23.Consolidatedcash-flowstatementsSEKM 2008 OperatingactivitiesOperatingine 15,851 Depreciationandamortization Note 1413,524 Otheritemsnotaffectingcash Note 30(133) Changesinworkingcapital:(Increase)/decreaseinreceivables 3,209 (Increase)/decreaseincustomerfinancereceivables (10,174) (Increase)/decreaseininventories (6,664) Increase/(decrease)inliabilitiesandprovisions (9,675) Interestandsimilaritemsreceived 1,100 Interestandsimilaritemspaid (1,302) Otherfinancialitems 109 Inetaxespaid (5,076) Cash-flowfromoperatingactivities769 InvestingactivitiesInvestmentsinfixedassets (12,664) (10,464 Investmentsinleasingassets (5,440) (4,246 Disposalsoffixedassetsandleasingassets 2,905 3,84 Sharesandparticipations,net Note 30(29) (38Acquiredanddivestedsubsidiariesandotherbusinessunits,net Note4,30(1,317) 14Interest-bearingreceivablesincludingmarketablesecurities 10,882 (5,663) (8,866 Cash-flowafternetinvestments(4,894)FinancingactivitiesIncrease/(decrease)inbondloansandotherloans Note 3018,230 12,65 CashpaymenttoABVolvoshareholders' (11,150) (4,055 Dividendstominorityshareholders (54) (15 Other 8 7,034 (58 Changeincashandcashequivalents,excludingtranslationdifferences2,140 Translationdifferenceoncashandcashequivalents 1,028 Changeincashandcashequivalents3,168 Cashandcashequivalents,January1Note 2214,544 Cashandcashequivalents,December31Note 2217,712感谢阅读多年企业管理咨询经验,专注为企业和个人提供精品管理方案,企业诊断方案,制度参考模板等欢迎您下载,均可自由编辑。
- 1、下载文档前请自行甄别文档内容的完整性,平台不提供额外的编辑、内容补充、找答案等附加服务。
- 2、"仅部分预览"的文档,不可在线预览部分如存在完整性等问题,可反馈申请退款(可完整预览的文档不适用该条件!)。
- 3、如文档侵犯您的权益,请联系客服反馈,我们会尽快为您处理(人工客服工作时间:9:00-18:30)。
09年沃尔沃财务报表illionConsolidated income statementsSEK M 2008 2009 Net sales Note 7304,642 218,361 Cost of sales (238,928) (186,167) Gross income 65,713 32,194Research and development expenses Note 7(14,348) (13,193) Selling expenses (27,129) (25,334) Administrative expenses (6,940) (5,863) Other operating income and expenses Note 8(1,539) (4,798)Income from investments in associated companiesNote7, 925 (14)Income from other investments Note 1069 (6) Operating income Note 715,851 (17,013)Interest income and similar credits 1,171 390 Interest expenses and similar charges (1,935) (3,559) Other financial income and expenses Note 11(1,077) (392) Income after financial items 14,010 (20,573)Income taxes Note 12(3,994) 5,889 Income for the period 10,016 (14,685)Attributable to:Equity holders of the parent company 9,942 (14,718) Minority interests Note 1374 3310,016 (14,685)Basic earnings per share, SEK Note23 4.90 (7.26)Consolidated balance sheetsSEK MDecember 31, 2008 D ecember 31, 2009 AssetsNon-current assetsIntangible assets Note 14 43,958 41,628Tangible assetsNote 14Property, plant and equipment 56,248 54,289 Investment property1,022 991 Assets under operating leases 25,429 82,699 20,388 75,668Financial assetsAssociated companiesNote 15652588Diluted earnings per share, SEK Note 234.90 (7.26)Other comprehensive incomeIncome for the period10,016 (14,685) Exchange differences on translation of foreign operations 6,149 (1,246) Exchange differences on hedge instruments of net investment in foreign operations (414) 159 Accumulated translation difference reversed to income (82) (136)Available-for-sale investments(459)86 Cash flow hedges(2,249)2,313 Other comprehensive income, net of income taxes 2,9451,176Total comprehensive income for the period 12,961 (13,509)Attributable to:Equity holders of the parent company 12,874 (13,561)Minority interests 875212,961 (13,509)Other shares and participations Note 151,301 1,456Non-current customer-financing receivables Note 1650,432 39,713Deferred tax assets Note 1211,180 12,595 Prepaid pensions Note 242,442 2,049 Non-current interest-bearing receivables Note 17694 585Other non-current receivables Note 173,023 69,724 3,038 60,024 Total non-current assets 196,381 177,320Current assetsInventories Note 1855,045 37,727 Current receivablesCustomer-financing receivables Note 1948,057 42,264Tax assets 1,810 1,523Interest-bearing receivables Note 201,965 410 Accounts receivable Note 2030,523 21,337 Other receivables Note 2015,024 12,082Non interest-bearing assets held for sale Note4–1,684Interest-bearing assets held for sale –97,379 8 79,308 Marketable securities Note 215,902 16,676 Cash and cash equivalents Note 2217,712 21,234 Total current assets 176,038 154,945 Total assets 372,419 332,265Shareholders’ equity and liabilitiesShareholders’ equity Note 23Share capital 2,554 2,554Additional contributed capital ––Reserves 5,078 6,235Retained earnings 66,436 72,334Income for the period 9,942 (14,718)Equity attributable to the equity holders of the parentcompany 84,010 66,405Minority interests 630 629Total shareholders’ equity84,640 67,034Non-current provisionsProvisions for post-employment benefits Note 2411,705 8,051 Provisions for deferred taxes Note 128,2603,638 Other provisions Note 258,136 28,101 6,360 18,049Non-current liabilities Note 26Bond loans 35,798 49,191 Other loans 47,298 56,035Other liabilities 10,442 93,538 9,888 115,114Current provisions Note 2510,883 9,487Current liabilities Note 27Loans62,63151,626 Non interest-bearing liabilities held for sale Note 4–272 Trade payables 51,025 35,955 Tax liabilities 1,204 623Other liabilities40,397 155.257 34,105 122,581Total shareholders’ equity and liabilities 372,419 332,265Assets pledgedNote 281,380 958 Contingent liabilitiesNote 299,4279,607Changes in consolidated Shareholders' equityShareholders´ equity attributable to equity holders of the parent companyShare Other Translation Retained Minority TotalSEK Mcapital reserves1) reserve earnings Total i nterests equityBalance at December 31, 20072,554435 1,711 77,502 82,202579 82,781Income for the period – – – 9,942 9,942 74 10,016Other comprehensiveincomeTranslationdifferences ––6,126 –6,126 23 6,149Translationdifferences on hedgeinstruments of netinvestments in foreignoperations ––(414) –(414) –(414)Accumulatedtranslation differencereversed to income ––(82) –(82) –(82)Available-for-sale investments:Note 15, 23Gains/losses atvaluation tofair value –(459) ––(459) –(459)Change in hedgereserve Note 23– (2,239) ––(2,239) (10) (2,249)Other comprehensiveincome – (2,698) 5,630 –2,932 13 2,945Total income for theperiod – (2,698) 5,630 9,942 12,874 87 12,961 Transactions withshareholdersDividends –––(11,150) (11,150) (54) (11,204) Share based payments Note 34–––73 73 –73Changes in minorityinterests –––––(62) (62) Other changes –––11 11 80 91Transactions withshareholders (11,066) (11,066) (36) (11,102)Balance at December 31,2008 2,554 (2,263) 7,341 76,378 84,010 630 84,640Income for the period –––(14,718) (14,718) 33 (14,685) Other comprehensiveincomeTranslationdifferences ––(1,252) –(1,252) 6 (1,246)Translationdifferences on hedgeinstruments of netinvestments in foreignoperations ––159 –159 –159Accumulatedtranslation differencereversed to income ––(136) –(136) –(136)Available-for-sale investments:Note 15, 23valuation tofair value –86 ––86 –86Change in hedge reserve Note23–2,300 ––2,300 13 2,313Other comprehensiveincome for the period –2,386 (1,229) –1,157 19 1,176Total income for theperiod –2,386 (1,229) (14,718) (13,561) 52 (13,509) Transactions withshareholdersDividends –––(4,055) (4,055) (15) (4,070) Share based payments Note 34––– 4 4 – 4Changes in minorityinterests –––––(2) (2) Other changes –––7 7 (36) (29)Transactions withshareholders (4,044) (4,044) (53) (4,097)Balance at December 31,2009 2,554 123 6,112 57,616 66,405 629 67,0341 For specification of other reservesplease see Note 23.Consolidated cash-flow statementsSEK M 2008 2009 Operating activitiesOperating income 15,851 (17,013) Depreciation and amortization Note 1413,524 15,227 Other items not affecting cash Note 30(133) 4,397 Changes in working capital:(Increase)/decrease in receivables 3,209 10,271 (Increase)/decrease incustomer finance receivables (10,174) 12,806 (Increase)/decrease in inventories (6,664) 15,225 Increase/(decrease) inliabilities and provisions (9,675) (21,387) Interest and similar items received 1,100 353 Interest and similar items paid (1,302) (2,905) Other financial items 109 (514) Income taxes paid (5,076) (1,604) Cash-flow from operating activities 769 14,856Investing activitiesInvestments in fixed assets (12,664) (10,464) Investments in leasing assets (5,440) (4,246) Disposals of fixed assets and leasing assets 2,905 3,849Shares and participations, net Note 30(29) (38)Acquired and divested subsidiaries and other business units, netNote4, 30 (1,317) 149Interest-bearing receivables including marketablesecurities 10,882 (5,663) (8,866) (19,616) Cash-flow after net investments (4,894) (4,760)Financing activitiesIncrease/(decrease) in bond loans and other loans Note 3018,230 12,655Cash payment to AB Volvo shareholders' (11,150) (4,055) Dividends to minority shareholders (54) (15)Other 8 7,034 (58) 8,527Change in cash and cash equivalents, excludingtranslation differences 2,140 3,767Translation difference on cash and cash equivalents 1,028 (245) Change in cash and cash equivalents 3,168 3,522Cash and cash equivalents, January 1 Note 2214,544 17,712 Cash and cash equivalents, December 31 Note 2217,712 21,234。