清华大学宏观经济学Chapter 5
布兰查德宏观经济学第七版第7版英文版chapter (5)

Macroeconomics, 7e (Blanchard)Chapter 5: Goods and Financial Markets. The IS-LM Model5.1 The Goods Market and the IS Relation1) The IS curve representsA) the single level of output where the goods market is in equilibrium.B) the single level of output where financial markets are in equilibrium.C) the combinations of output and the interest rate where the money market is in equilibrium.D) the combinations of output and the interest rate where the goods market is in equilibrium.E) none of the aboveAnswer: DDiff: 12) The IS curve will shift to the right when which of the following occurs?A) an increase in the money supplyB) an increase in government spendingC) a reduction in the interest rateD) all of the aboveE) none of the aboveAnswer: BDiff: 23) Which of the following occurs as the economy moves leftward along a given IS curve?A) An increase in the interest rate causes investment spending to decrease.B) An increase in the interest rate causes money demand to increase.C) An increase in the interest rate causes a reduction in the money supply.D) A reduction in government spending causes a reduction in demand for goods.E) An increase in taxes causes a reduction in demand for goods.Answer: ADiff: 24) During 2008 in the United States, consumer confidence fell significantly. Which of the following will occur as a result of this reduction in consumer confidence?A) The LM curve will shift up.B) The LM curve will shift down.C) The IS curve will shift rightward.D) The IS curve will shift leftward.E) The IS curve will shift rightward, and the LM curve will shift up.Answer: DDiff: 25) Suppose policy makers decide to reduce taxes. This fiscal policy action will cause which of the following to occur?A) The LM curve shifts and the economy moves along the IS curve.B) The IS curve shifts and the economy moves along the LM curve.C) Both the IS and LM curves shift.D) Neither the IS nor the LM curve shifts.E) Output will change causing a change in money demand and a shift of the LM curve. Answer: BDiff: 26) Suppose fiscal policy makers implement a policy to reduce the size of a budget deficit. Based on the IS-LM model, we know with certainty that the following will occur as a result of this fiscal policy action.A) Investment spending will decrease.B) Investment spending will increase.C) There will be no change in investment spending.D) Investment spending may increase, decrease, or not change.E) none of the aboveAnswer: DDiff: 37) For this question, assume that investment spending depends only on the interest rate and no longer depends on output. Given this information, a reduction in government spendingA) will cause investment to decrease.B) will cause investment to increase.C) may cause investment to increase or to decrease.D) will have no effect on output.E) will cause a reduction in output and have no effect on the interest rate.Answer: BDiff: 38) Suppose investment spending is not very sensitive to the interest rate. Given this information, we know thatA) the IS curve should be relatively flat.B) the IS curve should be relatively steep.C) the LM curve should be relatively flat.D) the LM curve should be relatively steep.E) neither the IS nor the LM curve will be affected.Answer: BDiff: 29) Explain the determinants of investment. Include in your answer an explanation of how a change in each determinant affects investment.Answer: Investment depends on the level of sales/output and on the interest rate. As output changes, the demand for goods will change and firms will change investment so that their capacity changes with the level of economic activity (and demand). I also depends on the interest rate. As the interest rate rises, the cost of borrowing rises. Firms will cut back on investment as borrowing costs rise.Diff: 210) What is the IS relation? Explain why IS curve is downward sloping.Answer: The IS relation shows the combinations of the interest rate and the level of output that are consistent with equilibrium in the goods market. An increase in the interest rate leads to a decline in output. Consequently, the IS curve is downward sloping.Diff: 211) Graphically derive the IS curve from the goods market equilibrium.Answer: Suppose the initial equilibrium in the goods market is at point A with interest rate i. Suppose now that the interest rate increases from its initial value i to a higher value i'. The increase in the interest rate decreases investment. The decrease in investment leads to a decrease in output. Now the new equilibrium point is at A', with a higher value of i and lower value of Y. After we plot the combinations of i and Y when the goods market is in equilibrium, we can connect these two points (A and A') to get a downward sloping IS curve.Diff: 25.2 Financial Markets and the LM Relation1) For each interest rate, the LM curve illustrates the level of output whereA) the goods market is in equilibrium.B) inventory investment equals zero.C) money supply equals money demand.D) all of the aboveE) none of the aboveAnswer: CDiff: 22) The LM curve shifts down (or, equivalently, to the right) when which of the following occurs?A) an increase in taxesB) an increase in outputC) an open market sale of bonds by the central bankD) an increase in consumer confidenceE) none of the aboveAnswer: EDiff: 23) Which of the following statements is consistent with a given (i.e., fixed) LM curve?A) A reduction in the interest rate causes investment spending to increase.B) A reduction in the interest rate causes money demand to decrease.C) A reduction in the interest rate causes an increase in the money supply.D) An increase in output causes an increase in demand for goods.E) An increase in output causes an increase in money demand.Answer: EDiff: 24) In late 2007 and early 2008, the U.S. Federal Reserve pursued expansionary monetary policy. Which of the following will occur as a result of this monetary policy action?A) The LM curve shifts down.B) The LM curve shifts up.C) The IS curve shifts rightward as the interest rate falls.D) The IS curve shifts leftward as the interest rate increases.E) none of the aboveAnswer: ADiff: 25) Suppose the demand for money is not very sensitive to the interest rate. Given this information, we know thatA) the IS curve should be relatively flat.B) the IS curve should be relatively steep.C) the LM curve should be relatively flat.D) the LM curve should be relatively steep.E) neither the IS nor the LM curve will be affected.Answer: DDiff: 36) Which of the following is the definition for the real supply of money?A) The stock of money measured in terms of goods, not dollars.B) The stock of high powered money only.C) The real value of currency in circulation only.D) The actual quantity of money, rather than the officially reported quantity.E) The ratio of the real GDP to the nominal money supply.Answer: ADiff: 17) First, define the LM curve. Second, explain why it has its particular shape.Answer: The LM curve illustrates the combinations of the interest rate and level of output that maintain financial market equilibrium. The curve is upward sloping because as income increases, money demand will rise. This increase in money demand will cause an excess demand for money and an excess supply of bonds. Bond prices will fall and the interest rate will increase until equilibrium is restored.Diff: 25.3 Putting the IS and the LM Relations Together1) Suppose the economy is currently operating on both the LM curve and the IS curve. Which of the following is true for this economy?A) Production equals demand.B) The quantity supplied of bonds equals the quantity demanded of bonds.C) The money supply equals money demand.D) Financial markets are in equilibrium.E) all of the aboveAnswer: EDiff: 12) Suppose the economy is operating on the LM curve but not on the IS curve. Given this information, we know thatA) the goods market is in equilibrium and the money market is not in equilibrium.B) the money market and bond markets are in equilibrium and the goods market is not in equilibrium.C) the money market and goods market are in equilibrium and the bond market is not in equilibrium.D) the money, bond and goods markets are all in equilibrium.E) neither the money, bond, nor goods markets are in equilibrium.Answer: BDiff: 23) Suppose the current level of output and the interest rate are such that the economy is operating on neither the IS nor LM curve. Which of the following is true for this economy?A) Production does not equal demand.B) The money supply does not equal money demand.C) The quantity supplied of bonds does not equal the quantity demanded of bonds.D) Financial markets are not in equilibrium.E) all of the aboveAnswer: EDiff: 24) An increase in the money supply will cause an increase in which of the following variables?A) outputB) investmentC) consumptionD) all of the aboveE) none of the aboveAnswer: DDiff: 25) Suppose there is an increase in consumer confidence. Which of the following represents the complete list of variables that must increase in response to this increase in consumer confidence?A) consumptionB) consumption and investmentC) consumption, investment and outputD) consumption and outputE) consumption, output and the interest rateAnswer: EDiff: 26) Suppose there is a fiscal contraction. Which of the following is a complete list of the variables that must decrease?A) consumptionB) consumption and investmentC) consumption and outputD) consumption, output and the interest rateE) consumption, output and investmentAnswer: CDiff: 27) We know with certainty that a tax increase must cause which of the following?A) an increase in investmentB) a reduction in investmentC) no change in investmentD) none of the aboveAnswer: DDiff: 28) A fiscal contraction will tend to cause which of the following to occur?A) a reduction in the interest rate and a reduction in investmentB) a reduction in the interest rate and an upward shift in the LM curveC) a reduction in the interest rate and an ambiguous effect on investmentD) no change in output if the Fed simultaneously pursues contractionary monetary policy Answer: CDiff: 29) An increase in the money supply must cause which of the following?A) a leftward shift in the IS curveB) a reduction in the interest rate and ambiguous effects on investmentC) an increase in investment and a rightward shift in the IS curveD) no change in the interest rate if investment is independent of the interest rateE) no change in output if investment is independent of the interest rateAnswer: EDiff: 110) An increase in consumer confidence will tend to cause which of the following to occur?A) a rightward shift in the IS curveB) a leftward shift in the IS curveC) an upward shift in the LM curveD) a downward shift in the LM curveAnswer: ADiff: 111) Assume that investment does not depend on the interest rate. A reduction in government spending will cause which of the following for this economy?A) no change in the interest rateB) no change in outputC) no change in investmentD) an increase in investmentE) none of the aboveAnswer: EDiff: 312) Assume that investment does not depend on the interest rate. A reduction in the money supply will cause which of the following for this economy?A) no change in the interest rateB) no change in outputC) a reduction in investmentD) an increase in investmentAnswer: BDiff: 313) For this question, assume that investment spending depends only on output and no longer depends on the interest rate. Given this information, an increase in the money supplyA) will cause investment to decrease.B) will cause investment to increase.C) will cause a reduction in the interest rate.D) will have no effect on output or the interest rate.E) will cause an increase in output and have no effect on the interest rate.Answer: CDiff: 314) A reduction in consumer confidence will likely have which of the following effects?A) a rightward shift in the IS curveB) a leftward shift in the IS curveC) an upward shift in the LM curveD) a downward shift in the LM curveAnswer: BDiff: 215) An increase in the reserve deposit ratio, θ, will most likely have which of the following effects?A) a rightward shift in the IS curveB) a leftward shift in the IS curveC) an upward shift in the LM curveD) a downward shift in the LM curveAnswer: CDiff: 216) A Fed purchase of securities will most likely have which of the following effects?A) a rightward shift in the IS curveB) a leftward shift in the IS curveC) an upward shift in the LM curveD) a downward shift in the LM curveAnswer: DDiff: 217) A reduction in the aggregate price level, P, will most likely have which of the following effects?A) a rightward shift in the IS curveB) a leftward shift in the IS curveC) an upward shift in the LM curveD) a downward shift in the LM curveAnswer: DDiff: 218) An increase in the aggregate price level, P, will most likely have which of the following effects?A) a rightward shift in the IS curveB) a leftward shift in the IS curveC) an upward shift in the LM curveD) a downward shift in the LM curveAnswer: CDiff: 219) The IS curve will not shift when which of the following occurs?A) a reduction in government spendingB) a reduction in the interest rateC) a reduction in consumer confidenceD) all of the aboveE) none of the aboveAnswer: BDiff: 120) Which of the following best defines the IS curve?A) the combinations of i and Y that maintain equilibrium in the goods marketB) illustrates the effects of changes in i on investmentC) illustrates the effects of changes in i on desired money holdings by individualsD) the combinations of i and Y that maintain equilibrium in financial marketsAnswer: ADiff: 121) Which of the following best defines the LM curve?A) the combinations of i and Y that maintain equilibrium in the goods marketB) illustrates the effects of changes in i on investmentC) illustrates the effects of changes in i on desired money holdings by individualsD) the combinations of i and Y that maintain equilibrium in financial marketsAnswer: DDiff: 122) Based on our understanding of the IS-LM model that takes into account dynamics, we know that a reduction in the money supply will causeA) an immediate drop in Y and immediate increase in i.B) an immediate increase in i and no initial change in Y.C) a gradual increase in i and gradual reduction in Y.D) none of the aboveAnswer: BDiff: 223) Based on our understanding of the IS-LM model that takes into account dynamics, we know that a reduction in government spending will causeA) an immediate drop in Y and immediate increase in i.B) an immediate reduction in i and no initial change in Y.C) a gradual reduction in i and gradual reduction in Y.D) a gradual reduction in i and an immediate reduction in Y.Answer: CDiff: 224) Based on our understanding of the IS-LM model that takes into account dynamics, we know that an increase in the money supply will causeA) an immediate increase in i and no initial change in Y.B) an immediate decrease in i and no initial change in Y.C) a gradual decrease in i and gradual increase in Y.D) none of the aboveAnswer: BDiff: 225) Based on our understanding of the IS-LM model that takes into account dynamics, we know that an increase in government spending will causeA) a gradual increase in i and gradual increase in Y.B) an immediate increase in Y and immediate drop in i.C) an immediate increase in i and no initial change in Y.D) a gradual increase in i and an immediate increase in Y.Answer: ADiff: 226) An increase in government spending will likely have which of the following effects?A) a rightward shift in the IS curveB) a leftward shift in the IS curveC) an upward shift in the LM curveD) a downward shift in the LM curveAnswer: ADiff: 227) A reduction in the reserve depos it ratio, θ, will most likely have which of the following effects?A) a rightward shift in the IS curveB) a leftward shift in the IS curveC) an upward shift in the LM curveD) a downward shift in the LM curveAnswer: DDiff: 228) If government spending and taxes increase by the same amount,A) the IS curve does not shiftB) the IS curve shift leftwardC) the IS curve shifts rightwardD) the LM curve shifts downwardAnswer: CDiff: 229) If government spending and taxes decrease by the same amount,A) the IS curve does not shift.B) the IS curve shift leftward.C) the IS curve shifts rightward.D) the LM curve shifts downward.Answer: BDiff: 230) Which of the following triggered the U.S. recession of 2001?A) decline in investment demandB) decline in consumption demandC) increase in budget deficitD) increase in trade deficitAnswer: ADiff: 231) The IS curve will shift to the left when which of the following occurs?A) a reduction in the money supplyB) a reduction in government spendingC) an increase in the interest rateD) all of the aboveE) none of the aboveAnswer: BDiff: 232) Which of the following occurs as the economy moves rightward along a given IS curve?A) A reduction in the interest rate causes investment spending to decrease.B) A reduction in the interest rate causes money demand to increase.C) A reduction in the interest rate causes a reduction in the money supply.D) An increase in government spending causes a reduction in demand for goods.E) A reduction in taxes causes a reduction in demand for goods.Answer: ADiff: 233) When the central bank pursues contractionary monetary policy, we that this policy will result in an increase in the interest rate, a reduction in investment, a reduction in demand, and a lower level of equilibrium output. Explain what happens to the position of the IS curve as the central bank pursues contractionary monetary policy.Answer: Changes in the interest rate do cause changes in investment, demand, and output. However, they do not cause shifts of the IS curve. Changes in the interest rate cause movements along the IS curve.Diff: 234) A fiscal expansion (e.g. a tax cut) will result in an increase in income, an increase in money demand, and an increase in the equilibrium interest rate in financial markets. Explain what happens to the position of the LM curve as policy makers pursue expansionary fiscal policy. Answer: The fiscal expansion will cause an increase in output. However, changes in Y only cause movements along the LM curve. The effects of changes in Y on the interest rate are embedded in the shape of the LM curve.Diff: 2IS curve.Answer: A Fed sale of bonds will cause a reduction in H and a reduction in the money supply. This will cause an excess demand for money and the interest rate must increase to restore money market equilibrium. The LM curve will shift up as a result of this to reflect the now higher interest rate. The IS curve does not shift as a result of this. We would simply observe a movement along the IS curve.Diff: 236) Explain in detail what effect a reduction in government spending will have on: (1) the LM curve; and (2) the IS curve.Answer: A reduction in taxes will cause an increase in disposable income and an increase in consumption. The rise in C will cause an increase in demand and the equilibrium level of output in the goods market will be higher. This is reflected in a rightward shift in the IS curve. Goods market events such as this will not cause a shift in the LM curve (only a movement along it). Diff: 237) Based on your understanding of the IS-LM model, graphically illustrate and explain what effect a reduction in consumer confidence will have on output, the interest rate, and investment. Answer: A reduction in consumer confidence will cause a reduction in consumption and, therefore, a reduction in demand and a leftward shift in the IS curve. As Y decreases, money demand will decrease causing the interest rate to fall. The effects on I are ambiguous. The lower Y will cause I to fall while the lower interest rate will cause I to increase.Diff: 238) Based on your understanding of the IS-LM model, graphically illustrate and explain what effect a monetary expansion will have on output, the interest rate, and investment.Answer: An increase in M will cause the LM curve to shift down and the interest rate to fall. As the interest rate falls, firms will increase investment causing an increase in demand and subsequent increase in output. So, the interest rate will fall and Y will rise. I will be higher due to the rise in Y and drop in the interest rate.Diff: 239) Increases in the budget deficit are believed to cause reductions in investment. Based on your understanding of the IS-LM model, will a fiscal policy action that causes a reduction in the budget deficit cause an increase in investment? Explain.Answer: A policy that causes a reduction in the budget deficit will have an ambiguous effect on investment. Output will fall which will tend to depress I. However, the interest rate will also fall which will tend to increase I. I could increase, decrease, or remain unchanged.Diff: 2the IS curve.Answer: A Fed purchase of bonds will cause an increase in H and an increase in the money supply. This will cause an excess supply of money and the interest rate must decline to restore money market equilibrium. The LM curve will shift down as a result of this to reflect the now lower interest rate. The IS curve does not shift as a result of this. We would simply observe a movement along the IS curve.Diff: 241) Explain in detail what effect an increase in government spending will have on: (1) the LM curve; and (2) the IS curve.Answer: An increase in government spending will cause an increase in demand and the equilibrium level of output in the goods market will be higher. This is reflected in a rightward shift in the IS curve. Goods market events such as this will not cause a shift in the LM curve (only a movement along it).Diff: 25.4 Using a Policy Mix1) Suppose there is a simultaneous fiscal expansion and monetary expansion. We know with certainty thatA) output will increase.B) output will decrease.C) the interest rate will increase.D) the interest rate will decrease.E) both output and the interest rate will increase.Answer: ADiff: 22) Suppose there is a simultaneous fiscal expansion and monetary contraction. We know with certainty thatA) output will increase.B) output will decrease.C) the interest rate will increase.D) the interest rate will decrease.E) both output and the interest rate will increase.Answer: CDiff: 23) For this question, assume that investment spending depends only on output and no longer depends on the interest rate. Given this information, an increase in government spendingA) will cause investment to decrease.B) will cause investment to increase.C) may cause investment to increase or to decrease.D) will have no effect on output.E) will cause an increase in output and have no effect on the interest rate.Answer: BDiff: 34) A reasonable dynamic assumption for the IS-LM model is thatA) the economy is always on both the IS and LM curves.B) the economy is always on the IS curve, but moves only slowly to the LM curve.C) the economy is always on the LM curve, but moves only slowly to the IS curve.D) the money market is quick to adjust, but the bond market adjusts more slowly.E) adjustment to the new IS-LM equilibrium is instantaneous after an LM shift, but not after an IS shift.Answer: CDiff: 25) Under the reasonable dynamic assumptions discussed in the text, a monetary contraction should result inA) an immediate rise in the interest rate, and no further interest rate changes.B) an immediate rise in the interest rate, and then a fall in the interest rate over time.C) an immediate rise in the interest rate, and then a further rise over time.D) a very gradual but steady rise in the interest rate to its new equilibrium level.E) no change in the interest rate initially, and then a sudden rise to its new equilibrium value. Answer: BDiff: 26) For this question, assume that investment spending depends only on the interest rate and no longer depends on output. Given this information, a reduction in the money supplyA) will cause investment to decrease.B) will cause investment to increase.C) may cause investment to increase or to decrease.D) will have no effect on output.E) will cause a reduction in output and have no effect on the interest rate.Answer: ADiff: 37) Suppose there is a Fed purchase of bonds and simultaneous tax cut. We know with certainty that this combination of policies must causeA) an increase in the interest rate (i).B) a reduction in i.C) an increase in output (Y).D) a reduction in Y.Answer: CDiff: 28) Suppose there is a simultaneous Fed sale of bonds and increase in consumer confidence. We know with certainty that these two simultaneous events will causeA) an increase in the interest rate (i).B) a reduction in i.C) an increase in output (Y).D) a reduction in Y.Answer: ADiff: 29) Suppose there is a simultaneous central bank purchase of bonds and increase in taxes. We know with certainty that this combination of policies must causeA) an increase in the interest rate (i).B) a reduction in i.C) an increase in output (Y).D) a reduction in Y.Answer: BDiff: 210) Suppose there is a simultaneous central bank sale of bonds and tax increase. We know with certainty that this combination of policies must causeA) an increase in the interest rate (i).B) a reduction in i.C) an increase in output (Y).D) a reduction in Y.Answer: DDiff: 211) First, briefly explain what is meant by the policy mix. Second, explain what effect different policy mixes might have on the level of output, investment, and the interest rate.Answer: The policy mix refers to the possible combinations of monetary (exp. or contr.) and fiscal (exp. or contr.) that can be simultaneously implemented. There are a number of different answers that could be given to the latter part of the question. The effects on output, the interest rate, and investment will depend on the type of mix.Diff: 212) Use the IS-LM model to answer this question. Suppose there is a simultaneous increase in government spending and reduction in the money supply. Explain what effect this particular policy mix will have on output and the interest rate. Based on your analysis, do we know with certainty what effect this policy mix will have on investment? Explain.Answer: In this case, the LM curve shifts up and the IS curve shifts to the right. The interest rate will clearly be higher. The effects on output depend on the relative magnitude of the two policies. The effects on I are also ambiguous. If output falls, I will be lower. However, it is possible that output will rise here which creates the ambiguity.Diff: 213) Use the IS-LM model to answer this question. Suppose there is a simultaneous increase in taxes and reduction in the money supply. Explain what effect this particular policy mix will have on output and the interest rate. Based on your analysis, do we know with certainty what effect this policy mix will have on investment? Explain.Answer: In this case, the LM curve shifts up and the IS curve shifts to the left. In this case, output will clearly fall. What happens to the interest rate depends on the relative magnitude of the two policies. The effects on I are again ambiguous.Diff: 214) Use the IS-LM model to answer this question. Suppose there is a simultaneous increase in government spending and increase in the money supply. Explain what effect this particular policy mix will have on output and the interest rate. Based on your analysis, do we know with certainty what effect this policy mix will have on investment? Explain.Answer: In this case, the LM curve shifts down and the IS curve shifts to the right. The output will clearly be higher. The effects on interest rate depend on the relative magnitude of the two policies. The effects on I are also ambiguous. If interest rate falls, I will be higher. However, it is possible that interest rate will rise here which creates the ambiguity.Diff: 25.5 How does the IS-LM Model Fit the Facts?1) Empirically it takes nearly ________ years for monetary policy to have its full effect on output.A) 2B) 1C) 3D) 4Answer: ADiff: 1。
宏观经济学 高鸿业第五版
1. 简述IS—LM模型,结合图形说明。
(P430)答:如果把IS曲线和LM曲线结合在一起,就可得到产品市场和货币市场同时均衡时利息率与均衡国民收入之间的关系,这就是IS-LM模型。
产品市场和货币市场在同一收入水平和利率水平上同时达到均衡时均衡利息率与均衡国民收入的值,可以通过求解IS,LM曲线的联立方程而得。
2.经济中的自动稳定器有哪些?它们是如何发挥作用的?答:自动稳定器主要有三种:(1)税收的变动。
在经济扩张时有遏制作用,在经济萧条时有缓解的作用。
(2)政府的转移支付。
同税收作用相同。
(3)维持农产品价格政策。
该政策使农场主可支配收入保持稳定。
3. 西方国民收入有哪几种核算方法?答: 核算GDP可用生产法、支出法和收入法。
常用的是后两种方法。
4、什么是货币需求?人们需要货币的动机有哪些答:货币需求是指人们在不同条件下出于各种考虑对货币的需要,或者说是个人、企业和政府对执行流通手段(或支付手段)和价值贮藏手段的货币的需求。
按凯恩斯说法,对货币的需求是出于以下几种动机:一是对货币的交易需求动机,指家庭或厂商为交易的目的而形成的对货币的需求。
它产生于人们收入和支出的非同步性。
出于交易动机的货币需求量主要决定于收入,收入越高,交易数量就越大。
二是对货币的预防性需求动机,指人们为应付意外事故而形成的对货币的需求。
它产生于未来收入和支出的不确定性。
从全社会来看,这一货币需求量也和收入成正比。
三是对货币的投机需求动机,它产生于未来利率的不确定,人们为避免资产损失或增加资本收入而及时调整资产结构而形成的对货币的需求。
例如,人们预期债券价格会上升时,需要及时买进债券,以便以后卖出时得到收益,这样就产生了对货币的投机需求。
这一需求与利率成反方向变化。
5、什么是滞胀,滞胀是如何形成的(画图说明)凯歌题库,必属精品AD是总需求曲线,AS S是短期总供给曲线,两者的交点E决定的产量或收入为y,价格水平为P。
现在由于出现供给冲击,短期总供给曲线向左移动到AS′S,总需求曲线和新的短期总供给曲线的交点E′决定的产量或收入为y′,价格水平为P′,这个产量低于原来的产量,而价格水平却高于原来的价格水平,这种情况表示经济处于滞胀状态,即经济停滞和通货膨胀结合在一起的状态。
宏观经济学第五版高鸿业最终版

国内生产总值(GDP):经济社会在一定时期内运用生产要素所生产的全部最终产品(物品和劳务)的市场价值的总和。
第一,GDP 是一个市场价值的概念第二,GDP 统计的是最终产品,而不是中间产品。
第三、GDP 衡量的是一定时期内所生产而不是所售卖的最终产品的价值。
GDP 是由本期所生产的产品和服务的价值构成,不包括过去生产的,当前重复交易的产品。
GDP 是由本期所生产的产品和服务的价值构成,不是指售卖的最终产品价值。
第四、GDP 是流量而非存量。
GDP 度量的是一定时期内的产出价值量,所以是一个流量指标。
流量是指一定时期内发生或产生的变量。
存量是指某一特定时点上观测或测量到的变量。
存量是流量的积累;流量则是存量的改变量。
第五、GDP 按国土原则(常住生产单位)计算,是一个地域概念。
凡是在本国领土上创造的收入,不管是否本国国民,都计入本国的GDP。
第六、GDP 一般仅指市场活动导致的价值。
家务劳动,自给自足生产等非市场活动不计入GDP 中。
GDP的计算:按支出法核算:GDP=C+I+G+(X-M)按收入法核算:GDP=工资+利息+利润+租金+间接税和企业转移支付+折旧其他宏观经济指标1.国内生产净值:NDP 公式: NDP=GDP-固定资产折旧。
2.国民收入:NI 广义:泛指GDP、NDP等经济总量。
或宏观经济学中“国民收入核算”。
狭义:指一国一年用于生产的各种生产要素得到的全部收入,即工资、利润、利息和租金的总和。
公式:NI = NDP-间接税-企业转移支付+政府补贴3.个人收入: PI = NI-公司所得税-社会保险(税费)-公司未分配利润+政府给个人的转移支付(和支付利息等)。
4.个人可支配收入: DPI DPI:个人可实际使用的全部收入。
个人收入DPI用来消费C和储蓄S。
DPI = PI-个人所得税-非税社会支出国民收入的基本公式:1.两部门(私人部门)经济的循环流动模型总需求(总支出)=消费+投资 Y=C+I总供给(总收入)=消费+储蓄 Y=C+S总需求与总供给的恒等式为:C+I=C+S →→I=S当总需求等于总供给时,国民收入实现了均衡。
2024版宏观经济学第五版高鸿业(完整版)

•宏观经济学导论•国民收入核算与决定•失业、通货膨胀与经济增长•货币市场与资本市场均衡目录•开放经济条件下宏观经济政策•总供给-总需求模型及其应用•当代宏观经济问题与挑战01宏观经济学导论研究对象任务研究方法宏观经济学采用总量分析方法,即通过对整个国民经济的活动总量进行综合考察,来研究整个经济的运行状况。
特点宏观经济学具有综合性、整体性和动态性的特点。
综合性体现在它研究的是整个国民经济活动,整体性体现在它考察的是经济总体运行过程中的各种经济现象之间的内在联系,动态性体现在它揭示的是经济总体运行过程中的发展规律及发展趋势。
发展脉络宏观经济学的发展经历了古典宏观经济学、凯恩斯主义宏观经济学、新古典宏观经济学和新凯恩斯主义宏观经济学等阶段。
流派古典宏观经济学强调市场机制的自动调节作用,主张自由放任的经济政策;凯恩斯主义宏观经济学强调国家干预经济的必要性,主张政府通过财政政策和货币政策来调节经济;新古典宏观经济学强调市场机制的完善性,主张政府应减少干预,让市场机制充分发挥作用;新凯恩斯主义宏观经济学则强调市场的不完全性和价格粘性的存在,主张政府应采取适当的干预措施来纠正市场失灵。
宏观经济学发展脉络及流派02国民收入核算与决定1 2 3生产法支出法收入法国内生产总值核算方法国民收入决定理论古典经济学派认为供给会自动创造需求,国民收入的决定取决于劳动、资本等生产要素的供给和有效需求。
凯恩斯主义学派认为有效需求不足是导致经济萧条的原因,主张通过政府干预来刺激总需求,以达到充分就业和经济增长的目标。
新古典综合学派将古典经济学和凯恩斯主义的理论结合起来,认为市场机制和政府干预都是必要的,主张政府在经济中发挥调节作用。
乘数效应与加速原理乘数效应加速原理03失业、通货膨胀与经济增长摩擦性失业结构性失业由于经济结构变化、产业转型升级等原因导致的失业。
总需求不足工资刚性实施积极的财政政策完善劳动力市场提高劳动者素质需求拉上型通货膨胀总需求超过总供给,导致物价上涨。
宏观经济学之商品与金融市场:IS-LM模型 Goods and Financial Market The IS-LM Model
5-2:Financial Market and the LM Relation
Real Money, Real Income, and the Interest Rate The LM Curve Shifts in the LM Curve Summarize
Real Money, Real Income, and
Interest rate,i LM
i
D
A
i'
A'
IS
IS'
Y' Y Output,Y
Monetary Policy,Activity,and the Interest
Interest rate,i
i
A
LM(for M/P) LM' (for M'/P>M/P)
i'
A'
IS
Y Y' Output,Y
i'
A'
Md'(for Y'>Y)
i
A
Md(for Income Y)
M/P (Real)money,M/P
The Derivation of the LM Curve
Interest,i
Interest,i Ms
LM Curve
i'
A'
i'
A'
Md'
(for Y'>Y)
i
A
i
A
Md(for Y)
M/P=YL(i)
(5.3)
From now on, we shall refer to equation (5.3) as the LM relation.
2020版曼昆版宏观经济学(第十版)课件第5章

通过发行货币筹集到的收益在各国之间差别很大。在美国,数额很小:货 币铸造税通常不到政府收入的3%。在意大利和希腊,货币铸造税常常占到 政府收入的10%以上。 在经历恶性通货膨胀的国家里,货币铸造税常常是 政府的主要收入来源。
货币需求函数(money demand function)是一个表明人们希望持有的
实际货币余额数量的决定因素的方程, 。简单的货币需求函数是
(M/P)d=kY
式中,k为常数,它告诉我们对于每1美元的收入,人们想要持有的货币是多少。
这个方程说明,实际货币余额需求量与实际收入成比例。
货币需求函数类似于某一特定产品的需求函数。在这里,“产品”是持有实际货
为货币的交易流通速度(transactions velocity of money),它衡量货币在
经济中流通的速度。换言之,货币流通速度告诉我们,在一个给定的时期一张
美元钞票转手的次数。
2020/9/26
例如,假定在某一年中以每块2美元的价格出售了50块面包。因此,T等 于每年50块面包,P等于每块面包2美元。交换的货币总量为
5.2 货币铸造税:从发行货币得到的收益
到现在为止,我们看到了货币供给增长如何引起通货膨胀。既然有通货膨胀 这样的后果,是什么因素使得中央银行大量增加货币供给?
让我们从一个无可争辩的事实出发:所有政府都支出货币。这种支出中 的一些用于购买产品与服务(例如道路和警察),一些提供转移支付(例如,对 穷人和老年人的转移支付)。
宏观经济学-课后思考题答案_史蒂芬威廉森005
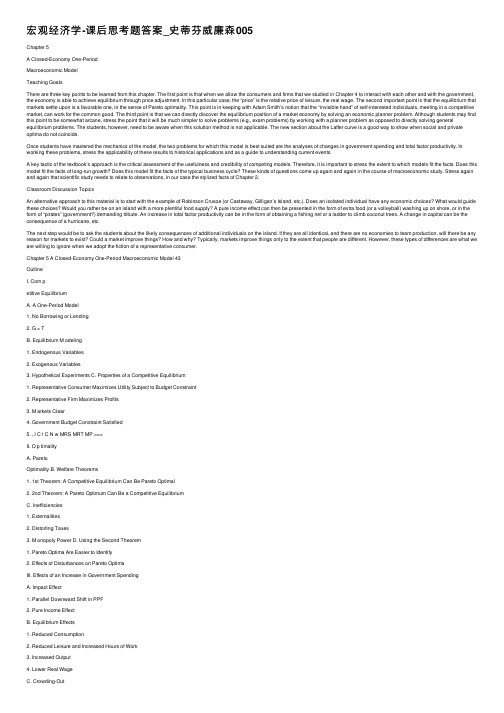
宏观经济学-课后思考题答案_史蒂芬威廉森005Chapter 5A Closed-Economy One-PeriodMacroeconomic ModelTeaching GoalsThere are three key points to be learned from this chapter. The first point is that when we allow the consumers and firms that we studied in Chapter 4 to interact with each other and with the government, the economy is able to achieve equilibrium through price adjustment. In this particular case, the “price” is the relative price of leisure, the real wage. The second important point is that the equilibrium that markets settle upon is a favorable one, in the sense of Pareto optimality. This point is in keeping with Adam Smith’s notion that the “invisible hand” of self-interested individuals, meeting in a competitive market, can work for the common good. The third point is that we can directly discover the equilibrium position of a market economy by solving an economic planner problem. Although students may find this point to be somewhat arcane, stress the point that it will be much simpler to solve problems (e.g., exam problems) by working with a planner problem as opposed to directly solving general equilibrium problems. The students, however, need to be aware when this solution method is not applicable. The new section about the Laffer curve is a good way to show when social and private optima do not coincide.Once students have mastered the mechanics of the model, the two problems for which this model is best suited are the analyses of changes in government spending and total factor productivity. In working these problems, stress the applicability of these results to historical applications and as a guide to understanding current events.A key tactic of the textbook’s approach is the critical assessment of the usefulness and credibility of competing models. Therefore, it is important to stress the extent to which models fit the facts. Does this model fit the facts of long-run growth? Does this model fit the facts of the typical business cycle? These kinds of questions come up again and again in the course of macroeconomic study. Stress again and again that scientific study needs to relate to observations, in our case the stylized facts of Chapter 2.Classroom Discussion TopicsAn alternative approach to this material is to start with the example of Robinson Crusoe (or Castaway, Gilligan’s Island, etc.). Does an isolated individual have any economic choices? What would guide these choices? Would you rather be on an island with a more plentiful food supply? A pure income effect can then be presented in the form of extra food (or a volleyball) washing up on shore, or in the form of “pirates” (government?) demanding tribute. An increase in total factor productivity can be in the form of obtaining a fishing net or a ladder to climb coconut trees. A change in capital can be the consequence of a hurricane, etc.The next step would be to ask the students about the likely consequences of additional individuals on the island. If they are all identical, and there are no economies to team production, will there be any reason for markets to exist? Could a market improve things? How and why? Typically, markets improve things only to the extent that people are different. However, these types of differences are what we are willing to ignore when we adopt the fiction of a representative consumer.Chapter 5 A Closed-Economy One-Period Macroeconomic Model 43OutlineI. Com petitive EquilibriumA. A One-Period Model1. No Borrowing or Lending2. G = TB. Equilibrium M odeling1. Endogenous Variables2. Exogenous Variables3. Hypothetical Experiments C. Properties of a Competitive Equilibrium1. Representative Consumer Maximizes Utility Subject to Budget Constraint2. Representative Firm Maximizes Profits3. M arkets Clear4. Government Budget Constraint Satisfied5. ,,l C l C N w MRS MRT MP ===II. O p timalityA. ParetoOptimality B. Welfare Theorems1. 1st Theorem: A Competitive Equilibrium Can Be Pareto Optimal2. 2nd Theorem: A Pareto Optimum Can Be a Competitive EquilibriumC. Inefficiencies1. Externalities2. Distorting Taxes3. M onopoly Power D. Using the Second Theorem1. Pareto Optima Are Easier to Identify2. Effects of Disturbances on Pareto OptimaIII. Effects of an Increase in Government SpendingA. Impact Effect1. Parallel Downward Shift in PPF2. Pure Income EffectB. Equilibrium Effects1. Reduced Consumption2. Reduced Leisure and Increased Hours of Work3. Increased Output4. Lower Real WageC. Crowding-OutD. Government Spending a Source of Business Cycles?1. Government Spending Shocks Wrongly Predict Countercyclical Consumption2. Government Spending Shocks Wrongly Predict Countercyclical Real Wages44 Williamson ? Macroeconomics, Third EditionIV. Effects of an Increase in Total Factor ProductivityA. Impact Effect1. Upward Shift in PPF2. Steeper PPF3. Income and Substitution EffectsB. Equilibrium Effects1. Increased Consumption2. Leisure and Hours Worked May Rise or Fall3. Increased Output4. Higher Real WageC. Productivity and Long-Run Growth1. Consumption Grows over Time2. Hours Worked Remain about Constant3. Output Increases over Time4. Real Wages Rise over TimeD. Productivity as Source of Business Cycles?1. Consumption Is Procyclical2. Cyclical Properties of Hours Workeda. Procyclical Hours Worked Is a Business Cycle Factb. Need Strong Substitution Effect to Predict Procyclical Hoursc. Intertemporal Substitution of Leisure3. Increased Output Defines the Cycle4. Procyclical Real Wage RateV. Income Tax Revenue and the Laffer CurveA. Tax Revenue1. The Tax Base Depends on the Proportional Tax Rate2. The Laffer Curve Measures Tax Revenue as a Function of the Tax Rate3. Unless the Tax Rate Is Optimal, Two Tax Rates Yield the Same Tax Revenue4. Supply-Side Economists Claim the U.S. Economy Is at the Bad Tax Rate5. Empirical Evidence Tends to Prove Supply-Side Economists WrongTextbook Question SolutionsQuestions for Review1. A closed economy is easier to work with. Opening the economy does not change most of theproperties of an economy. The closed economy is the correct model for the world as a whole.2. Government levies taxes and purchases consumption goods.3. In a one-period model, there can be no borrowing or lending. There is therefore no way to finance agovernment deficit.4. Endogenous variables: C, N s, N d, T, Y, and w.5. Exogenous variables: G, z, K.Chapter 5 A Closed-Economy One-Period Macroeconomic Model 456. The representative consumer chooses C and N s to maximize utility.The representative firm chooses N d to maximize profits.M arket-clearing: .s d N N N == Government budget constraint: T = G .7. The slope of the production possibilities frontier is equal to .N MP ? The slope of the productionpossibilities frontier is also identified as ,,l C MRT ? where ,l C MRT is identified as the marginal rate oftransformation between leisure and consumption.8. The competitive equilibrium is Pareto optimal because it lies at a tangency point between theproduction possibilities frontier and a representative consumer’s indifference curve.9. The first theorem: A competitive equilibrium can be Pareto optimal. This theorem assures us that thecompetitive equilibrium is a good outcome. The second theorem: A Pareto optimum is a competitive equilibrium. This theorem allows us to directly analyze Pareto optima with the assurance that these points are also competitive equilibriums. The second theorem is useful because Pareto Optima are often easier to work with than competitive equilibriums.10. Externalities, noncompetitive behavior, and distorting taxes.11. , ,, , and .G Y C N l w ↑?↑↓↑↓↓ 12. Government competes with the private sector in buying goods. An increase in government spendingimplies a negative wealth effect, which results in lower consumption.13. , , and .z Y C w ↑?↑↑↑ The sign of the effects on N and l are ambiguous.14. The substitution effect of an increase in z is that the representative consumer works more hours. Theincome effect of an increase in z is that the representative household works more hours. The sign of the net effect is ambiguous.15. A distorting tax makes that households equalize their marginal rate of substitution between leisureand consumption to the after tax wage, which is different from the before tax wage that firms equalize their marginal rate of transformation to. Thus, one cannot achieve the Pareto optimum where the same wage (before tax) is equal to both marginal rates above.16. The Laffer curve takes into account that higher proportional tax rates give incentives to households towork less. While tax revenue increases with the tax rate for a given tax base, that tax base is reduced by the tax rate.17. When the income tax rate falls, households are willing to supply additional labor more in suchquantities that the tax base increases more than what the tax rate decreases, thus increasing taxrevenue.46 Williamson ? Macroeconomics, Third EditionProblems1. Although we often think about the negative externalities of congestion and pollution in cities, theremay also be some positive externalities. A concentrated population is better able to support the arts and professional sports; cities typically have a greater variety of good restaurants, etc. Perhaps a more basic issue is that there may be some increasing returns to scale at low output levels that makeindustrial production more costly in small towns. There may also be externalities in production in being located close to other producers. One example would be the financial industry in financial centers like New York, London, Tokyo, etc. Another example would be large city medical centers that enhance coordination between primary physicians and specialists.One market test of whether productivity is higher in cities would be to look at the wages in cities versus the wages in smaller towns and rural areas. Wages are often higher in cities for individuals of comparable skills. Market efficiency suggests that the higher wages be reflective of a higher marginal product of labor, and that the higher wages compensate those choosing to live in cities for the negative externalities that they face.2. In a one period model, taxes must be exactly equal to government spending. A reduction in taxes istherefore equivalent to a reduction in government spending. The result is exactly opposite of the case of an increase in government spending that is presented in the text. A reduction in government spending induces a pure income effect that induces the consumer to consume more and work less. At lower employment, the equilibrium real wage is higher because the marginal product of labor rises when employment falls. Output falls, consumption rises, employment falls and the real wage rises.3. The only impact effect of this disturbance is to lower the capital stock. Therefore, the productionpossibility frontier shifts down and the marginal product of labor falls (PPF is flatter).(a) The reduction in the capital stock is depicted in the figure below. The economy starts at point Aon PPF1. The reduction in the capital stock shifts the production possibilities frontier to PPF2.Because PPF2 is flatter, there is a substitution effect that moves the consumer to point D. Theconsumer consumes less of the consumption good and consumes more leisure. Less leisure also means that the consumer works more. Because the production possibilities frontier shifts down, there is also an income effect. The income effect implies less consumption and less leisure (more work). On net, consumption must fall, but leisure could decrease, remain the same, or increase, depending on the relative strengths of the income and substitution effect. The real wage must also fall. To see this, we must remember that, in equilibrium, the real wage must equal the marginal rate of substitution. The substitution effect implies a lower marginal rate of substitution. The income effect is a parallel shift in the production possibilities frontier. As the income effect increases the amount of employment, marginal product of labor must fall from point D topoint B. This reinforces the reduction in the marginal rate of substitution from point A to point D.Chapter 5 A Closed-Economy One-Period Macroeconomic Model 47(b) Changes in the capital stock are not likely candidates for the source of the typical business cycle.While it is easy to construct examples of precipitous declines in capital, it is more difficult toimagine sudden increases in the capital stock. The capital stock usually trends upward, and thisupward trend is important for economic growth. However, the amount of new capital generatedby a higher level of investment over the course of a few quarters, of a few years, is very small in comparison to the existing stock of capital. On the other hand, a natural disaster that decreases the stock of capital implies lower output and consumption, and also implies lower real wages,which are all features of the typical business cycle contraction.4. Government Productivity. First consider the benchmark case in which 1,z= and there is no effect of changes in z on government activities. Now suppose that z increases. This case of an increase in z isdepicted in the figure below. The original production possibilities frontier is labeled PPF1 and thecompetitive equilibrium is at point A. If the increase in z only affects the economy through thechange in (,),zF K N then the new production possibilities frontier is PPF2. The diagram shows acase in which the income and substitution effects on leisure exactly cancel out, and the economy moves to point B. The equation for the production possibilities frontier is (,).C zF K h l T=?? In the benchmark case, T G= and so we have (,).C zF K h l G=?? For this problem, /T G z=, and so the production possibilities frontier is given by (,)/.C zF K h l G z=?? When 1,z= the two PPFs coincide. When z increases, the vertical intercept of the PPF increases by /.G zΔ Therefore, the newPPF is PPF3 in the figure below. The competitive equilibrium is at point C. There is an additionalincome effect that provides an additional increase in equilibrium consumption, and a reinforced income effect that tend to make leisure increase. Therefore, relative to the benchmark case, there is a larger increase in consumption, and either a smaller decrease in leisure or a larger increase in leisure.48 Williamson ? Macroeconomics, Third Edition5. Change in preferences.(a) At the margin, the consumer decides that leisure is more preferred to consumption. That is, theconsumer now requires a bigger increase in consumption to willingly work more (consume lessleisure). In more intuitive language, the consumer is lazier.(b) To work out the effects of this change in tastes, we refer to the figure below. The productionpossibility frontier in this example is unchanged. The consumer now picks a new point at which one of the flatter indifference curves is tangent to the production possibilities frontier. That is,equilibrium will shift from point A to point B. Consumption falls and leisure rises. Therefore, the consumer works less and produces less. Because employment has fallen, it also must be the case that the real wage increases.(c) This disturbance, which some might characterize as a contagious outbreak of laziness, wouldhave the appearance of a recession, as output and employment both fall. The consequentreduction in consumption is also consistent with a typical recession. However, in this case thereal wage would rise, which is inconsistent with the business cycle facts. Therefore, this type ofpreference change is not a cause of recessions.Chapter 5 A Closed-Economy One-Period Macroeconomic Model 496. Production-enhancing aspects of government spending.(a) The increase in government spending in this example has two separate effects on the productionpossibilities frontier. First, the increase in government spending from G1 to G2implies a paralleldownward shift in the production possibilities frontier. Second, the productive nature of government spending is equivalent to an increase in total factor productivity that shifts the production possibilities frontier upward and increases its slope. The figure below draws theoriginal production possibilities frontier as PPF1 and the new production possibilities frontier asPPF2. If the production-enhancing aspects of the increase in government spending are largeenough, representative consumer utility could rise, as in this figure.(b) There are three effects at work in this example. First, there is a negative income effect from theincrease in taxes needed to pay for the increased government spending. This effect tends to lower both consumption and leisure. Second, there is a substitution effect due to the productive effect of the increase in G, which is drawn as the movement from point A to point D. This effect tends to increase both consumption and leisure. Third, there is a positive income effect from theincrease in G on productivity. This effect tends to increase both consumption and leisure. In the figure above, the movement from point D to point B is the net effect of the two income effects. In general, consumption may rise or fall, and leisure may rise or fall. The overall effect on output is the same as in any increase in total factor productivity. Output surely rises.50 Williamson ? Macroeconomics, Third Edition7. The fact that government spending make firms more productive is similar to adding G to theproduction function. There are now two effects to an increase in government expenses: the standard crowding out of consumption, and now also an efficiency effect on production.(a) The figure below illustrates a particular situation where the welfare of the household is improved,as illustrated by a shift to the north-east of the indifference curve. The equilibrium shifts fromA toB as the PPF is lowered by the additional government expenses but is also getting steeperthanks to the same government expenses.(b) From previous results, we know that output increases with the increase in government expenses.This is now reinforced as G increases production efficiency. Regarding consumption and leisure, without this new effect, we obtained that an increase in G lead to a negative income effect andthus to decreases in both consumption and leisure. But as the real wage went down, there wasalso a substitution effect leading to an additional decrease in consumption and increase in leisure.The new effect on the production function adds opposite effects: a positive income effect and awage increase, thus possibly reversing, or not, anything that was concluded without the impact ofG on production.Chapter 5 A Closed-Economy One-Period Macroeconomic Model 51 8. We need to analyze each case separately. Start with the good equilibrium. As government expensesincrease, more tax revenue needs to be raised, and thus the tax rate needs to be increased. As shown in the figure below, this tilts down the linear PPF. The new equilibrium leads to a lower indifference curve. This leads to a negative income effect and a lower wage (remember, it is z(1 ? t)), thus a substitution effect. The income effect lowers consumption and leisure, the substitution effectdecreases consumption and increases leisure. All in all, consumption is lower and leisure is higher, as we know that the substitution effect dominates the income effect. This means that the labor supplyis reduced, and thus equilibrium labor and output.The story is different in the bad equilibrium. To increase tax revenue, one needs to reduce the tax rate. Then all the changes discussed above are exactly in the opposite direction.9. We know from previous analysis that an improvement in total factor productivity pushes up the PPF,and thus leads to an increase in consumption, a decrease in leisure, and thus an increase in thequantity of labor supplied. This increases the tax base, and thus allows to reduce the tax rate toachieve the same tax revenue, or in other words, it pushes the left portion of the Laffer curve to the left. The reduction in the tax rate has then a further impact on the variables of interest: as we saw in question 7, first part with a reversal of all signs: consumption increases even more and leisure decrease yet more, leading to an even higher quantity of labor. All in all, as both labor and total factorproductivity increase, output increases.。
宏观经济学第5章PPT课件

制作者:张昌廷(河北经贸大学)
11
第五章 成本论 第三节 短期成本曲线
一、短期成本的分类
1.总不变成本TFC 总不变成本是厂商在短期内为生产一定数量的产品
对不变生产要素所支付的总成本。 总不变成本是一个常数,它不随产量的变化而变化,
即使产量为零时,总不变成本也仍然存在,因而TFC曲线 是一条水平线。
一、短期总产量曲线和短期总成本曲线的关系
由厂商短期生产函数出发,可以得到相应的短期成 本函数,也可从厂商的短期总产量曲线出发,也可以得 到相应的短期总成本曲线。
2020/11/13
制作者:张昌廷(河北经贸大学)
8
图5—1 短期总成本曲线
2020/11/13
制作者:张昌廷(河北经贸大学)
9
第五章 成本论 第二节 短期总产量和短期总成本
MC曲线呈现出U型。
2020/11/13
制作者:张昌廷(河北经贸大学)
18
图5—3 各类短期成本曲线
2020/11/13
制作者:张昌廷(河北经贸大学)
19
第五章 成本论 第三节 短期成本曲线
二、短期成本曲线的综合图
1.TC曲线和TVC曲线
TC曲线是一条由水平的TFC曲线与纵轴的交点出发的 向右上方倾斜的曲线。在每一个产量上,TC曲线和TVC曲 线两者的斜率都是相同的,且TC曲线和TVC曲线之间的垂 直距离都等于固定的不变成本TFC。
2020/11/13
制作者:张昌廷(河北经贸大学)
12
第五章 成本论 第三节 短期成本曲线
一、短期成本的分类
2.总可变成本TVC 总可变成本是厂商在短期内生产一定数量的产品对
可变生产要素支付的总成本。例如,厂商对原材料、燃 料动力和工人工资的支付等属于可变成本。
- 1、下载文档前请自行甄别文档内容的完整性,平台不提供额外的编辑、内容补充、找答案等附加服务。
- 2、"仅部分预览"的文档,不可在线预览部分如存在完整性等问题,可反馈申请退款(可完整预览的文档不适用该条件!)。
- 3、如文档侵犯您的权益,请联系客服反馈,我们会尽快为您处理(人工客服工作时间:9:00-18:30)。
Inflation
5
Velocity, cont.
This suggests the following definition:
T V M
where
V = velocity
T = value of all transactions M = money supply
CHAPTER 5
CHAPTER 5
Inflation
4
Velocity
basic concept:
the rate at which money circulates
definition: the number of times the average
dollar bill changes hands in a given time period
markets clear
Applies to the long run
1
ቤተ መጻሕፍቲ ባይዱ
U.S. inflation and its trend,
1960–2012
12%
% change from 12 mos. earlier
10%
% change in GDP deflator
8%
6%
4%
2%
0% 1960 1965 1970 1975 1980 1985 1990 1995 2000 2005 2010
M2 growth rate
inflation rate
0% 1960 1965 1970 1975 1980 1985 1990 1995 2000 2005 2010
U.S. inflation and money growth,
1960–2012
14%
% change from 12 mos. earlier
The result from the preceding slide:
Solve this result for :
M
P
P
P
M
P
Y
Y
M
M
Y
Y
CHAPTER 5
Inflation
14
The quantity theory of money, cont.
M
M
CHAPTER 5
Inflation
9
Money demand and the quantity equation
money demand: quantity equation:
(M/P )d = kY
MV=PY
The connection between them: k = 1/V When people hold lots of money relative
Then, quantity equation becomes:
M V P Y
CHAPTER 5
Inflation
11
The quantity theory of money, cont.
M V P Y
How the price level is determined:
With V constant, the money supply determines
P Y V M
P Y = value of output
CHAPTER 5
Inflation
7
The quantity equation
The quantity equation
MV = PY follows from the preceding definition of velocity.
2. The long-run trend in a country’s inflation rate
should be similar to the long-run trend in the country’s money growth rate.
Are the data consistent with these implications?
Y
Y
Normal economic growth requires a certain
amount of money supply growth to facilitate the growth in transactions.
Money growth in excess of this amount leads
Chapter 5 Inflation: Its Causes, Effects, and Social Costs
CHAPTER 5
Inflation
0
IN THIS CHAPTER, YOU WILL LEARN:
The classical theory of inflation causes effects social costs ―Classical‖ – assumes prices are flexible &
example: In 2012, $500 billion in transactions money supply = $100 billion The average dollar is used in five transactions
in 2012 So, velocity = 5
to inflation.
CHAPTER 5
Inflation
15
The quantity theory of money, cont.
M
M
Y
Y
Y/Y depends on growth in the factors of production and on technological progress (all of which we take as given, for now). Hence, the quantity theory predicts a one-for-one relation between changes in the money growth rate and changes in the inflation rate.
The inflation tax:
Printing money to raise revenue causes inflation. Inflation is like a tax on people who hold money.
CHAPTER 5
Inflation
21
Inflation and interest rates
Seigniorage
To spend more without raising taxes or selling
bonds, the govt can print money.
The ―revenue‖ raised from printing money
is called seigniorage (pronounced SEEN-your-idge).
power of the money supply.
A simple money demand function:
(M/P )d = kY where k = how much money people wish to hold for each dollar of income. (k is exogenous)
to their incomes (k is large), money changes hands infrequently (V is small).
CHAPTER 5
Inflation
10
Back to the quantity theory of money
starts with quantity equation assumes V is constant & exogenous: V V
CHAPTER 5
Inflation
12
The quantity theory of money, cont.
Recall from Chapter 2:
The growth rate of a product equals the sum of the growth rates.
The quantity equation in growth rates:
Inflation
6
Velocity, cont.
Use nominal GDP as a proxy for total
transactions. Then,
where
P Y = price of output = quantity of output (GDP deflator) (real GDP) (nominal GDP)
U.S. inflation and its trend,
1960–2012
12%
% change from 12 mos. earlier
10%
8%
long-run trend
6%
4%
2%
0% 1960 1965 1970 1975 1980 1985 1990 1995 2000 2005 2010
CHAPTER 5
Inflation
16
Confronting the quantity theory with data
The quantity theory of money implies:
1. Countries with higher money growth rates