图表式作文写作模板
初中英语作文图表类模板及范文
初中英语作文图表类模板及范文In the realm of English essay writing for junior high students, the chart and graph essay genre poses a unique challenge. This type of essay requires students to analyze and interpret data presented visually, translate it into meaningful insights, and then communicate these insights clearly and coherently. To assist students in this endeavor, a template and sample essay are provided below.**Template for Chart/Graph Essay**1. **Introduction**:* Briefly introduce the chart/graph and its purpose.* State the main trend or observation. 2. **Body Paragraph 1**:* Describe the data related to the first key aspect of the chart/graph. * Analyze the reasons behind the trend or observation. * Discuss the significance or implicationsof this trend. 3. **Body Paragraph 2**:* Describe the data related to the second key aspect of the chart/graph. * Analyze the reasons behind the trend orobservation. * Discuss the significance or implications of this trend. 4. **Conclusion**:* Summarize the main trends and observations. * Provide a closing thought or recommendation based on the analysis.**Sample Essay****Title**: Interpreting Trends in Teenage Sleep Habits In the chart below, we see a comparison of average sleep hours among teenagers in different countries. The chart reveals a concerning trend: the majority of teenagers in these countries are not getting enough sleep.In the United States, the average teenager sleeps just over 7 hours per night, which is below the recommended 8-10 hours. This could be due to various factors, such as late-night social media use, academic pressure, or extracurricular activities. The lack of sufficient sleep among American teenagers could have serious implicationsfor their health and academic performance.In contrast, teenagers in China sleep an average of over 8 hours per night. This could be attributed tocultural differences in sleep habits or the relatively lighter academic workload compared to their peers in the United States. The higher sleep hours among Chinese teenagers might explain their better performance in international academic competitions.Overall, the chart highlights the need for a global effort to improve sleep habits among teenagers. Parents, educators, and policymakers should work together to create an environment that encourages healthy sleep patterns. For example, schools could implement earlier start times and provide more breaks during the day to encourage better sleep habits among students. Additionally, parents can set limits on screen time before bedtime and ensure a quiet and comfortable sleep environment for their children. By prioritizing sleep, we can help teenagers achieve theirfull potential both academically and physically.**解析**:这篇图表类英语作文围绕“青少年睡眠习惯的趋势”展开。
图表型英语作文模板
图表型英语作文模板篇一:英语作文图表类提纲类作文写作模板第一部分、写作模板——图表式作文It is obvious in the graphic/table that the rate/number/amount of Y has undergone dramatic changes. It has gone up/grown/fallen/dropped considerably in recent years (as X varies). At the point of X1, Y reaches its peak of …(多少).What is the reason for this change? Mainly there are …(多少) reasons behind the situation reflected in the graphic/table. First of all, …(第一个原因). More importantly, …(第二个原因). Most important of all, …(第三个原因).From the above discussions, we have enough reason to predict what will happen in the near future. The trend described in the graphic/table will continue for quite a long time (if necessary measures are not taken括号里的使用于那些不太好的变化趋势).第二部分、写作模板——提纲式作文一、说明原因型模块(一)Nowadays , there are more and more XX in some big cities . It is estimated that ( 1 ). Why have there been so many XX ? Maybe thereasons can be listed as follows.The first one is that ( 2 ) .Besides, ( 3 ) . The third reason is ( 4 ). To sum up , the main cause of XX is due to ( 5 ) .It is high time that something were done upon it. For one thing , ( 6 ). On the other hand , ( 7 ). All these measures will certainly reduce the number of XX .注释:(1)用具体数据说明XX现象;(2)原因一;(3)原因二;(4)原因三(5)指出主要原因;(6)解决建议一;(7)解决建议二。
高考备考写作专题:图表分析作文

高考备考写作专题:图表分析作文第一篇:全球二氧化碳排放量变化趋势随着工业化和现代化的发展,全球二氧化碳排放量不断增加,给地球的生态环境带来了巨大挑战。
下面是一幅描述全球二氧化碳排放量变化趋势的图表。
从图表中可以看出,自20世纪50年代开始,全球二氧化碳排放量呈现出逐年增加的趋势。
在20世纪70年代到80年代之间,排放量增速开始明显加快,到了90年代更是达到了高峰。
然而,在近几年,尽管二氧化碳排放量仍然在增加,但增速明显放缓。
造成全球二氧化碳排放量增加的原因有很多,但主要是工业生产、能源消耗和交通运输等活动所引起的。
这些活动大量使用化石燃料,例如煤炭、石油和天然气,导致了大量的二氧化碳释放到大气中。
全球二氧化碳排放量的增加给地球的生态环境带来了诸多问题。
首先,大量的二氧化碳排放导致大气中温室气体浓度升高,进而造成气候变化,例如全球气温上升、极端天气事件增多等。
其次,二氧化碳还会导致海洋酸化,对海洋生物造成威胁。
此外,由于空气污染加剧,人们的健康也受到了威胁。
为了应对全球二氧化碳排放量增加的问题,各国政府和国际组织已经采取了一系列的措施,例如限制工业排放、推广清洁能源和绿色交通等。
但要真正解决二氧化碳排放问题,还需要全球各方共同努力,包括改变生活方式、提高环保意识等。
第二篇:中国城市人口增长随着城市化进程的不断推进,中国城市人口呈现出快速增长的趋势。
下面是一幅描述中国城市人口增长的图表。
从图表中可以看出,1990年以前,中国城市人口增长较为缓慢,但之后迅速加快。
尤其是在2000年以后,城市人口增长速度急剧提升。
目前,中国的城市化率已经超过了50%。
城市人口增长的原因有很多,主要是农村人口向城市转移和城市自然增长导致的。
一方面,农村居民为了追求更好的生活条件和就业机会,纷纷涌向城市。
另一方面,由于医疗水平的提高和生活条件的改善,城市人口的自然增长也较快。
城市人口增长给中国带来了很多挑战。
首先,城市人口的快速增加导致了城市基础设施和公共服务压力的加大。
专四图表作文模板

专四图表作文模板英文回答:The chart illustrates the changes in the number of students attending university in three different countries over a period of ten years, from 2010 to 2020. As can be seen from the graph, the number of students in China has significantly increased, while the number of students inthe United States and the United Kingdom has remained relatively stable.In 2010, the number of students in China was around 25 million, which was significantly lower than the number of students in the United States and the United Kingdom, which were around 30 million and 20 million respectively. However, over the next ten years, the number of students in China increased rapidly, reaching over 40 million in 2020. In contrast, the number of students in the United States and the United Kingdom only increased slightly, with the United States reaching around 32 million and the United Kingdomreaching around 22 million in 2020.There are several reasons for this trend. Firstly,China has experienced rapid economic growth over the past decade, which has led to an increase in the number of families who can afford to send their children to university. Secondly, the Chinese government has invested heavily in education, with the aim of producing more highly skilled graduates who can contribute to the country's economic development. Finally, the popularity of online education has also contributed to the increase in the number of students in China.中文回答:这张图表展示了三个不同国家在2010年至2020年期间大学生人数的变化情况。
英语四级写作万能模板:图表类作文
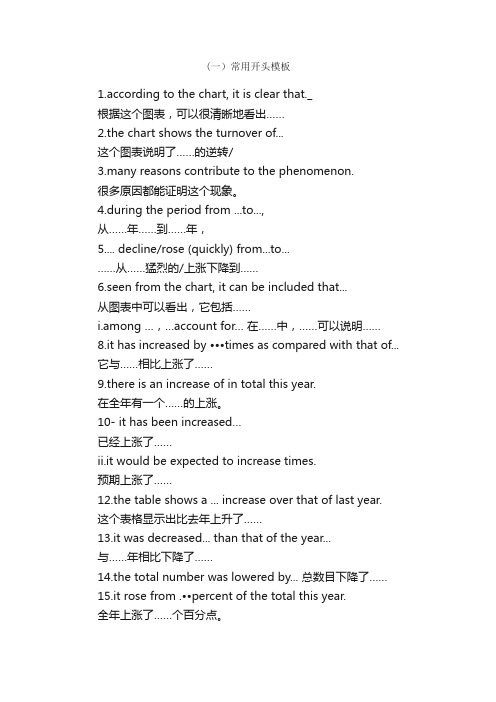
(一)常用开头模板1.according to the chart, it is clear that._根据这个图表,可以很清晰地看出……2.the chart shows the turnover of...这个图表说明了……的逆转/3.many reasons contribute to the phenomenon.很多原因都能证明这个现象。
4.during the period from ...to..., 从……年……到……年,5.... decline/rose (quickly) from...to...……从……猛烈的/上涨下降到……6.seen from the chart, it can be included that...从图表中可以看出,它包括……i.among …,…account for… 在……中,……可以说明……8.it has increased by •••times as compared with that of... 它与……相比上涨了……9.there is an increase of in total this year.在全年有一个……的上涨。
10- it has been increased…已经上涨了……ii.it would be expected to increase times.预期上涨了……12.the table shows a ... increase over that of last year.这个表格显示出比去年上升了……13.it was decreased... than that of the year...与……年相比下降了……14.the total number was lowered by... 总数目下降了……15.it rose from .••percent of the total this year.全年上涨了……个百分点。
英语图表作文模板及精选4篇

英语图表作文模板及精选4篇(经典版)编制人:__________________审核人:__________________审批人:__________________编制单位:__________________编制时间:____年____月____日序言下载提示:该文档是本店铺精心编制而成的,希望大家下载后,能够帮助大家解决实际问题。
文档下载后可定制修改,请根据实际需要进行调整和使用,谢谢!并且,本店铺为大家提供各种类型的经典范文,如总结报告、合同协议、规章制度、条据文书、策划方案、心得体会、演讲致辞、教学资料、作文大全、其他范文等等,想了解不同范文格式和写法,敬请关注!Download tips: This document is carefully compiled by this editor. I hope that after you download it, it can help you solve practical problems. The document can be customized and modified after downloading, please adjust and use it according to actual needs, thank you!Moreover, our store provides various types of classic sample essays, such as summary reports, contract agreements, rules and regulations, doctrinal documents, planning plans, insights, speeches, teaching materials, complete essays, and other sample essays. If you want to learn about different sample formats and writing methods, please pay attention!英语图表作文模板及精选4篇学而不思则罔,思而不学则殆,以下是本店铺给大伙儿收集整理的英语图表作文模板及精选4篇,欢迎参考。
雅思图表作文万能模板
雅思图表作文万能模板英文回答:Introduction。
The bar chart illustrates the percentage of people in three age groups who engage in three different activities: reading books, watching TV, and using the internet. The data was collected from a survey conducted in a particular region, and the results provide insights into the leisure activities of different age groups.Overall Observation。
In general, the chart reveals that the youngest age group (aged 18-24) has the highest engagement in all three activities compared to the middle-aged (aged 35-44) and elderly (aged 65+) groups.Reading Books。
The youngest age group (aged 18-24) exhibits the highest percentage of readers, with 75% engaging in this activity. In contrast, the middle-aged group has a significantly lower percentage of readers (50%), and the elderly group has the lowest percentage (30%).Watching TV。
高考英语图表作文模板和范例
图表式作文It is obvious in the graphic/table that the rate/number/amount of Y has undergone dramatic changes. It has gone up/grown/fallen/dropped considerably in recent years (as X varies). At the point of X1, Y reaches its peak value of ...(多少).What is the reason for this change? Mainly there are ... (多少) reasons behind the situation reflected in the graphic/table. First of all, ...(第一个原因). More importantly, ...(第二个原因). Most important of all, ...(第三个原因).第一段:The table/graph/chart shows, as far as ______(is/are)concerned, _______________________.第二段:(第二段分为三种情况:1、一直上升;2、一直下降;3、一部分上升,一部分下降。
下面针对这三种情况进行结构模仿)。
1、(以1978年到1998年城镇乡村收入的稳步较长图为例)。
a.一直上升According to the figures show in the graph, we can see that________, had been increasing at a steady rate from the year of 1978 to 1998. In addition, during the period, ____________had raise from 349.9 Yuan to 5425 Yuan, morethan 5 times .Meanwhile, _______had also grown from 133.6 Yuan to 2100 Yuan.b. 一直下降According to the figures show in the graph, we can see that___________, had been decreasing at e steady rate from the year of 1978 to 1998. In addition, during the periond,____________had reduced from 349.9 Yuan to 5425 Yuan, more than 5 times .Meanwhile ,_______had also gone down 133.6 Yuan to 2100 Yuan.2、[以从1995年到1999年西安人的日常生活支出(食物、服装和娱乐)的变化为例]c. 一部分上升,一部分下降:According to the figures in the graph, we can see that__________had been increasing by 9% and 7%, respectively from the year of 1995 to1999. However,___________(the expenses on food)had been decline by30% ,during the same period. The statistics of rise and fall seem to exist in isolation but closely to one another. 第三段:There are several reasons for that phenomenon. On the hand, _____;On the other hand,_________,___________.注:横线部分为自己需填充的内容,这只是整篇文章的格式,红色横线部分视考题而定,可填充的内容经济类/发展类/旅游类/文化交流类:1. The policy of reformation and opening spreader widely in China should be taken into account firstly, when considering the reason for the steady increase of the citizen's income.2. The people of China has the spirit of working hard in order to improve their living.3. China's rapid economic development lays the base.4. In the past twenty five years, remarkable changes have taken place in China's tourism rank in the world.5. The economy of China has developed so fast in twenty years that China now becomes more and more important in the world.6. I'm confident that with the development of China the numbers of visitors and the foreign exchange earrings will certainly continues to increase in the future.7. With the rapid development of technology and the global economy ,the world is becoming international, cultural exchanges are becoming more and more frequent ,which is inevitably improving our mutual understanding and friendship with other countries.食品类:1、In order to live a healthy long life, we have to restrict our calorie intake eating the food with less fat.2、We should make our diet more nutritional and balance the calorie intake to enjoy a healthy life.3、To improve the bad situation, people should eat calcium-enriched food, such as fish,milk,beancurd and so on . 娱乐类/体育类:如看书/看电视1、We should make a balance between them to benefit themselves.2、The age in which we live now is an information one.3、People should go to the gym and take part in some sports, such as basketball, volleyball, swimming and so .All the exercise help people keep healthy.友谊类/文化交流类:1、People all over the world love and respect each other. The best way to show our love is to help others when they are in difficulties.2、Everyone should be encouraged required to try to be self-reliant.3、When one in trouble, others should help him.PS:经典句子:1、Scientists have warned that unless effective measures are taken, the problem of pollution will eventually get out of hand.2、For citizens ,they are supposed to conform to rules and regulations of the traffic.3、And the government should educate people in this respect ,which will draw people's attention of the serious problem.4、For drivers their speed should be restricted . Otherwise, they should be punished severely.5、It is time the anchorites concerned took proper steps the traffic problem.6、As long as each of us takes actions. I deeply believe the problem will be well resolved to an extend作文中可用的谚语或句子:As a saying goes:俗话说1、A good beginning is half done. 良好的开端是成功的一半。
- 1、下载文档前请自行甄别文档内容的完整性,平台不提供额外的编辑、内容补充、找答案等附加服务。
- 2、"仅部分预览"的文档,不可在线预览部分如存在完整性等问题,可反馈申请退款(可完整预览的文档不适用该条件!)。
- 3、如文档侵犯您的权益,请联系客服反馈,我们会尽快为您处理(人工客服工作时间:9:00-18:30)。
图表式作文
It is obvious in the graph/table that the rate/number/amount of Y has undergone dramatic changes. It has gone up/grown/fallen/dropped considerably in recent years (as X varies). At the point of (接近)X1, Y reaches its peak value of …(多少).
Wh at is the reason for this change? Mainly there are … (多少) reasons behind the situation reflected in the graphic/table. First of all, …(第一个原因). More importantly, …(第二个原因). Most important of all, …(第三个原因).
From the above discussions, we have enough reason to predict what will happen in the near future. The trend described in the graph/table will continue for quite a long time (if necessary measures are not taken括号里的使用于那些不太好的变化趋势).
(1)常用的开篇句型(即概述图表内容时常用的表达法)①According to the table/pie chart/line graph/bar graph, we can see/conclude that …
根据该表/图,我们可知……
②The table/graph reveals (shows/indicates/illustrates/ represents/points out)
that …
该表/图表明……
③As we can see from the table …
As can be seen from the line/bar graph …
As is shown (illustrated/indi cated) in the pie chart …
如表/图所示,……
(2) 描述增减变化常用的句型
①Compared with …… is still increased by …
②The number of … grew/rose from … to …
③An increase is shown in …; then came a sharp increase of …
④In … the number remains the same/drops to …
⑤There was a very slight (small/slow/gradual) rise/increase in 1990.
⑥There was a very steady (marked/sharp/rapid/sudden/ dramatic) drop (decrease / decline / fall / reduction) in 1998 / compared with that of last year).
(3) 对于上升趋势的描述:
a. 可以使用的动词或动词词组:
to increase to go up to rise to grow
to jump to leap to soar to shoot
to pick up
b. 可以使用的名词:
an increase a growth a jump a soar
an upward trend
(4) 对于上升到某个位置的描述:
动词+to the peak of+具体数据。
动词+reaching the peak of +具体数据。
动词+reaching + 具体数据。
to peak at +具体数据
to climb to + 具体数据
(5) 对于上升的程度的描述:
动词+by +具体数据。
(6) 对于下降趋势的描述:
a. 可以使用的动词或动词词组:
to fall to decrease to go down to slide
to collapse to decline to drop
b. 可以使用的名词:
a collapse a decrease a fall a decline
a drop
(7) 对于下降到某个位置的描述:
动词+to+具体数据。
动词+to+the bottom of+具体数据。
动词+reaching the bottom of +具体数据。
动词+reaching + 具体数据。
(8) 对于下降程度的描述:
动词+by +具体数据。
(9) 对于平稳的趋势的描述:
可以使用的动词或动词词组:
to hardly change to have little change to keep steady
to level off to remain constant to stay the same
(10) 表示程度的副词:
1. 程度较大:
considerably dramatically greatly markedly
obviously quickly rapidly sharply
significantly suddenly
2. 程度较小:
slightly gradually slowly steadily
(11) 时间的嵌入
嵌入时间时所使用的介词和介词词组:
from……to…… between…….and…… during……and……
at the star t of …… by the end of …… over ……
at the end of …… throughout ……
(12) 上升和下降趋势的组合描述
1. 先上升后下降的句型:
... increased slowly during… and … but fell sharply in …
A steady fall in …… during …… and …… followed the sharp increase in …….
2. 先下降后上升的句型:
… fell before …… began to make a recovery ……
… continue the recovery, climbing to ……
… dropped during …… but increased again in ……
… fell and then pick up during ……
… collapsed before rising to ……at the end of ……
3. 起伏波动的句型:
… fluctuated sharply all through ……
4. 波动不大的句型:
… hardly changed through the period between …and …。