图表类作文写作技巧
高考备考写作专题:图表分析作文

高考备考写作专题:图表分析作文第一篇:全球二氧化碳排放量变化趋势随着工业化和现代化的发展,全球二氧化碳排放量不断增加,给地球的生态环境带来了巨大挑战。
下面是一幅描述全球二氧化碳排放量变化趋势的图表。
从图表中可以看出,自20世纪50年代开始,全球二氧化碳排放量呈现出逐年增加的趋势。
在20世纪70年代到80年代之间,排放量增速开始明显加快,到了90年代更是达到了高峰。
然而,在近几年,尽管二氧化碳排放量仍然在增加,但增速明显放缓。
造成全球二氧化碳排放量增加的原因有很多,但主要是工业生产、能源消耗和交通运输等活动所引起的。
这些活动大量使用化石燃料,例如煤炭、石油和天然气,导致了大量的二氧化碳释放到大气中。
全球二氧化碳排放量的增加给地球的生态环境带来了诸多问题。
首先,大量的二氧化碳排放导致大气中温室气体浓度升高,进而造成气候变化,例如全球气温上升、极端天气事件增多等。
其次,二氧化碳还会导致海洋酸化,对海洋生物造成威胁。
此外,由于空气污染加剧,人们的健康也受到了威胁。
为了应对全球二氧化碳排放量增加的问题,各国政府和国际组织已经采取了一系列的措施,例如限制工业排放、推广清洁能源和绿色交通等。
但要真正解决二氧化碳排放问题,还需要全球各方共同努力,包括改变生活方式、提高环保意识等。
第二篇:中国城市人口增长随着城市化进程的不断推进,中国城市人口呈现出快速增长的趋势。
下面是一幅描述中国城市人口增长的图表。
从图表中可以看出,1990年以前,中国城市人口增长较为缓慢,但之后迅速加快。
尤其是在2000年以后,城市人口增长速度急剧提升。
目前,中国的城市化率已经超过了50%。
城市人口增长的原因有很多,主要是农村人口向城市转移和城市自然增长导致的。
一方面,农村居民为了追求更好的生活条件和就业机会,纷纷涌向城市。
另一方面,由于医疗水平的提高和生活条件的改善,城市人口的自然增长也较快。
城市人口增长给中国带来了很多挑战。
首先,城市人口的快速增加导致了城市基础设施和公共服务压力的加大。
图表类小作文必备句型
图表类小作文必备句型
段落一,数据展示与对比。
看这儿,图表上明明白白地写着呢!去年第四季度销售额嗖嗖地涨了15%,这都是因为咱们推出了新产品,还调整了营销策略。
而那竞争对手,市场份额就像泄了气的皮球,咱们的市场地位就更加明显了。
段落二,趋势分析与预测。
瞅瞅过去五年的销售数据,咱们的产品在市场上稳扎稳打,就像爬山一样一步步往上走。
照这个势头下去,未来几年咱们市场份额肯定还能涨,盈利也能跟着水涨船高。
段落三,数据解读与结论。
图表上那些数字可是个好兆头!客户对咱们产品的满意度越来越高,这都得归功于产品质量和售后服务的提升。
这么一来,客户们更信任咱们了,公司的长期发展也更有保障了。
段落四,数据背后的故事。
这些数据可不是天上掉下来的,背后都是咱们团队的辛勤付出。
从市场调研到产品研发,再到市场推广,每个环节都少不了团队成
员的智慧和努力。
这些成绩,都是大家用汗水和智慧换来的。
段落五,数据的启发与启示。
看着这些数据,我心里就有数了。
想要在竞争激烈的市场中站
稳脚跟,就得不断创新,满足客户需求。
这些数据不仅仅是数字,
更是咱们未来发展的指南针。
雅思 图表作文写作技巧范文

声明:本讲义为GARY 呕心制作,GARY 享有独家版权,禁止转发、出售本讲义或将其用于其他商业用途!Task1 图表作文写作技巧(一)一、认识图表作文20 分钟 150 单词,占写作考试总分值的三分之一,描述一个或几个图表。
线性图(line graph/chart );柱状图(bargraph/chart );饼状图(pie graph/chart );表格( table );流程图(process diagram ) Table:Fig. 1 Pie chart and line graph: sales and share prices for Coca-ColaFig.2 Preferred leisure activities of Australian childrenFig. 3 Underground Railways Systems in Six Cities二、图表作文审题要素1. 描述对象整个图表的数据都是针对描述对象的。
图表的上方标题一般会指示描述对象。
弄清描述对象非常重要,因为在行文时,需要频繁地用到它。
如:sales of Coca Cola,share price of Coca Cola,the preferred leisure activities of Australian kids aged 5-14, wages growth rate。
2. 描述单位对于有 X 轴(horizontal axis)和 Y 轴(vertical axis)的图表,描述单位一般在 Y 轴以符号的形式标明。
弄清描述单位对于数据的准确描述非常关键,把握不准的话就容易被当做跑题。
一般要弄清数字 ( number )和百分比( percentage; proportion )的区别。
另外,记住几个常用的单位缩写符号:$:dollarbn:billionm: million 或 metrekm: kilometre%: percentage / proportion 区别: per cent,000s: thousand比如,第一页的描述单位: bottle / percentage (pie chart), dollar (line chart), percentage (bar chart) 三、图表作文标准结构Part 1 开头段,介绍写作目的,需包含四个要素:图表类型主要描述动词describe,show,present,depict,indicate,representcompare / make a comparison between …描述对象背景信息(地点 + 时间)例如:The line graph gives some detailed information about the wages growth rate of some country over adecade from 1993 to 2003.The pie charts below show the percentage of men and women who smoked in Australia during a 40-yearperiod, between 1960 and 2000.Part 2 主体段:1 + N 结构1: 一句话概括总趋势或总特征( general trend or feature )套句:… have shown striking changes/differences.N: N 段 ( N≥1 )细节描述( striking trends or features )Part 3 结尾段结尾段给出结论。
雅思英语图表作文范文(必备3篇)

雅思英语图表作文范文第1篇A类雅思各类图表作文要点及范文一.曲线图解题关键1曲线图和柱状图都是动态图,解题的切入点在于描述趋势。
2在第二段的开头部分对整个曲线进行一个阶段式的总分类,使写作层次清晰,同时也方便考官阅卷。
接下来再分类描述每个阶段的specifictrend,同时导入数据作为分类的依据。
3趋势说明。
即,对曲线的连续变化进行说明,如上升、下降、波动、持平。
以时间为比较基础的应抓住“变化”:上升、下降、或是波动。
题中对两个或两个以上的变量进行描述时应在此基础上进行比较,如变量多于两个应进行分类或有侧重的比较。
4极点说明。
即对图表中最高的、最低的点单独进行说明。
不以时间为比较基础的应注意对极点的描述。
5交点说明。
即对图表当中多根曲线的交点进行对比说明。
6不要不做任何说明就机械地导入数据,这不符合雅思的考试目的。
曲线图常用词汇动词—九大运动趋势一:表示向上:increase,rise,improve,grow,ascend,mount,aggrandize,goup,climb, take off, jump,shoot up暴涨,soar,rocket, skyrocket雅思英语图表作文范文第2篇It is said that countries are becoming similar to each other because of the global spread of the same products, which are now available for purchase almost anywhere. I strongly believe that this modern development is largely detrimental to culture and traditions worldwide.A country’s history, language and ethos are all inextricably bound up in its manufactured artefacts. If the relentless advance of international brands into every corner of the world continues, these bland packages might one day completely oust the traditional objects of a nation, which would be a loss of richness and diversity in the world, as well as the sad disappearance of t he manifestations of a place’s character. What would a Japanese tea ceremony be without its specially crafted teapot, or a Fijian kava ritual without its bowl made from a certain type of tree bark?Let us not forget either that traditional products, whether these be medicines, cosmetics, toy, clothes, utensils or food, provide employment for local people. The spread of multinational products can often bring in its wake a loss of jobs, as people urn to buying the new brand,perhaps thinking it more glamorous than the one they are used to. This eventually puts old-school craftspeople out of work.Finally, tourism numbers may also be affected, as travelers become disillusioned with finding every place just the same as the one they visited previously. To see the same products in shops the world over is boring, and does not impel visitors to open their wallets in the same way that trinkets or souvenirs unique to the particular area too.Some may argue that all people are entitled to have access to the same products, but I say that local objects suit local conditions best, and that faceless uniformity worldwide is an unwelcome and dreary prospect.Heres my full answer:The line graphs show the average monthly amount that parents in Britain spent on their children’s s porting activities and the number of British children who took part in three different sports from 2008 to is clear that parents spent more money each year on their children’s participation in sports over the six-year period. In terms of the number of children taking part, football was significantly more popular than athletics and 2008, British parents spent an average of around £20 per month on their children’s sporting activities. Parents’ spending on children’s sports increased gradually over the followi ng six years, and by 2014 the average monthly amount had risen to just over £ at participation numbers, in 2008 approximately 8 million British children played football, while only 2 million children were enrolled in swimming clubs and less than 1 million practised athletics. The figures for football participation remained relatively stable over the following 6 years. By contrast, participation in swimming almost doubled, to nearly 4 million children, and there was a near fivefold increase in the number of children doing athletics.剑桥雅思6test1大作文范文,剑桥雅思6test1大作文task2高分范文+真题答案实感。
图表式作文写作攻略与突破

图表式作文写作攻略与突破1.题型分析2010年山东卷《考试说明》明确规定:要求考生根据题目的提示(包括情景、图画、图表、提纲等)和要求,用英语写一篇120-150个单词的短文。
图表作文是高考英语写作中较为常见的题型之一,也是难度较大的一种写作题型。
这类作文可综合提供题目、数据、图像、提纲,形式多样,但实际上只涉及五个方面:描述图表、指明寓意、分析原因、联系实际、给出建议,而每次考试只是从这五个方面的内容中选出三个结合在一起。
从写作类型来看,基本上属于说明文或议论文。
要求考生围绕题目将有关信息转化为文字形式,考生应该具有一定数据分析和材料归纳的能力,同时会运用一定的写作方法。
议论文通常要求考生通过分析图表中的数据,就图表中所反映的问题阐述自己的观点,并得出自己的结论(如04年北京卷及06年湖北卷);说明文要求考生通过图表所列举的变化对比及产品介绍等,对图表进行描述(如04年浙江卷)。
2.考试类型图表作文可以细分为表格,曲线图、柱形图和饼形图。
(1)表格可以表示多种事物的相互关系,所以考生要对表格中所给出的大量数字进行比较分析,从中找出其变化规律。
(2)曲线图常表示事物的变化趋势,考生应认真观察坐标系所显示的数据信息,并且密切注意交汇在坐标横轴和纵轴上的数字及单位。
(3)柱形图用来表示各种事物的变化情况及相互关系,要求考生通过宽度相等的柱形的高度或长度差别来判断事物的动态发展趋势,因此考生应密切关注坐标线上的刻度单位及图表旁边的提示说明与文字。
(4)饼形图表示各事物在总体中所占的比例及相互关系,旨在要求考生准确理解并阐述一个被分割成大小不等切片的饼形图所传达的信息。
考生应清楚掌握部分与整体,部分与部分之间的相互关系,这种关系通常是以百分比的数字形式给出的。
3.写作要领(1)考生应仔细研究题目以及提示信息,认清图表中的数字、线条、阴影等部分的变化趋势和走向,抓住其主要特点,然后根据图表所显示的中心信息确定内容层次以及主题句。
怎样写图表分析作文
怎样写图表分析作文纵观近几年高考,英语书面表达大致分为材料作文、图表作文和开放作文。
且材料作文逐渐被图表作文取代,图表分析作文就是将数据、图像所包含的信息,转化为表意的说明文字。
图表分析作文通常比较复杂,学生不仅要弄清提示,还要看懂所给的图表和数据。
由于这类试题提示内容少,信息点分散,审题时一定要领会作者的出题意图,弄清主题再动笔:1.单纯描述解释图表信息,按图表所示内容如实表达,不加评论。
2.通过叙述图表(或图画)中的内容和数字变化来分析原因,发表议论。
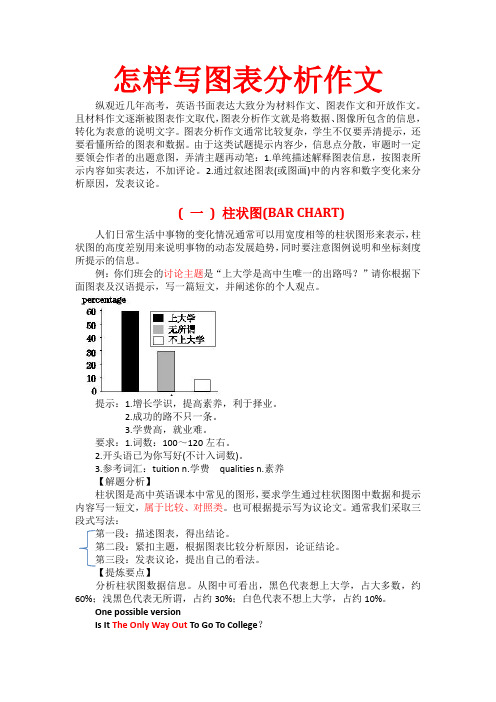
(一) 柱状图(BAR CHART)人们日常生活中事物的变化情况通常可以用宽度相等的柱状图形来表示,柱状图的高度差别用来说明事物的动态发展趋势,同时要注意图例说明和坐标刻度所提示的信息。
例:你们班会的讨论主题是“上大学是高中生唯一的出路吗?”请你根据下面图表及汉语提示,写一篇短文,并阐述你的个人观点。
提示:1.增长学识,提高素养,利于择业。
2.成功的路不只一条。
3.学费高,就业难。
要求:1.词数:100~120左右。
2.开头语已为你写好(不计入词数)。
3.参考词汇:tuition n.学费qualities n.素养【解题分析】柱状图是高中英语课本中常见的图形,要求学生通过柱状图图中数据和提示内容写一短文,属于比较、对照类。
也可根据提示写为议论文。
通常我们采取三段式写法:第一段:描述图表,得出结论。
第二段:紧扣主题,根据图表比较分析原因,论证结论。
第三段:发表议论,提出自己的看法。
【提炼要点】分析柱状图数据信息。
从图中可看出,黑色代表想上大学,占大多数,约60%;浅黑色代表无所谓,占约30%;白色代表不想上大学,占约10%。
One possible versionIs It The Only Way Out To Go To College?We had a discussion about whether it is the only way out for senior students to go to college. Views vary from person to person.The majority of us consider it very necessary to go to college. They think it can widen their knowledge and improve their qualities. Only in this way can they find better jobs after graduation. Very few students,that is about ten percent of the students,think it no use going university,because the tuition is too high for their family to afford. What's more,it's rather hard for college graduates to seek satisfactory jobs. Thirty percent of the students,however,believe “All roads lead to Rome.”Therefore it doesn't make any difference whether they go to college or not.In my opinion,we can receive a better education at college so that we can serve our motherland.【语言亮点】①词汇。
图表作文(经典范文)
一、图表作文写作常识1、图形种类及概述法:泛指一份数据图表:a data graph/chart/diagram/illustration/table饼图:pie chart直方图或柱形图:bar chart / histogram趋势曲线图:line chart / curve diagram表格图:table流程图或过程图:flow chart / sequence diagram程序图:processing/procedures diagram2、常用的描述用法The table/chart diagram/graph shows (that)According to the table/chart diagram/graphAs (is)shown in the table/chart diagram/graphAs can be seen from the table/chart/diagram/graph/figures,figures/statistics shows (that)……It can be seen from the figures/statisticsWe can see from the figures/statisticsIt is clear from the figures/statisticsIt is apparent from the figures/statisticstable/chart/diagram/graph figures (that)……table/chart/diagram/graph shows/describes/illustrates how……3、图表中的数据(Data)具体表达法数据(Data)在某一个时间段固定不变:fixed in time在一系列的时间段中转变:changes over time持续变化的data在不同情况下:增加:increase / raise / rise / go up ……减少:decrease / grow down / drop / fall ……波动:fluctuate / rebound / undulate / wave ……稳定:remain stable / stabilize / level off ……宫东风老师考研英语图表作文预测及练习:第1篇Study the following pie carefully and rite an essay in which you should1)describe the pie,2)interpret its meaning, and 3)suggest counter-measures.You should write about 160—200 words neatly ANSWER SHEET 2. (20 points)[参考范文](291 words) 爱滋病的感染途径As is obviously betrayed in the pie above, the main contagion (接触传染) channels among China’s HIV positive cases are drug injection (43.9%), commercial blood donors (24.1%), and sexual contact (19.8%). The statistics have indicated the reality that we are facing and have profound implication for us in terms of AIDS control and prevention.The implied meaning of the pie above which demonstrates how victims were usually infected in the year of 2004 is far-reaching. In the first place, the contagion channel of drug injection should be the top on our agenda. The channel of infection ranks first in the pie above currently in our society the availability of drugs are getting easier. If enough attention is not attached to the control of drug injection, China’s HIV positive cases will rocket to an alarming figure, which is bound to threaten the stability of our society.What’s more, the contagion channels — commercial blood donors and sexual contact — should not be ignored by us. The two channels of infection rank second and third respectively. In fact, blood and sex are part of people’s life so that it is more difficult for us to always watch out. However, constant watching-out has become a must due to the cruel reality which is revealed in the pie above. Otherwise, everybody in our society will be in danger of being infected with HIV positive.Counter measures must be taken in order contain the current situation. In the first place, we must offer medical treatment to those who are already infected. In the second place, we must popularize the knowledge of AIDS in our society, especially among young people. Most importantly, the idea of prevention should be the uppermost in our work and life.宫东风老师考研英语图表作文预测及练习:第2篇Study the following chart carefully and write an essay in which you should1)describe the chart,2)deduce the purpose of the painter of the chart.You should write about 160—200 words neatly ANSWER SHEET 2. (20 points)[参考范文]2004年不同疾病的死亡率(248 words)As is apparently betrayed in the chart above, among the leading causes of death among 15 — 59-year-olds worldwide in the year of 2004 are HIV/AIDS, heart failure, tuberculosis and so forth, which cover both external and internal factors. What the chart reveals mirrors a social reality, which is in effect thought-provoking.The aim of the painter of the chart is to make us have a clear understanding of the leading causes of death so as to improve our life span and the quality of life. In the first place, some diseases such as HIV/AIDS and cancer arestill No. 1 enemies since we still have no better way to deal with them. Consequently, we must work hard in this aspect and try our best to find the cure as early as possible. In the second place, psychological stress on us should not be neglected in terms of leading causes of death. Causes such as heart failure and suicide are closely related with psychological stress.Therefore, to protect our life, we must first of all attach importance to our state of mind. Last but not least important, some leading causes such as respiratory illness is associated with our environment pollution. Therefore, the improvement of our environment can contribute to the protection of our life. In sum, the chart above reminds us that the leading causes of death result from diseases, psychological stress, and environmental pollution. In order to have a better life, something must be done in the relevant aspects mentioned above.宫东风老师考研英语图表作文预测及练习:第3篇Study the following chart carefully and write an essay in which you should1)describe the chart,2)account for the status revealed, and3)make a relevant prediction.You should write about 160—200 words neatly ANSWER SHEET 2. (20 points)The number of Scientific breakthroughs over the past years in P.R. China (Estimated)[参考范文](228 words) 从2001-2004年4年当中中国在科学成就上突破表As is apparently betrayed in the chart above, the number of scientific breakthroughs over the past years in P.R. China has been climbing and rocketed to 120 cases in the year of 2004, which is a shocking news to people both at home and abroad. People may wonder what is behind the great achievement.The foremost reasons for the tremendous feat which is revealed in the chart above can be illustrated as follows. To begin with, idea that science and technology are also productivity has contributed to the increase of scientific breakthrough. Over the years, more and more people realize that we are living in an era of knowledge explosion. If we want to survive and develop in the current world, we must keep pace with the development of science and technology. Thus, scientific breakthrough crop up by each passing day. What’s more, the Opening-up and Reform has also brought about the increase of scientific breakthroughs. The Opening-up and Reform has improved the d evelopment of China’s economy, which has laid a solid foundation for the increase of scientific breakthroughs. In sum, our new idea and Opening-up and Reform are the preconditions of the tremendous increase of scientific breakthroughs.As our country develops at a high speed, more scientific breakthroughs will come into our life since we have more solid economic foundation, advanced equipment and facilities, and super talents.宫东风老师考研英语图表作文预测及练习:第4篇Study the following chart carefully and write an essay to1) describe the chart,2) state your attitude toward the event, and3) suggest counter-measures.You should write about 160—200 words neatly ANSWER SHEET 2. (20 points)[参考范文](172 words) 世界恐怖案件调查表As is apparently betrayed in the chart above, the number of terror attacks over the past four years has been climbing and rocketed to 204 cases in the year of 2004. This is a shocking figure to everyone and every nation in the world, which has aroused the deep concern of the international community.In my view, terrorist offences against civilians cannot be justified in any way. Action of the kind is no doubt criminal regardless of their motivation, be it political or personal. The terror attack on children and women like the case in Russia not long ago is never forgivable. In fact, terror attack is a threat to the world peace and stability.Counter-measures should be taken to fight against terrorism. To begin with, there is a greater and more urgent need for the international community to collaborate now. What’s more, the legislative framework of international co-operation against terrorism should be perfected. Most importantly, the world community should carefully explore terrorism’s breading grounds while probing effective means to counter it.宫东风老师考研英语图表作文预测及练习:第5篇Study the following drawing carefully and write an essay to1)describe the picture2)deduce the reasons for the predictions revealed, and3)put forward your suggestions.You should write about 160—200 words neatly ANSWER SHEET 2. (20 points)[参考范文](256 words) 预测中国人口寿命As is a pparently betrayed in the drawing above, the average life spans of the world population and China’s population will reach fifty years and one hundred years respectively by the year of 2300. And by then the number of people above the age of sixty will account for thirty-eight percent of the total world population. This is a great change in human history, which has made us think deeply.The foremost reasons for the predictions which are indicated in the drawing above can be illustrated as follows. To begin with, the rapid development of the world economy has contributed to the predictions. Over these years, the world economy is developing at a surprising speed, which has supplied people all over the world with adequate daily necessities. What’s more, the de velopment of medical science has brought about the predictions. Over the past years, a number of medical breakthroughs have been made in the field of medical science, which has greatly protected people and improved the quality of people’s life. With the fu rther growth of the world economy and medical science, the UN predictions will be more persuasive.By the way, here are suggestions of mine for the predictions revealed in the drawing above. The international community including China must now make preparations for the coming of the day. Much knowledge concerning senior citizens should be popularized. More public facilities for senior citizens should be set up. More professionals on senior citizens should be strictly trained. Only in this way can we live in a peaceful and harmonious environment. 宫东风老师考研英语图表作文预测及练习:第6篇Study the following chart carefully and write an essay in which you should1)describe the chart,2)deduce the purpose of the painter of the chart, and3)suggest counter-measures.You should write about 160—200 words neatly ANSWER SHEET 2. (20 points)[参考范文](280 words) 关于南京大屠杀知道情况的问卷调查As is apparently betrayed in the chart above, the number of people who know the date of the Nanjing Massacre (大屠杀) is only one out of fifteen, which is really surprising to every Chinese. The social phenomenon is not a trivial matter and should arouse the great concern of our society.The aim of the painter of the chart is to remind us that we are forgetting what we should always keep in mind as a Chinese. Everyone in the world has his/her motherland. As a Chinese, we should have a good understanding of the history of our motherland. Without a good understanding of the history, we can not be a qualified Chinese. In the history of our nation, many significant events have ever taken place. The Nanjing Massacre is just one of them, which have left us an unforgettable memory. To forget events of the kind means that we betray our nation, that we are losing our national spirit, that we lack patriotism (爱国精神), and that we are destroying our future. The phenomenon which is revealed in the chart above is pervasive and must be curbed. Otherwise, it will impair the development of our motherland.Counter-measures must be taken to rectify the trend of the kind revealed in the chart above. Mostly importantly, laws and regulations must be established to popularize the knowledge of the history of our motherland. Besides, activities at national level should be organized to mark the significant events in our history. In sum, we must attach more importance to our history in order to make our country become a strong and powerful nation in the world.宫东风老师考研英语图表作文预测及练习:第7篇Study the following chart carefully and write an essay to1)depict the chart, and2)deduce the reasons behind the fact.You should write about 160—200 words neatly on NSWER SHEET 2. (20 points)[参考范文](235 words) 考研人数从2003-2005年持续上升As is vividly betrayed in the chart above, the number of MS/MA candidates has been climbing over the past years and rocketed to 1.3 million in the year of 2005. People at different walks of life may wonder what is behind the figure.The foremost reasons for the great increase of MA/MS candidates over the past years can be illustrated as follows. In the first place, the idea that knowledge is power has contributed to the enormous increase of MA/MS candidates. At present, we are living in an era of knowledge explosion. If we want to survive in the current society, we must have good command of knowledge. To be exact, knowledge learning has become a life-long work.Therefore, more and more people are content with their four-year college education and apply for MA/MSdegree. In the second place, the current unsatisfactory job-hunting has resulted in the great increase of MS/MA candidates over the past years. At the moment, the supply of the college graduates overtakes the demand for the college graduates.As a result, many college graduates can not find jobs that they really enjoy and want. Some of their jobs are even irrelevant to their majors. Therefore, they would like to conduct further study instead of doing the work that they dislike. As a consequence, more and more people apply for MA/MS degree, which has led to the great increase of MA/MS candidates.宫东风老师考研英语图表作文预测及练习:第8篇Study the following chart carefully and write an essay to1)describe the chart,2)deduce the possible reasons of the increase of the gold medals.You should write about 160—200 words neatly on ANSWER SHEET 2. (20 points)[参考范文]中国在奥运会上金牌逐渐上升(197 words)As is vividly portrayed in the chart above, the number of gold medals which are snatched by P.R. China has been climbing and rocketed to 32 at the 2004 Athens Olympic Games. This is a great achievement in Chinese sports. People both at home and abroad may wonder what has brought about the great success.The foremost reasons for the great achievement which is revealed in the chart above can be illustrated as follows. To begin with, the Opening-up and Reform has contributed to the growth of Chinese sports. The Opening-up and Reform since 1978 has improved the development of economy in China, which has laid a solid foundation for the development of sports in China.Thus, without the Opening-up and Reform, the 32 gold medals would be a pie in the sky. What’s more, the international exchanges have brought about the growth of Chinese sports. On one hand, we sent Yao Ming to NBA and Liu Xiang to participate in international events of various kinds. On the other hand, we have invited foreign professionals to come to China and coach our national teams.Therefore, without the international exchanges, the 32 gold medals would be an empty talk.宫东风老师考研英语图表作文预测及练习:第9篇Study the following chart carefully and write an essay in which you should1)describe the chart,2)account for the fact revealed in the chart.You should write about 160-200 words neatly on ANSWER SHEET 2. (20 points)[参考范文](238 words)As is vividly betrayed in the chart above, the number of scholars returning from the overseas has been climbing over the past years and rocketed to over 50 thousand in the year of 2004. People may wonder what is behind the amazing figure.The foremost reasons for the tremendous increase which is clearly revealed in the chart above can be illustrated as follows. To begin with, a set of preferential policies has contributed to the increase of the number. To attract the students studying overseas to return, our government has set up a suite of preferential policies in terms of salaries, residing place, housing, choice of jobs, and children’s education. Without the preferential policies, the increase of the number is out of the question.What’s more, the rapid development of our motherland has led to the in crease of the number of scholars returning from overseas. Since 1978, China has carried out Opening-up and Reform, which has greatly improved the growth of China’s economy. The robust economy has laid a solid foundation for the rapid development of scientific field, which makes P.R.China a most inviting country to both Chinese at home and abroad and foreigners. Therefore, without the great leap of our motherland over the past years, the increase of the scholars returning from overseas would be impossible.In one word, our preferential policy and rapid development of our motherland are the foundation of the increase revealed in the chart above.图表作文10:1997年考研英语真题作文Directions:A. Study the following set of pictures carefully and write an essay in no less than 120 words.B. Your essay must be written clearly on the ANSWER SHEET.C. Your essay should cover all the information provided and meet the requirements below:OUTLINE:1. Interpret the following picture.2. Predict the tendency of tobacco consumption and give your reasons.【参考范文】The problem of smoking has received more and more concern from all over the world. As is indicated by the pictures, smokers for nearly 20% of the world population. And tobacco has caused a loss of 200 billion U.S. dollars and claimed 3 million lives annually.However, it is billion that the world tobacco production witnessed a decrease from 14.364 billion pounds in 1994 to 14.2 in 1995. according to this change. I confidently believe that there will be less and less tobacco consumption in the future, generally for two reasons. On the one hand, being aware of the harm of smoking, more and more people join in the fight against it. They either try their best to give up smoking or advise others not to smoke any longer.On the other hand, many governments have attached more attention to this social hazard and take various measures to put an end to it. Therefore, I have every reason to believe that the fight against smoking will be won by us human beings at last.考研英语二图表作文预测:全国出境游Topic 3: The boom of overseas traveling industryFrom the bar chart given above, we can observe that the number of people traveling abroad experienced some changes during the past several years. From 1999 to 2000, the number of Chinese people traveling abroad increased rapidly from 7.5 million to 10 million, and then to 12.1 million in 2001.The bar chart reveals that people in mounting numbers are going to travel abroad. What exactly contribute to this phenomenon? Reasons can be listed as follows: for one thing, the authorities have issued some preferential policies to promote the development of the overseas tourism industry, which encourages a sudden emergence of travel agencies that can provide customers with convenient overseas tourism services. Additionally, with the improvement of financial status and purchasing power, a considerable number of Chinese people can afford the once-deemed-expensive traveling expenses. Last but not least, as there exists huge difference in cultures, customs and landscapes between China and overseas countries, quite a few people hold that overseas traveling is not only a perfect way to relax oneself, but also enrich their knowledge and expand their horizons.By observing the past trends, we may forecast that the growth tendency will continue. However,it is also a highly variable industry which is vulnerable to seasons and climates,international political situation,fluctuations in exchange.考研英语二图表作文预测:电子商务成交额Global E-commerce turnoverFrom the curve chart given above, we can observe that the turnover of global E-commerce experienced some change during the past several years. From 1997 to 2005, it rose dramatically from 20 billion to 900 billion.The curve chart reveals that the global E-commerce industry enjoys an explosive growth. Quite a few reasons can be listed to account for this phenomenon, and the followings might be the most critical ones: for one thing, the authorities of different countries have issued some preferential policies to protect and encourage the development of E-commerce, thus quite a few online-transaction websites emerge overnight. Moreover, the one-click-payment consumption mode has been widely accepted by the public thanks to the widespread availability of the Internet. Last but not least, people’s decision to purchase on-line can also be put down to the power of so-called “group-dynamics”: when our friends are shopping at net work, we will be influenced by them and imitate their behaviors unconsciously.The rapid development of E-commerce signals that new business models contribute largely to the sustainable development of the global economy. However, when enjoying the fruits offered by modern technology, we should also keep an eye on the underlying threat of it. In a world features open boundary, deception and fraud sometime abound. (209 words )考研英语二图表作文预测:职业选择Different job inclination between boys and girlsFrom the bar chart given above, we can find that it reflects the statistics of profession inclination between girls and boys. Most obviously, 40% of boys intend to be a manager, with only 15% of girls choosing this job. When it comes to the profession of teacher, we can observe that 45% of girls prefer to take this job, while the proportion of boys only account for 5%, 40% lower than that of girls.The bar chart informs us of the phenomenon that there exists some difference in profession inclination between boys and girls. What exactly contribute to this phenomenon ? reasons can be listed as follow: for one thing, quite a few boys regard being a manager as a symbol of success. As this profession stands for promising futures, fat pay and competence. Moreover, boys’ de cision to be a manager can also be attributed to the power of so-called “group dynamics”: when members of their social network prefer to be a manager after graduation, they are easily influenced and imitate others’ behavior unconsciously or consciously. Wh en it comes to girls, the are more inclined to be a teacher. As this profession features stability and respect. Take social and biological factors into account, we know that it is reasonable for girl to choose teacher as their ideal profession goals.Both girls and boys have rights to choose their profession. However, one thing we should bear in mind is that there exists no better or worse, superior or inferior jobs, but suitable and satisfactory ones. (254words)考研英语二作文范文:中国职业的变化The changes of Chinese professionsFrom the pie chart given above, we can observe that the professions structure of Chinese people experienced some changes during the past several years. From 1980 to 1999, the percentage of agricultural professions decreased by 30% from 68% to 38%. During the same period, however, service sectors increased rapidly from 5% to 22%. When it comes to the manufacturing professions, its percentage rose markedly from 27% in 1980 to 40% in 1999.The pie chart reveals the phenomenon that there exists some difference in the development tendency among different professions in China. What exactly contribute to this phenomenon ? reasons can be listed as follows: for one thing, with the rapid process of urbanization, people in mounting numbers, especially youngster, have left their village homes ,moved into big cities and thus been out of agricultural industries. Moreover, quite a few people, especially college graduates hold that it is comparatively easy for them to make more money in the service industry. When it comes to the manufacturing industry, its transformation might be attributed to the adjustment of industrial structure: the authorities have issued some preferential policies to promote the rapid extension of manufacturing industry, thus, more workforces are required.By observing the change over the past several years, we may forecast that the proportion of professions of service and manufacture will continue to rise. However, a high value should be placed on the development of agricultural industry by the public and the authorities. Otherwise, with the number of people who are engaged in agriculture diminishing, we will one day have nothing to eat! (262words)考研英语二作文范文:快餐和坐下来餐厅发展趋势The development tendency of fast food and sit down restaurantFrom the curve chart given above, we can observe that the number meals of fast food and sitdown restaurant experienced some changes during the past several years. The number of meals of fast food increased slowly from 20 in 1970 to nearly 30 in 1980. From 1980 to 2000, it ascended rapidly from 30 to approximately 90. On the contrary, when observing the statistics of sitdown restaurant meals, we can find that it increased slowly from 20 in 1970 to roughly 50 in 2000.The curve chart informs us of the phenomenon that there exists some difference in the development tendency between fast food and sitdown restaurants. What exactly contribute to this phenomenon? Reasons can be listed as follows: for one thing, with the pace of modern life quickening, people barely have much time to waste in lining up for restaurant meals, on thecontrary, fast food meals can do help busy people save a great deal of time. Additionally, the authorities have issued some preferential policies to protect and encourage the rapid extension of fast food industry , thus the public can buy fast food at shops scattering around the city. On the contrary , people in diminishing numbers are willing to eat at sitdown restaurant. They think that eating at restaurant is always time-consuming and inconvenient. Besides, food at restaurant is comparatively expensive than fast food.by observing the trend of the past, we may forecast that the number of fast food meals will continue to rise in the years to come. However, we should also take the detrimental impact of fast food into consideration. Do remember that fast food is one of the main causing factors of diseases such as heart attack, obesity and diabetes.英语二。
2023年英语四级图表作文的类型及参考范文
您目前旳位置: 首页 > 英语四级 > 英语四级作文 > 英语四级作文综合辅导 > 正文英语四级图表作文旳类型及参照范文图表作文也是四(六)级考试中常见, 并且被认为是一种较难旳作文形式。
图表作文就是把非文字信息(一般为多种图表表达旳数字信息等)转换成文字信息旳一种作文。
它规定我们用文字来描述非文字性旳图表或对图表显示旳关系作解释阐明。
下面我们先来看一看图表作文旳类型。
第一节图表作文旳类型图表作文可分为两大类: 表作文和图作文。
表作文表格(Table)可以使大量数据系统化, 便于阅读、比较。
表格常由标题(Title)、表头(Boxhead)(表格旳第一行)、侧目(Stub)(表格左边旳第一列)和主体(Body)部分(表格旳其他部分)等部分构成。
如下表:用表格体现旳信息详细精确, 并且表格中旳各项均按一定规律排列。
阅读表格时要注意找出表格中各个项目旳互相关系, 表格中各个项目旳变化规律。
例如, 上面旳表格中旳数字阐明, 和1978年相比, 1983年大学入学旳人数在增长, 而小学旳入学人数在减少。
弄清晰这些变化规律也就读懂了表格旳内容。
图作文图作文又可分为三种: 圆形图作文、曲线图作文和条状图作文。
(1) 圆形图作文圆形图(Pie chart)也称为饼状图或圆面分割图。
圆形图由于比较形象和直观, 各部分空间大小差异轻易辨别, 因此常用来表达总量和各分量之间旳比例关系。
整个圆表达总量, 楔形块表达分量。
有时圆形图尚有数值表, 两者结合可把各分量表达得更精确、清晰。
例如:Thi.i..pi.char.o.th.averag.weekl.expenditur.o..famil.i.Grea.Britain.A.ca.b.se.fr o.th.chart.th.mai.expenditur.o.a.averag.Britis.famil.i.spen.o.food.whic.account. fo.25.o.it.tota.expenditure.Th.nex.tw.significan.expendin.item.ar.transpor.an.ho using.whic.ar.15.an.12.respectively.I.w.tak.int.accoun.clothin.an.footwear.whic. make.u.10%.th.fou.essential.o.life.tha.is.food.transport.housing.an.clothin.an.f ootwear.amoun.t.62.o.th.tota.expenditure.(2) 曲线图作文曲线图(Line graph)也称为线性图或坐标图。
图表作文写作
图表式作文写作技巧指引一、图表类型二、要点分析A. 表格图1横向比较: 介绍横向各个数据的区别,变化和趋势2纵向比较:介绍横向各个数据的区别,变化和趋势3无需将每一个数据分别说明,突出强调数据最大值和最小值,对比时要总结出数据对比最悬殊的和最小的说明:考察例举数字的能力和方法。
注意怎样通过举一些有代表性的数据来有效地说明问题。
B. 曲线图1极点说明: 对图表当中最高的,最低的点要单独进行说明2趋势说明: 对图表当中曲线的连续变化进行说明,如上升,下降,波动,持平3交点说明: 对图表当中多根曲线的交点进行对比说明说明:关键是把握好曲线的走向和趋势,学会general classification,即在第二段的开头部分对整个曲线进行一个阶段式的总分类,使写作层次清晰。
接下来在分类描述每个阶段的specific trend,同时导入数据作为你分类的依据。
注意不要不做任何说明就机械性的导入数据!可以使用一些比较native的单词和短语来描述trend。
C. 饼状图1介绍各扇面及总体的关系2各个扇面之间的比较,同类扇面在不同时间,不同地点的比较3重点突出特点最明显的扇面:最大的,最小的,互相成倍的D. 柱状图1.比较: similarity2.对比: difference)3.横向总结所有柱状图表的共性特征 & 分别描写各个柱子的个性特征E. 流程图1.首先说明:做什么工作的过程,目的是什么2.准备工作3.按时间/过程先后描述4.结果5.简单总结(可有可无)说明:注意流程图里的“因果关系”或每一流程的“承前启后”关系;表达每一流程的主体内容,阐明这种关系;揭示其内在联系或规律;最后,给予简要归纳和总结。
F. 实物/器具工作过程1.实物的名称,功能2.基本结构3.工作过程4.简单总结G. 综合图1不求甚解,不拘泥于细节2分门别类,分段落详细介绍各个图表3不画蛇添足,主观臆断或猜测图表之间的关系三、框架结构1.开头:该图阐述的是______的______.共有以下几个部分组成。
主题2:图画、图表类作文写作指南
主题2:图画、图表类作文写作指南安徽张岚Ø命题导读图画、图表类作文通常以图画、表格或图形的形式呈现,体裁多为说明文或议论文。
此类题型要求考生根据图画和图表提供的信息、数据和文字内容进行描述、分析与讨论,得出令人信服的结论,或对某一结论进行评述。
图画、图表类作文常见的命题形式有图画、表格、条形图、饼状图、线形图。
图画、图表中的信息和数据往往较多,写作时一般不能把各种信息和数据都列举出来。
因此,读懂图画和图表是关键,考生要认真分析图画和图表的信息和数据。
考生平常要多做练习,熟悉这类作文的写法,熟记常用词汇和句型。
Ø写作导析在平时的训练或考试中,图画、图表类作文出现的概率相对较小,所以考生不容易把握其写作技巧。
图画、图表类作文不像提纲作文一样会给出写作要点,考生需要根据图画和图表内容来寻找信息,确定文章的写作思路。
尽管图表作文与图画作文有很大的不同,但写作思路基本相同,可以归纳为以下三个方面:1.简要描述图画或图表的直观内容写好图画、图表类作文的第一步是解读图画内容或分析图表中的数据变化所反映出来的问题或趋势,把直观看到的图画或图表的内容简单地描述出来,简要叙述图画的内容或图表所揭示的信息。
这一部分简要概述即可,不需要展开。
2.分析图画或数据并阐述原因分析图画或数据变化的原因,并阐明理由,注意应使内容要点条理化、有序化。
3.提出解决问题的建议或揭示图画的寓意,得出结论和提纲作文一样,图画、图表类作文的最后也要总结全文的观点,根据图画或图表的内容给出相应的评价或者建议,这一点类似于社会问题型作文的结尾。
17疯狂英语(新策略)Ø素材导背一、高频词汇1.上升:rise、increase、go up2.下降:fall、drop、decrease、decline、reduce、lessen3.平稳:stable、steady、remain/maintain/keep/be the same as/similar to4.占:occupy、take up、account for5.而:while、however、whereas、on the other hand6.相比:by contract、on the contrary、likewise、be compared with7.总结:to sum up、in short、in conclusion二、高频句式(一)说明图中的内容1.The table/chart/diagram/graph shows that...这个表格/图表/示意图/曲线图表明……2.According to the table/chart/diagram/graph...根据表格/图表/示意图/曲线图……3.As is shown in the table/chart/diagram/graph...如表格/图表/示意图/曲线图所示……4.As can be seen from the table/chart/diagram/graph/figures...从表格/图表/示意图/曲线图/数字中可以看出……5.It can be seen that...可以看出……6.It is clear from the figures/statistics that...从数字/统计数据可以清楚地看出……7.It is apparent from the figures/statistics/table/chart/diagram/graph that...从这些数字/统计数据/表格/图表/示意图/曲线图中可以明显看出……8.In recent years,there has been rapid growth/development in the area of...近年来,……区域有了很大的发展。
- 1、下载文档前请自行甄别文档内容的完整性,平台不提供额外的编辑、内容补充、找答案等附加服务。
- 2、"仅部分预览"的文档,不可在线预览部分如存在完整性等问题,可反馈申请退款(可完整预览的文档不适用该条件!)。
- 3、如文档侵犯您的权益,请联系客服反馈,我们会尽快为您处理(人工客服工作时间:9:00-18:30)。
41
专 题 攻 略 zxstdc
( 3) In my opinion... On the one hand... On the other hand... ( 我 认 为 ……一方面……另一方面……)
例 2 请根据以下图表所提供 的数据, 描述同学们去上学的方式, 并 说 明 你 自 己 的 情 况 。( 词 数 在 120 左右)
来写。切忌对图表不作交代就直接 谈论主题。
1. 表格类作文的模式 表格类作文一般可以分为三 段: 第一段对表格中的数据进行描 述, 只要抓住变化规律即可, 切忌一 一列举数据; 第二段说明变化的原 因 ; 第 三 段 得 出 结 论 。即 : ( 1) Studying the table carefully, we can see...( 仔 细 研 读 表 格 , 我 们 可以看出……) ( 2) In my opinion, the reasons why...are as follows. Firstly...Secondly... Thirdly...( 在我看来, 为什么 …… 的 原 因在于以下几点: 第一……第二…… 第三……) ( 3) To sum up . . . ( 总 而 言 之 ……) 例 1 根据下列表格提供的数 据, 简单描述这几年人们的饮食变 化 , 并 解 释 原 因 。( 词 数 在 100 左 右 ) Changes in People’s Diet
二 、图 表 类 作 文 的 模 式 图表类作文中的图表主要有以 下 形 式 : 柱 形 图 类 ( chart) 、圆 饼 图 类 ( pie chart) 、曲 线 图 类 ( line chart) 、
40
zxstdc 专 题 攻 略
表 格 类 ( table) 。写 文 章 时 , 首 先 要 对 图表加以描述, 而后引出主题加以 讨论, 最后得出结论, 也就是按照描 述图表—解释原因—下结论的步骤
In my opinion, the reasons why people’s diet has been changed are as follows. Firstly, people’s living quality has been improved. They become richer and richer. Secondly, people become more careful and reasonable in arranging their diet. Thirdly, people pay more attention to their health.
Means of Travel to School
walk car 12% 10% bus 18%
bike 60%
car bike bus walk
按照以上模式, 可拟写如下:
From the chart we can see clearly that most students go to school by bike.Байду номын сангаасAmong all the students going to school, walkers make up 12% while the number of the students who take a bus is 18% . Fewer students go to school by car.
To sum up, with the development of economy, people’s life has been greatly changed—it is also the case with people’s diet.
2. 圆饼图类作文的模式 这类文章往往也可以分为三 段: 首段描述数字, 第二段解释原 因 , 最 后 一 段 说 明 自 己 的 观 点 。这 个 模式同样适用于柱形图类和曲线图 类作文。 ( 1) From the chart we can see clearly that...among...make up...while... is...( 从 图 表 中 我 们 可 以 清 楚 地 看 到 …… 在 …… 中 …… 组 成 了 …… 而 ……是……) ( 2) It is no wonder that...( …… 不足为奇)
fall ( 减 少 ) increased by ( 增 长 了 ) increased to ( 增 长 到 ) the number sharply goes up to
( 数字急剧上升至) significant ( 重 大 的 ) , steady ( 平
稳 的 ) , gradual ( 逐 渐 的 ) , slow( 慢 慢 的 ) , stable( 稳 定 的 ) , rapid ( 快 速 的 ) ……
一 、图 表 类 作 文 常 用 的 单 词 、 短语和句型
1. 表 示 数 据 变 化 的 单 词 或 短
语 in the case of ( 在……的情况下) in terms of ( 在 …… 方 面 ) increase / raise / rise / go up
( 增加) decrease / grow down / drop /
Year Food
Grain
2003 47%
2004 46%
2005 45%
2006 45%
Meat
21% 23% 24% 25%
Vegetables 23% 24% 26% 26%
Others 9% 7% 5% 4% 按照以上模式, 可拟写如下:
Studying the table carefully, we can see that in the past four years, there have been great changes in people’s diet. Grain is on the decline from 47% to 45% while meat consump- tion is increased. According to the table, vegetables are on the rise.
It can be concluded from the graph that... ( 从 图 表 中 可 以 得 出 ……)
The table shows the changes in the number of...over the period from...to... ( 该 表 格 描 述 了 在 …… 期 间……数量的变化)
It is no wonder that so many students go to school by bike. They can take advantage of its convenience and save time in such a crowded city.
In my own practice, I prefer to go to school by bike. On the one hand, it is convenient. On the other hand, I can do exercise while riding to school. What’s more, it is environmentally friendly to ride to school. To keep fit and healthy, I take great delight in going to school by bike.
!!!!!!!!!!!!!!!!!!!!!!!!!!!!!!!!!!!!!!!!!!!!!!!!!!!!!!!!!!!"
会说话的鹦鹉 乐透
小偷夜里潜入一户人家, 漆黑中 听 到 叫 声 : “我 看 到 你 了 , 圣 人 也 看 到 你了!我看到你了, 圣人也看到你了!”
小偷吓了一跳, 稍后却发现是一 只 鹦 鹉 在 叫 , 于 是 很 生 气 地 去 抓 它 。快 要抓住的时候, 小偷忽然发现鹦鹉正 站在一只凶猛的虎头犬头上。只听鹦 鹉 命 令 道 : “圣 人, 上 ! ”
2. 表示从图表得知的信息的句 型
The table / chart / graph shows that...( 这 个 图 表 告 诉 我 们 …… )
According to the table / chart / graph, we can see that...( 根 据 图 表 , 我们可以看出……)
( 豌 豆 供 稿)
!!!!!!!!!!!!!!!!!!!!!!!!!!!!!!!!!"
!!!!!!!!!!!!!!!!!!!!!!!!!!!!!!!!!"
!!!!!!!!!!!!!!!!!!!!!!!!!!!!!!!!!!!!!!!!!!!!!!!!!!!!!!!!!!!"
42
专 题 攻 略 zxstdc
图
表
类
作 文
写 作
技
巧
杭州第十四中学 孔慧敏
英 文 写 作 是 高 考 的 重 中 之 重 。同 学们平时训练较多的是如何写议论 文, 其他体裁作文的应对能力则相对 薄 弱 。其 实 , 图 表 类 作 文 有 其 较 为 固 定的表达方式和使用频率较高的词 汇, 掌握了这些, 同学们就可以比较 顺利地应对这一体裁的写作了。