人脸识别英文
人脸识别英文专业词汇教学提纲

人脸识别英文专业词汇gallery set参考图像集Probe set=test set测试图像集face renderingFacial Landmark Detection人脸特征点检测3D Morphable Model 3D形变模型AAM (Active Appearance Model)主动外观模型Aging modeling老化建模Aging simulation老化模拟Analysis by synthesis 综合分析Aperture stop孔径光标栏Appearance Feature表观特征Baseline基准系统Benchmarking 确定基准Bidirectional relighting 双向重光照Camera calibration摄像机标定(校正)Cascade of classifiers 级联分类器face detection 人脸检测Facial expression面部表情Depth of field 景深Edgelet 小边特征Eigen light-fields本征光场Eigenface特征脸Exposure time曝光时间Expression editing表情编辑Expression mapping表情映射Partial Expression Ratio Image局部表情比率图(,PERI) extrapersonal variations类间变化Eye localization,眼睛定位face image acquisition 人脸图像获取Face aging人脸老化Face alignment人脸对齐Face categorization人脸分类Frontal faces 正面人脸Face Identification人脸识别Face recognition vendor test人脸识别供应商测试Face tracking人脸跟踪Facial action coding system面部动作编码系统Facial aging面部老化Facial animation parameters脸部动画参数Facial expression analysis人脸表情分析Facial landmark面部特征点Facial Definition Parameters人脸定义参数Field of view视场Focal length焦距Geometric warping几何扭曲Street view街景Head pose estimation头部姿态估计Harmonic reflectances谐波反射Horizontal scaling水平伸缩Identification rate识别率Illumination cone光照锥Inverse rendering逆向绘制技术Iterative closest point迭代最近点Lambertian model朗伯模型Light-field光场Local binary patterns局部二值模式Mechanical vibration机械振动Multi-view videos多视点视频Band selection波段选择Capture systems获取系统Frontal lighting正面光照Open-set identification开集识别Operating point操作点Person detection行人检测Person tracking行人跟踪Photometric stereo光度立体技术Pixellation像素化Pose correction姿态校正Privacy concern隐私关注Privacy policies隐私策略Profile extraction轮廓提取Rigid transformation刚体变换Sequential importance sampling序贯重要性抽样Skin reflectance model,皮肤反射模型Specular reflectance镜面反射Stereo baseline 立体基线Super-resolution超分辨率Facial side-view面部侧视图Texture mapping纹理映射Texture pattern纹理模式Rama Chellappa读博计划:1.完成先前关于指纹细节点统计建模的相关工作。
人脸识别文献翻译(中英双文)
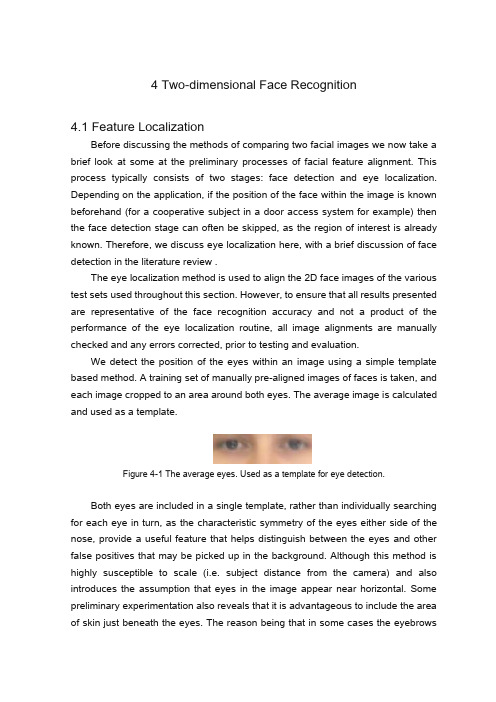
4 Two-dimensional Face Recognition4.1 Feature LocalizationBefore discussing the methods of comparing two facial images we now take a brief look at some at the preliminary processes of facial feature alignment. This process typically consists of two stages: face detection and eye localization. Depending on the application, if the position of the face within the image is known beforehand (for a cooperative subject in a door access system for example) then the face detection stage can often be skipped, as the region of interest is already known. Therefore, we discuss eye localization here, with a brief discussion of face detection in the literature review .The eye localization method is used to align the 2D face images of the various test sets used throughout this section. However, to ensure that all results presented are representative of the face recognition accuracy and not a product of the performance of the eye localization routine, all image alignments are manually checked and any errors corrected, prior to testing and evaluation.We detect the position of the eyes within an image using a simple template based method. A training set of manually pre-aligned images of faces is taken, and each image cropped to an area around both eyes. The average image is calculated and used as a template.Figure 4-1 The average eyes. Used as a template for eye detection.Both eyes are included in a single template, rather than individually searching for each eye in turn, as the characteristic symmetry of the eyes either side of the nose, provide a useful feature that helps distinguish between the eyes and other false positives that may be picked up in the background. Although this method is highly susceptible to scale (i.e. subject distance from the camera) and also introduces the assumption that eyes in the image appear near horizontal. Some preliminary experimentation also reveals that it is advantageous to include the area of skin just beneath the eyes. The reason being that in some cases the eyebrowscan closely match the template, particularly if there are shadows in the eye-sockets, but the area of skin below the eyes helps to distinguish the eyes from eyebrows (the area just below the eyebrows contain eyes, whereas the area below the eyes contains only plain skin).A window is passed over the test images and the absolute difference taken to that of the average eye image shown above. The area of the image with the lowest difference is taken as the region of interest containing the eyes. Applying the same procedure using a smaller template of the individual left and right eyes then refines each eye position.This basic template-based method of eye localization, although providing fairly precise localizations, often fails to locate the eyes completely. However, we are able to improve performance by including a weighting scheme.Eye localization is performed on the set of training images, which is then separated into two sets: those in which eye detection was successful; and those in which eye detection failed. Taking the set of successful localizations we compute the average distance from the eye template (Figure 4-2 top). Note that the image is quite dark, indicating that the detected eyes correlate closely to the eye template, as we would expect. However, bright points do occur near the whites of the eye, suggesting that this area is often inconsistent, varying greatly from the average eye template.Figure 4-2 – Distance to the eye template for successful detections (top) indicating variance due to noise and failed detections (bottom) showing credible variance due to miss-detectedfeatures.In the lower image (Figure 4-2 bottom), we have taken the set of failed localizations(images of the forehead, nose, cheeks, background etc. falsely detected by the localization routine) and once again computed the average distance from the eye template. The bright pupils surrounded by darker areas indicate that a failed match is often due to the high correlation of the nose and cheekbone regions overwhelming the poorly correlated pupils. Wanting to emphasize the difference of the pupil regions for these failed matches and minimize the variance of the whites of the eyes for successful matches, we dividethe lower image values by the upper image to produce a weights vector as shown in Figure 4-3. When applied to the difference image before summing a total error, this weighting scheme provides a much improved detection rate.Figure 4-3 - Eye template weights used to give higher priority to those pixels that best representthe eyes.4.2 The Direct Correlation ApproachWe begin our investigation into face recognition with perhaps the simplest approach, known as the direct correlation method (also referred to as template matching by Brunelli and Poggio) involving the direct comparison of pixel intensity values taken from facial images. We use the term ‘Direct Correlation’to encompass all techniques in which face images are compared directly, without any form of image space analysis, weighting schemes or feature extraction, regardless of the distance metric used. Therefore, we do not infer that Pearson’s correlation is applied as the similarity function (although such an approach would obviously come under our definition of direct correlation). We typically use the Euclidean distance as our metric in these investigations (inversely related to Pearson’s correlation and can be considered as a scale and translation sensitive form of image correlation), as this persists with the contrast made between image space and subspace approaches in later sections.Firstly, all facial images must be aligned such that the eye centers are located at two specified pixel coordinates and the image cropped to remove any background information. These images are stored as grayscale bitmaps of 65 by 82 pixels and prior to recognition converted into a vector of 5330 elements (each element containing the corresponding pixel intensity value). Each corresponding vector can be thought of as describing a point within a 5330 dimensional image space. This simple principle can easily be extended to much larger images: a 256 by 256 pixel image occupies a single point in 65,536-dimensional image space and again, similar images occupy close points within that space. Likewise, similar faces are located close together within the image space, while dissimilar faces are spaced far apart. Calculating the Euclidean distance d, between two facial image vectors (often referred to as the query image q, and gallery image g), we get anindication of similarity. A threshold is then applied to make the final verification decision.4.2.1 Verification TestsThe primary concern in any face recognition system is its ability to correctly verify a claimed identity or determine a person's most likely identity from a set of potential matches in a database. In order to assess a given system’s ability to perform these tasks, a variety of evaluation methodologies have arisen. Some of these analysis methods simulate a specific mode of operation (i.e. secure site access or surveillance), while others provide a more mathematical description of data distribution in some classification space. In addition, the results generated from each analysis method may be presented in a variety of formats. Throughout the experimentations in this thesis, we primarily use the verification test as our method of analysis and comparison, although we also use Fisher’s Linear Discriminate to analyze individual subspace components in section 7 and the identification test for the final evaluations described in section 8. The verification test measures a system’s ability to correctly accept or reject the proposed identity of an individual. At a functional level, this reduces to two images being presented for comparison, for which the system must return either an acceptance (the two images are of the same person) or rejection (the two images are of different people). The test is designed to simulate the application area of secure site access. In this scenario, a subject will present some form of identification at a point of entry, perhaps as a swipe card, proximity chip or PIN number. This number is then used to retrieve a stored image from a database of known subjects (often referred to as the target or gallery image) and compared with a live image captured at the point of entry (the query image). Access is then granted depending on the acceptance/rejection decision.The results of the test are calculated according to how many times the accept/reject decision is made correctly. In order to execute this test we must first define our test set of face images. Although the number of images in the test set does not affect the results produced (as the error rates are specified as percentages of image comparisons), it is important to ensure that the test set is sufficiently large such that statistical anomalies become insignificant (for example, a couple of badly aligned images matching well). Also, the type of images (high variation in lighting, partial occlusions etc.) will significantly alter the results of thetest. Therefore, in order to compare multiple face recognition systems, they must be applied to the same test set.However, it should also be noted that if the results are to be representative of system performance in a real world situation, then the test data should be captured under precisely the same circumstances as in the application environment. On the other hand, if the purpose of the experimentation is to evaluate and improve a method of face recognition, which may be applied to a range of application environments, then the test data should present the range of difficulties that are to be overcome. This may mean including a greater percentage of ‘difficult’ images than would be expected in the perceived operating conditions and hence higher error rates in the results produced. Below we provide the algorithm for executing the verification test. The algorithm is applied to a single test set of face images, using a single function call to the face recognition algorithm: Compare Faces (FaceA, FaceB). This call is used to compare two facial images, returning a distance score indicating how dissimilar the two face images are: the lower the score the more similar the two face images. Ideally, images of the same face should produce low scores, while images of different faces should produce high scores.Every image is compared with every other image, no image is compared with itself and no pair is compared more than once (we assume that the relationship is symmetrical). Once two images have been compared, producing a similarity score, the ground-truth is used to determine if the images are of the same person or different people. In practical tests this information is often encapsulated as part of the image filename (by means of a unique person identifier). Scores are then stored in one of two lists: a list containing scores produced by comparing images of different people and a list containing scores produced by comparing images of the same person. The final acceptance/rejection decision is made by application of a threshold. Any incorrect decision is recorded as either a false acceptance or false rejection. The false rejection rate (FRR) is calculated as the percentage of scores from the same people that were classified as rejections. The false acceptance rate (FAR) is calculated as the percentage of scores from different people that were classified as acceptances.These two error rates express the inadequacies of the system when operating at a specific threshold value. Ideally, both these figures should be zero, but in reality reducing either the FAR or FRR (by altering the threshold value) willinevitably result in increasing the other. Therefore, in order to describe the full operating range of a particular system, we vary the threshold value through the entire range of scores produced. The application of each threshold value produces an additional FAR, FRR pair, which when plotted on a graph produces the error rate curve shown below.Figure 4-5 - Example Error Rate Curve produced by the verification test.The equal error rate (EER) can be seen as the point at which FAR is equal to FRR. This EER value is often used as a single figure representing the general recognition performance of a biometric system and allows for easy visual comparison of multiple methods. However, it is important to note that the EER does not indicate the level of error that would be expected in a real world application. It is unlikely that any real system would use a threshold value such that the percentage of false acceptances was equal to the percentage of false rejections. Secure site access systems would typically set the threshold such that false acceptances were significantly lower than false rejections: unwilling to tolerate intruders at the cost of inconvenient access denials.Surveillance systems on the other hand would require low false rejection rates to successfully identify people in a less controlled environment. Therefore we should bear in mind that a system with a lower EER might not necessarily be the better performer towards the extremes of its operating capability.There is a strong connection between the above graph and the receiver operating characteristic (ROC) curves, also used in such experiments. Both graphs are simply two visualizations of the same results, in that the ROC format uses the True Acceptance Rate (TAR), where TAR = 1.0 –FRR in place of the FRR,effectively flipping the graph vertically. Another visualization of the verification test results is to display both the FRR and FAR as functions of the threshold value. This presentation format provides a reference to determine the threshold value necessary to achieve a specific FRR and FAR. The EER can be seen as the point where the two curves intersect.Figure 4-6 - Example error rate curve as a function of the score thresholdThe fluctuation of these error curves due to noise and other errors is dependant on the number of face image comparisons made to generate the data. A small dataset that only allows for a small number of comparisons will results in a jagged curve, in which large steps correspond to the influence of a single image on a high proportion of the comparisons made. A typical dataset of 720 images (as used in section 4.2.2) provides 258,840 verification operations, hence a drop of 1% EER represents an additional 2588 correct decisions, whereas the quality of a single image could cause the EER to fluctuate by up to4 二维人脸识别4.1 特征定位在讨论两幅人脸图像的比较之前,我们先简单看下面部图像特征定位的初始过程。
介绍人脸识别在中国的应用英语作文

介绍人脸识别在中国的应用英语作文Facial Recognition in China: Seeing Faces in a New WayHave you ever looked at a photo of yourself and noticed how unique your face is? Each person's face is like aone-of-a-kind fingerprint, with special patterns and features that make it different from everyone else's. In China, we're using this special quality of faces in a really cool way called facial recognition technology!Facial recognition is like a super-smart camera that can identify people just by looking at their faces. It works kind of like a puzzle, breaking down the details of a person's face into a code made up of numbers and patterns. This code acts like a digital fingerprint that the computer can recognize and match to a specific person.So how does this amazing technology get used in China? Let me tell you about some of the ways it's making our lives easier and safer!Security CheckpointsImagine going to a busy train station or airport and not having to wait in a long line to show your ticket or ID. With facial recognition, the cameras can instantly identify you as youapproach the security checkpoint. As long as you're on the approved list, you can just walk right through! No more digging through your pockets or bags for documents.Catching Bad GuysUnfortunately, there are some people who break the law and try to cause trouble. Facial recognition can help the police catch these lawbreakers more easily. If a crime is committed, the cameras can scan the faces of people in the area and match them against a database of known criminals. The technology makes it much harder for bad guys to hide or get away with their misdeeds.Paying with a SmileHave you ever forgotten your wallet or lost your money? With facial recognition payment systems, you don't need to carry cash or cards. Just smile at the camera, and it will identify you and charge your account! This works at stores, restaurants, and even vending machines. It's like having a digital wallet built right into your face!Finding Missing PeopleSometimes, children or elderly people with memory problems can wander off and get lost. Facial recognitionnetworks help locate these missing individuals by scanning crowds and public areas for their facial data. Once found, their loved ones can be alerted, and help can be sent right away.Unlocking Your DevicesDo you have a hard time remembering all your passwords and PIN codes? Facial recognition can replace those by using your face as the key to unlock your phone, tablet, or computer. No more forgetting codes or getting locked out of your own devices!Overall, I think facial recognition is a really neat way of applying math, science, and computer skills to solve everyday problems and make our communities safer and more convenient. Who knows what other cool applications will be developed in the future? Maybe one day we'll be able to recognize our friends' pets by their furry faces too!Those are just some of the ways this fascinating technology is changing how we see and interact with the world around us. China is at the forefront of developing and using facial recognition in our daily lives. I'm excited to see what other innovations will come next in this ever-evolving field of biometric identification!。
智能 ai 相关英文单词

智能 AI 相关英文单词1. 介绍在当代科技的发展中,人工智能(Artificial Intelligence,简称AI)已经成为一个热门的话题。
随着智能技术的不断进步和应用,越来越多的人开始关注AI相关的英文单词。
本文将深入探讨与智能AI相关的英文单词,包括其定义、分类、应用等方面的内容。
2. 定义智能AI(Artificial Intelligence)是一种模拟人类智能的技术与系统。
它可以通过学习、推理和自适应来执行各种任务。
智能AI可以处理大量的数据和信息,并基于此做出决策。
它可以通过模式识别和机器学习来提高自身的性能。
3. 分类下面是一些与智能AI相关的英文单词分类:3.1 机器学习(Machine Learning)•监督学习(Supervised Learning)•无监督学习(Unsupervised Learning)•半监督学习(Semi-supervised Learning)•强化学习(Reinforcement Learning)3.2 深度学习(Deep Learning)•神经网络(Neural Networks)•卷积神经网络(Convolutional Neural Networks)•递归神经网络(Recurrent Neural Networks)•自编码器(Autoencoders)3.3 自然语言处理(Natural Language Processing)•文本分类(Text Classification)•命名实体识别(Named Entity Recognition)•机器翻译(Machine Translation)•问答系统(Question Answering)3.4 计算机视觉(Computer Vision)•物体检测(Object Detection)•图像分割(Image Segmentation)•人脸识别(Face Recognition)•图像生成(Image Generation)4. 应用智能AI的应用范围非常广泛,下面是一些常见的应用领域:4.1 医疗健康•医学影像诊断(Medical Imaging Diagnosis)•基因组学研究(Genomic Research)•个性化医疗(Personalized Medicine)•药物研发(Drug Discovery)4.2 交通运输•自动驾驶汽车(Autonomous Vehicles)•交通监控与管理(Traffic Monitoring and Management)•路线规划(Route Planning)•物流管理(Logistics Management)4.3 金融服务•欺诈检测(Fraud Detection)•个性化推荐(Personalized Recommendations)•风险管理(Risk Management)•量化交易(Quantitative Trading)4.4 教育与娱乐•自适应学习(Adaptive Learning)•智能辅导(Intelligent Tutoring)•游戏开发(Game Development)•虚拟现实(Virtual Reality)5. 总结本文对智能AI相关的英文单词进行了全面、详细、完整、深入的探讨。
Face Recognition(人脸识别)

Face RecognitionToday ,I will talk about the study about face recognition.(第二页)As for the face recognition, we main talk about Two-Dimensional Techniques. The study is from The University of York ,Department of Computer Science , as for the date, it is September 2005.(第三页)We say the background.The current identification technology mainly include: fingerprint identification指纹识别, retina recognition视网膜识别, iris recognition虹膜识别, gait recognition步态识别, vein recognition静脉识别, face recognition人脸识别, etc.advantages优点:Compared with other identification methods, face recognition because of its direct, friendly and convenient features, users do not have any psychological barriers, is easy to be accepted by users.(第四页)Two-Dimensional Face Recognition is main about Face Localization.This consists of two stages: face detection(人脸检测)and eye localization(眼睛定位). (第五页)Today we main study the research of eye localization.Eye localization is performed on the set of training images, which is then separated into two groups. By it, we can compute the average distance from the eye template. one is eye detection was successful (like the picture on), the dark picture means the detected eyes is closed to the eye template; and the other is failed(like the picture down), the bright points down means doesn’t close.(第六页)We do the research using the way: The Direct Correlation Approach(直接相关方法).This is the way we make the study, you can have a little know about it. So I will not talk much about it.(第七页)This is the study’s main Experimental Process.It is divided into some groups, calculate the distance d, between two facial image vectors, we can get an indication of similarity. Then a threshold is used to make the final verification decision.(第八页)The result wo get the picture. By the picture, we gets an EER (能效比)of 25.1%, this means that one quarter of all verification operations carried out resulted in an incorrect classification. That also means Tiny changes cause the change of the location in image.(第九页)Conclusion: Two-Dimensional Techniques (we say 2D) is an important part in face recognition. It make a large use in face recognition. All in all, Face recognition is the easiest way to be accepted in the identification field.Thank you!。
人脸识别英文专业词汇教学内容

gallery set参考图像集Probe set=test set测试图像集face renderingFacial Landmark Detection人脸特征点检测3D Morphable Model 3D形变模型AAM (Active Appearance Model)主动外观模型Aging modeling老化建模Aging simulation老化模拟Analysis by synthesis 综合分析Aperture stop孔径光标栏Appearance Feature表观特征Baseline基准系统Benchmarking 确定基准Bidirectional relighting 双向重光照Camera calibration摄像机标定(校正)Cascade of classifiers 级联分类器face detection 人脸检测Facial expression面部表情Depth of field 景深Edgelet 小边特征Eigen light-fields本征光场Eigenface特征脸Exposure time曝光时间Expression editing表情编辑Expression mapping表情映射Partial Expression Ratio Image局部表情比率图(,PERI) extrapersonal variations类间变化Eye localization,眼睛定位face image acquisition 人脸图像获取Face aging人脸老化Face alignment人脸对齐Face categorization人脸分类Frontal faces 正面人脸Face Identification人脸识别Face recognition vendor test人脸识别供应商测试Face tracking人脸跟踪Facial action coding system面部动作编码系统Facial aging面部老化Facial animation parameters脸部动画参数Facial expression analysis人脸表情分析Facial landmark面部特征点Facial Definition Parameters人脸定义参数Field of view视场Focal length焦距Geometric warping几何扭曲Street view街景Head pose estimation头部姿态估计Harmonic reflectances谐波反射Horizontal scaling水平伸缩Identification rate识别率Illumination cone光照锥Inverse rendering逆向绘制技术Iterative closest point迭代最近点Lambertian model朗伯模型Light-field光场Local binary patterns局部二值模式Mechanical vibration机械振动Multi-view videos多视点视频Band selection波段选择Capture systems获取系统Frontal lighting正面光照Open-set identification开集识别Operating point操作点Person detection行人检测Person tracking行人跟踪Photometric stereo光度立体技术Pixellation像素化Pose correction姿态校正Privacy concern隐私关注Privacy policies隐私策略Profile extraction轮廓提取Rigid transformation刚体变换Sequential importance sampling序贯重要性抽样Skin reflectance model,皮肤反射模型Specular reflectance镜面反射Stereo baseline 立体基线Super-resolution超分辨率Facial side-view面部侧视图Texture mapping纹理映射Texture pattern纹理模式Rama Chellappa读博计划:1.完成先前关于指纹细节点统计建模的相关工作。
人脸识别简短英语作文
人脸识别简短英语作文Title: Facial Recognition Technology Revolutionizing Security and Convenience。
Introduction:Facial recognition technology has emerged as a groundbreaking innovation that has revolutionized various aspects of our lives. This cutting-edge technology utilizes biometric data to identify individuals based on theirunique facial features. With its ability to enhancesecurity measures and streamline processes, facial recognition has become increasingly popular in recent years.Body:1. Enhanced Security Measures:Facial recognition technology has significantlyimproved security measures in various sectors. For instance,it is extensively used in law enforcement agencies to identify criminals and suspects. By comparing facial images captured from surveillance cameras with a comprehensive database, authorities can quickly identify and apprehend potential threats. This has proven to be a valuable tool in preventing crime and maintaining public safety.2. Convenient Access Control:Facial recognition technology has simplified access control systems, making them more convenient and efficient. Traditional methods such as key cards or passwords can easily be lost or stolen, compromising security. However, with facial recognition, individuals can gain access to secure areas simply by having their face scanned. This eliminates the need for physical tokens and enhances security by ensuring that only authorized personnel can enter restricted areas.3. Improved User Experience:Facial recognition technology has significantlyimproved user experiences in various industries. For example, in the travel sector, airports have adopted facial recognition systems to expedite the check-in and boarding processes. Passengers can simply have their faces scanned, eliminating the need for physical documents and reducing waiting times. This not only enhances convenience but also improves overall customer satisfaction.4. Efficient Identification and Verification:Facial recognition technology has made identification and verification processes more efficient and accurate. In sectors such as banking and finance, this technology is used for identity verification during customer onboarding. By comparing a person's facial image with their official identification documents, banks can ensure that the person opening an account is indeed the rightful owner. This helps prevent identity theft and fraudulent activities, enhancing the overall security of financial transactions.5. Ethical and Privacy Concerns:While facial recognition technology offers numerous benefits, it also raises ethical and privacy concerns. The collection and storage of biometric data raise questions about the potential misuse of personal information. Additionally, there is a risk of false positives or false negatives, leading to wrongful identification or exclusion. Striking a balance between security and privacy is crucial to ensure the responsible and ethical use of facial recognition technology.Conclusion:Facial recognition technology has transformed security measures and improved convenience in various sectors. Its ability to enhance identification processes, simplify access control, and improve user experiences has made it an invaluable tool in today's world. However, it is essential to address ethical and privacy concerns to ensure the responsible and ethical use of this technology. With continued advancements and careful considerations, facial recognition technology will continue to shape the future, making our lives safer and more convenient.。
人脸识别英文原文(可供中文翻译)
Copyright 1998 IEEE. Personal use of this material is permitted. However, permission to reprint/republish this material for advertising or promotional pur- poses or for creating new collective works for resale or redistribution to servers or lists, or to reuse any copyrighted component of this work in other works must be obtained from the IEEE.Neural Network-Based Face DetectionHenry A.Rowley,Shume et Baluja,a nd Ta k e o K a n a d eAbstractWe present a neural network-based upright frontal face detection system. A retinally con- nected neural network examines small windows of an image, and decides whether each win- dow contains a face. The system arbitrates between multiple networks to improve performance over a single network. We present a straightforward procedure for aligning positive face ex- amples for training. To collect negative examples, we use a bootstrap algorithm, which adds false detections into the training set as training progresses. This eliminates the difficult task of manually selecting nonface training examples, which must be chosen to span the entire space of nonface images. Simple heuristics, such as using the fact that faces rarely overlap in images, can further improve the accuracy. Comparisons with several other state-of-the-art face detec- tion systems are presented; showing that our system has comparable performance in terms of detection and false-positive rates.Keywords: Face detection, Pattern recognition, Computer vision, Artificial neural networks, Ma- chine learning1 IntroductionIn this paper, we present a neural network-based algorithm to detect upright, frontal views of faces in gray-scale images1. The algorithm works by applying one or more neural networks directly to portions of the input image, and arbitrating their results. Each network is trained to output the presence or absence of a face. The algorithms and training methods are designed to be general, with little customization for faces.Many face detection researchers have used the idea that facial images can be characterized directly in terms of pixel intensities. These images can be characterized by probabilistic models of the set of face images [4, 13, 15], or implicitly by neural networks or other mechanisms [3, 12, 14,19, 21, 23, 25, 26]. The parameters for these models are adjusted either automatically from exampleimages (as in our work) or by hand. A few authors have taken the approach of extracting features and applying either manually or automatically generated rules for evaluating these features [7, 11].Training a neural network for the face detection task is challenging because of the difficulty in characterizing prototypical “non f ace” images. Unlike face recognition, in which the classes to be discriminated are different faces, the two classes to be discriminated in face detection are “images containing faces”and “images not containing f aces”. It is easy to get a representative sample of images which contain faces, but much harder to get a representative sample of those which do not. We avoid the problem of using a huge training set for nonfaces by selectively adding images to thetraining set as training progresses [21]. This “bootstra p”method reduces the size of the training set needed. The use of arbitration between multiple networks and heuristics to clean up the results significantly improves the accuracy of the detector.Detailed descriptions of the example collection and training methods, network architecture,and arbitration methods are given in Section 2. In Section 3, the performance of the system is examined. We find that the system is able to detect 90.5% of the faces over a test set of 130 complex images, with an acceptable number of false positives. Section 4 briefly discusses some techniques that can be used to make the system run faster, and Section 5 compares this system with similar systems. Conclusions and directions for future research are presented in Section 6.2 Description of the SystemOur system operates in two stages: it first applies a set of neural network-based filters to an image, and then uses an arbitrator to combine the outputs. The filters examine each location in the image at several scales, looking for locations that might contain a face. The arbitrator then merges detections from individual filters and eliminates overlapping detections.2.1 Stage One: A Neural Network-Based FilterThe first component of our system is a filter that receives as input a 20x20 pixel region of the image, and generates an output ranging from 1 to -1, signifying the presence or absence of a face, respectively. To detect faces anywhere in the input, the filter is applied at every location in the image. To detect faces larger than the window size, the input image is repeatedly reduced in size (by subsampling), and the filter is applied at each size. This filter must have some invariance to position and scale. The amount of invariance determines the number of scales and positions at which it must be applied. For the work presented here, we apply the filter at every pixel position in the image, and scale the image down by a factor of 1.2 for each step in the pyramid.The filtering algorithm is shown in Fig. 1. First, a preprocessing step, adapted from [21], isapplied to a window of the image. The window is then passed through a neural network, which decides whether the window contains a face. The preprocessing first attempts to equalize the intensity values in across the window. We fit a function which varies linearly across the window to the intensity values in an oval region inside the window. Pixels outside the oval (shown in Fig. 2a) may represent the background, so those intensity values are ignored in computing the lighting variation across the face. The linear function will approximate the overall brightness of each part of the window, and can be subtracted from the window to compensate for a variety of lighting conditions. Then histogram equalization is performed, which non-linearly maps the intensity values to expand the range of intensities in the window. The histogram is computed for pixels inside an oval region in the window. This compensates for differences in camera input gains, as well as improving contrast in some cases. The preprocessing steps are shown in Fig. 2.The preprocessed window is then passed through a neural network. The network has retinalconnections to its input layer; the receptive fields of hidden units are shown in Fig. 1. There are three types of hidden units: 4 which look at 10x10 pixel subregions, 16 which look at 5x5 pixel subregions, and 6 which look at overlapping 20x5 pixel horizontal stripes of pixels. Each of these types was chosen to allow the hidden units to detect local features that might be important forface detection. In particular, the horizontal stripes allow the hidden units to detect such features as mouths or pairs of eyes, while the hidden units with square receptive fields might detect features such as individual eyes, the nose, or corners of the mouth. Although the figure shows a single hidden unit for each subregion of the input, these units can be replicated. For the experiments which are described later, we use networks with two and three sets of these hidden units. Similar input connection patterns are commonly used in speech and character recognition tasks [10, 24]. The network has a single, real-valued output, which indicates whether or not the window contains a face.Examples of output from a single network are shown in Fig. 3. In the figure, each box representsthe position and size of a window to which the neural network gave a positive response. The network has some invariance to position and scale, which results in multiple boxes around some faces. Note also that there are some false detections; they will be eliminated by methods presented in Section 2.2.TTo train the neural network used in stage one to serve as an accurate filter, a large number offace and nonface images are needed. Nearly 1050 face examples were gathered from face databases at CMU, Harvard2, and from the World Wide Web. The images contained faces of various sizes, orientations, positions, and intensities. The eyes, tip of nose, and corners and center of the mouth of each face were labelled manually. hese points were used to normalize each face to the same scale, orientation, and position, as follows:1. Initialize , a vector which will be the average positions of each labelled feature over all the faces, with the feature locations in the first face F.2. The feature coordinates in are rotated, translated, and scaled, so that the average locations of the eyes will appear at predetermined locations in a 20x20 pixel window.3. For each face i, compute the best rotation, translation, and scaling to align the face’s featuresF with the average feature locations . Such transformations can be written as a linearfunction of their parameters. Thus, we can write a system of linear equations mapping thefeatures from F to. The least squares solution to this over-constrained systemyields thep arameters for the best alignment transformation. Call the aligned feature locations F.4. Update by averaging the aligned feature locationsfor each face .5. Go to step 2.The alignment algorithm converges within five iterations, yielding for each face a function whichmaps that face to a 20x20 pixel window. Fifteen face examples are generated for the training setfrom each original image, by randomly rotating the images (about their center points) up to 10,scaling between 90% and 110%, translating up to half a pixel, and mirroring. Each 20x20 window in the set is then preprocessed (by applying lighting correction and histogram equalization). A few example images are shown in Fig. 4. The randomization gives the filter invariance to translations of less than a pixel and scalings of 20%. Larger changes in translation and scale are dealt with by applying the filter at every pixel position in an image pyramid, in which the images are scaled by factors of 1.2.Practically any image can serve as a nonface example because the space of nonface images ismuch larger than the space of face images. However, collecting a “representativ e” set of nonfacesis difficult. Instead of collecting the images before training is started, the images are collected during training, in the following manner, adapted from [21]:1. Create an initial set of nonface images by generating 1000 random images. Apply the pre- processing steps to each of these images.2. Train a neural network to produce an output of 1 for the face examples, and -1 for the nonface examples. The training algorithm is standard error backpropogation with momentum [8]. On the first iteration of this loop, the network’s weights are initialized randomly. After the first iteration, we use the weights computed by training in the previous iteration as the starting point.3. Run the system on an image of scenery which contains no faces. Collect subimages in which the network incorrectly identifies a face (an output activation ).4. Select up to 250 of these subimages at random, apply the preprocessing steps, and add them into the training set as negative examples. Go to step 2.Some examples of nonfaces that are collected during training are shown in Fig. 5. Note that some of the examples resemble faces, although they are not very close to the positive examples shown in Fig. 4. The presence of these examples forces the neural network to learn the precise boundary between face and nonface images. We used 120 images of scenery for collecting negative examples in the bootstrap manner described above. A typical training run selects approximately8000 nonface images from the 146,212,178 subimages that are available at all locations and scalesin the training scenery images. A similar training algorithm was described in [5], where at each iteration an entirely new network was trained with the examples on which the previous networks had made mistakes.2.2 Stage Two: Merging Overlapping Detections and ArbitrationThe examples in Fig. 3 showed that the raw output from a single network will contain a number of false detections. In this section, we present two strategies to improve the reliability of the detector: merging overlapping detections from a single network and arbitrating among multiple networks.2.2.1 Merging Overlapping DetectionsNote that in Fig. 3, most faces are detected at multiple nearby positions or scales, while false detec- tions often occur with less consistency. This observation leads to a heuristic which can eliminate many false detections. For each location and scale, the number of detections within a specified neighborhood of that location can be counted. If the number is above a threshold, then that lo- cation is classified as a face. The centroid of the nearby detections defines the location of the detection result, thereby collapsing multiple detections. In the experiments section, this heuristic will be referred to as “thres holding”.If a particular location is correctly identified as a face, then all other detection locations whichoverlap it are likely to be errors, and can therefore be eliminated. Based on the above heuristic regarding nearby detections, we preserve the location with the higher number of detections withina small neighborhood, and eliminate locations with fewer detections. In the discussion of the experiments, this heuristic is called “overlap elimination”. There are relatively few cases in which this heuristic fails; however, one such case is illustrated by the left two faces in Fig. 3B, where one face partially occludes another.The implementation of these two heuristics is illustrated in Fig. 6. Each detection at a particularlocation and scale is marked in an image pyramid, labelled the “output”pyramid. Then, each location in the pyramid is replaced by the number of detections in a specified neighborhood of that location. This has the effect of “spreading out”the detections. Normally, the neighborhood extends an equal number of pixels in the dimensions of scale and position, but for clarity in Fig. 6 detections are only spread out in position. A threshold is applied to these values, and the centroids (in both position and scale) of all above threshold regions are computed. All detections contributing to a centroid are collapsed down to a single point. Each centroid is then examined in order, starting from the ones which had the highest number of detections within the specified neighborhood. If any other centroid locations represent a face overlapping with the current centroid, they are removed from the output pyramid. All remaining centroid locations constitute the final detection result. In the face detection work described in [3], similar observations about the nature of the outputs were made, resulting in the development of heuristics similar to those described above.2.2.2 Arbitration among Multiple NetworksTo further reduce the number of false positives, we can apply multiple networks, and arbitrate between their outputs to produce the final decision. Each network is trained in a similar manner, but with random initial weights, random initial nonface images, and permutations of the order of presentation of the scenery images. As will be seen in the next section, the detection and false positive rates of the individual networks will be quite close. However, because of different training conditions and because of self-selection of negative training examples, the networks will have different biases and will make different errors. the implementation of arbitration is illustrated in Fig. 7. Each detection at a particular position and scale is recorded in an image pyramid, as was done with the previous heuristics. One way to combine two such pyramids is by ANDing them. This strategy signals a detection only if both networks detect a face at precisely the same scale and position. Due to the different biases of the individual networks, they will rarely agree on a false detection of a face. This allows ANDing to eliminate most false detections. Unfortunately, this heuristic can decrease the detection rate because a face detected by only one network will be thrown out. However, we will see later that individual networks can all detect roughly the same set of faces, so that the number of faces lost due to ANDing is small.Similar heuristics, such as ORing the outputs of two networks, or voting among three networks,were also tried. Each of these arbitration methods can be applied before or after the “thres holding” and “overlap elimina tion”heuristics. If applied afterwards, we combine the centroid locations rather than actual detection locations, and require them to be within some neighborhood of one another rather than precisely aligned.Arbitration strategies such as ANDing, ORing, or voting seem intuitively reasonable, but per- haps there are some less obvious heuristics that could perform better. To test this hypothesis, we applied a separate neural network to arbitrate among multiple detection networks. For a location of interest, the arbitration network examines a small neighborhood surrounding that location in theoutput pyramid of each individual network. For each pyramid, we count the number of detections in a 3x3 pixel region at each of three scales around the location of interest, resulting in three num- bers for each detector, which are fed to the arbitration network, as shown in Fig. 8. The arbitration network is trained to produce a positive output for a given set of inputs only if that location con- tains a face, and to produce a negative output for locations without a face. As will be seen in the next section, using an arbitration network in this fashion produced results comparable to (and in some cases, slightly better than) those produced by the heuristics presented earlier.3 Experimental ResultsA number of experiments were performed to evaluate the system. We first show an analysis of which features the neural network is using to detect faces, then present the error rates of the system over two large test sets.3.1 Sensitivity AnalysiSIn order to determine which part of its input image the network uses to decide whether the input is a face, we performed a sensitivity analysis using the method of [2]. We collected a positive test set based on the training database of face images, but with different randomized scales, translations, and rotations than were used for training. The negative test set was built from a set of negative examples collected during the training of other networks. Each of the 20x20 pixel input images was divided into 100 2x2 pixel subimages. For each subimage in turn, we went through the test set, replacing that subimage with random noise, and tested the neural network. The resulting root mean square error of the network on the test set is an indication of how important that portion of the image is for the detection task. Plots of the error rates for two networks we trained are shown in Fig. 9. Network 1 uses two sets of the hidden units illustrated in Fig. 1, while Network 2 uses three sets.The networks rely most heavily on the eyes, then on the nose, and then on the mouth (Fig. 9).Anecdotally, we have seen this behavior on several real test images. In cases in which only one eye is visible, detection of a face is possible, though less reliable, than when the entire face is visible. The system is less sensitive to the occlusion of the nose or mouth. 3.2 Testing The system was tested on two large sets of images, which are distinct from the training sets. Test Set 1 consists of a total of 130 images collected at CMU, including images from the World Wide Web, scanned from photographs and newspaper pictures, and digitized from broadcast television3. It also includes 23 images used in [21] to measure the accuracy of their system. The images contain a total of 507 frontal faces, and require the networks to examine 83,099,211 20x20 pixel windows. The images have a wide variety of complex backgrounds, and are useful in measuring the false alarm rate of the system. Test Set 2 is a subset of the FERET database [16, 17]. Each image contains one face, and has (in most cases) a uniform background and good lighting. There are a wide variety of faces in the database, which are taken at a variety of angles. Thus these images aremore useful for checking the angular sensitivity of the detector, and less useful for measuring the false alarm rate.The outputs from our face detection networks are not binary. The neural network produce reavalues between 1 and -1, indicating whether or not the input contains a face. A threshold value of zero is used during training to select the negative examples (if the network outputs a value of greater than zero for any input from a scenery image, it is considered a mistake). Although this value is intuitively reasonable, by changing this value during testing, we can vary how conserva- tive the system is. To examine the effect of this threshold value during testing, we measured the detection and false positive rates as the threshold was varied from 1 to -1. At a threshold of 1, the false detection rate is zero, but no faces are detected. As the threshold is decreased, the number of correct detections will increase, but so will the number of false detections. This tradeoff is presented in Fig. 10, which shows the detection rate plotted against the number of false positives as the threshold is varied, for the two networks presented in the previous section. Since the zero threshold locations are close to the “knees”of the curves, as can be seen from the figure, we used a zero threshold valuethroughout testing.Table 1 shows the performance of different versions of the detector on Test Set 1. The fourcolumns show the number of faces missed (out of 507), the detection rate, the total number of false detections, and the false detection rate. The last rate is in terms of the number of 20x20 pixel windows that must be examined, which is approximately3:3times the number of pixels in an image (taking into account all the levels in the input pyramid). First we tested four networks working alone, then examined the effect ofoverlap elimination and collapsing multiple detections, and tested arbitration using ANDing, ORing, voting, and neural networks. Networks 3 and 4 are identical to Networks 1 and 2, respectively, except that the negative example images were presented in a different order during training. The results for ANDing and ORing networks were based on Networks 1 and 2, while voting and network arbitration were based on Networks 1, 2, and 3. The neural network arbitrators were trained using the images from which the face examples were extracted. Three different architectures for the network arbitrator were used. The first used 5 hidden units, as shown in Fig. 8. The second used two hidden layers of 5 units each, with complete connections between each layer, and additional connections between the first hidden layer and the output. The last architecture was a simple perceptron, with no hidden units.As discussed earlier, the “thres holding” heuristic for merging detections requires two param-eters, which specify the size of the neighborhood used in searching for nearby detections, and the threshold on the number of detections that must be found in that neighborhood. In the table, these two parameters are shown in parentheses after the word “thres hold”. Similarly, the ANDing, ORing, and voting arbitration methods have a parameter specifying how close two detections (or detection centroids) must be in order to be counted as identical.Systems 1 through 4 show the raw performance of the networks. Systems 5 through 8 usethe same networks, but include the thresholding and overlap elimination steps which decrease the number of false detections significantly, at the expense of a small decrease in the detection rate. The remaining systems all use arbitration among multiple networks. Using arbitration further reduces the false positive rate, and in some cases increases the detection rate slightly. Note that for systems using arbitration, the ratio of false detections to windows examined is extremely low, ranging from 1 false detection per 449;184windows to down to 1 in 41;549;605, depending on the type of arbitration used. Systems 10, 11, and 12 show that the detector can be tuned to make it more or less conservative. System 10, which uses ANDing, gives an extremely small number of false positives, and has a detection rate of about 77.9%. On the other hand, System 12, which is based on ORing, has a higher detection rate of 90.3% but also has a larger number of false detections. System 11 provides a compromise between the two. The differences in performance of these systems can be understood by considering the arbitration strategy. When using ANDing, a false detection made by only one network is suppressed, leading to a lower false positive rate. On the other hand, when ORing is used, faces detected correctly by only one network will be preserved, improving the detection rate.Systems 14, 15, and 16, all of which use neural network-based arbitration among three net-works, yield detection and false alarm rates between those of Systems 10 and 11. System 13, which uses voting among three networks, has an accuracy between that of Systems 11 and 12. System 17 will be described in the next section.Table 2 shows the result of applying each of the systems to images in Test Set 2 (a subset of public portion of the FERET database [16, 17]). We partitioned the images into three groups, based on the nominal angle of the face with respect to the camera: frontal faces, faces at an anglefrom the camera, and faces at an angle of . The direction of the face variessignificantlywithin these groups. As can be seen from the table, the detection rate for systems arbitrating twonetworks ranges between 97.8% and 100.0% for frontalfaces, while for faces, the anddetection rate is between 91.5% and 97.4%. This difference is because the training set contains mostly frontal faces. It is interesting to note that the systems generally have a higher detection ratefor faces at an angle of than for frontal faces. The majority of people whose frontalfaces aremissed are wearing glasses which are reflecting light into the camera. The detector is not trained on such images, and expects the eyes to be darker than the rest of the face. Thus the detection rate for such faces is lower.Based on the results shown in Tables 1 and 2, we concluded that both Systems 11 and 15make acceptable tradeoffs between the number of false detections and the detection rate. Because System 11 is less complex than System 15 (using only two networks rather than a total of four), it is preferable. System 11 detects on average 86.2% of the faces, with an average of one false detection per 3;613;00920x20 pixel windows examined in Test Set 1. Figs. 11, 12, and 13 show example output images from System 11 on images from Test Set 15.4 Improving the SpeedIn this section, we briefly discuss some methods to improve the speed of the system. The work described is preliminary, and is not intended to be an exhaustive exploration of methods to optimize the execution time.Further performance improvements can be made if one is analyzing many pictures taken by a stationary camera. By taking a picture of the background scene, one can determine which portions of the picture have changed in a newly acquired image, and analyze only those portions of the image. Similarly, a skin color detector like the one presented in [9] can restrict the search region. These techniques, taken together, have proven useful in building an almost real-time version of the system suitable for demonstration purposes, which can process a 320x240 image in 2 to 4 seconds, depending on the image complexity.5 Comparison to Other SystemsSung and Poggio developed a face detection system based on clustering techniques [21]. Their system, like ours, passes a small window over all portions of the image, and determines whether a face exists in each window.。
人脸识别英文专业词汇
gallery set参考图像集Probe set=test set测试图像集face renderingFacial Landmark Detection人脸特征点检测3D Morphable Model 3D形变模型AAM (Active Appearance Model)主动外观模型Aging modeling老化建模Aging simulation老化模拟Analysis by synthesis 综合分析Aperture stop孔径光标栏Appearance Feature表观特征Baseline基准系统Benchmarking 确定基准Bidirectional relighting双向重光照Camera calibration摄像机标定(校正)Cascade of classifiers级联分类器face detection 人脸检测Facial expression面部表情Depth of field 景深Edgelet 小边特征Eigen light-fields本征光场Eigenface特征脸Exposure time曝光时间Expression editing表情编辑Expression mapping表情映射Partial Expression Ratio Image局部表情比率图(,PERI) extrapersonal variations类间变化Eye localization,眼睛定位face image acquisition人脸图像获取Face aging人脸老化Face alignment人脸对齐Face categorization人脸分类Frontal faces 正面人脸Face Identification人脸识别Face recognition vendor test人脸识别供应商测试Face tracking人脸跟踪Facial action coding system面部动作编码系统Facial aging面部老化Facial animation parameters脸部动画参数Facial expression analysis人脸表情分析Facial landmark面部特征点Facial Definition Parameters人脸定义参数Field of view视场Focal length焦距Geometric warping几何扭曲Street view街景Head pose estimation头部姿态估计Harmonic reflectances谐波反射Horizontal scaling水平伸缩Identification rate识别率Illumination cone光照锥Inverse rendering逆向绘制技术Iterative closest point迭代最近点Lambertian model朗伯模型Light-field光场Local binary patterns局部二值模式Mechanical vibration机械振动Multi-view videos多视点视频Band selection波段选择Capture systems获取系统Frontal lighting正面光照Open-set identification开集识别Operating point操作点Person detection行人检测Person tracking行人跟踪Photometric stereo光度立体技术Pixellation像素化Pose correction姿态校正Privacy concern隐私关注Privacy policies隐私策略Profile extraction轮廓提取Rigid transformation刚体变换Sequential importance sampling序贯重要性抽样Skin reflectance model,皮肤反射模型Specular reflectance镜面反射Stereo baseline立体基线Super-resolution超分辨率Facial side-view面部侧视图Texture mapping纹理映射Texture pattern纹理模式Rama Chellappa读博计划:1.完成先前关于指纹细节点统计建模的相关工作。
人脸识别英文作文
人脸识别英文作文Face recognition technology has become increasingly popular in recent years. It is a fascinating and controversial topic that has sparked debates anddiscussions around the world. The ability to identify and verify individuals based on their facial features has numerous applications and implications, both positive and negative.The use of face recognition technology in security systems is one of its most widely known applications. It allows for quick and accurate identification of individuals, enhancing the efficiency and effectiveness of security measures. This technology has been adopted in airports, government buildings, and even smartphones, providing a convenient and secure way to access restricted areas or personal devices.Another interesting application of face recognition technology is in the field of entertainment. Many amusementparks and attractions now use this technology to create personalized experiences for visitors. By scanning their faces, the system can identify individuals and tailor the attractions accordingly, providing a unique and immersive experience.In addition to its practical applications, face recognition technology has also raised concerns about privacy and personal data protection. The ability to capture and store facial images raises questions about who has access to this information and how it can be used. People worry that their identities could be stolen or misused, leading to potential harm or discrimination.Furthermore, the accuracy and reliability of face recognition technology have been subjects of debate. Some argue that the technology is not foolproof and can beeasily tricked or manipulated. Others believe that the algorithms used in these systems are biased and may produce false positives or negatives, leading to wrongful identifications or exclusions.Despite the controversies and concerns surrounding face recognition technology, its potential for positive impact cannot be ignored. It has the ability to revolutionize various industries, from security to healthcare and beyond. However, it is crucial to strike a balance between the benefits and risks associated with its use, ensuring that proper regulations and safeguards are in place to protect individuals' rights and privacy.In conclusion, face recognition technology is apowerful tool with a wide range of applications. Itsability to identify and verify individuals based on their facial features has both positive and negative implications. While it enhances security and provides personalized experiences, it also raises concerns about privacy and accuracy. It is important to carefully consider the ethical and legal implications of its use and ensure that it is implemented in a responsible and transparent manner.。
- 1、下载文档前请自行甄别文档内容的完整性,平台不提供额外的编辑、内容补充、找答案等附加服务。
- 2、"仅部分预览"的文档,不可在线预览部分如存在完整性等问题,可反馈申请退款(可完整预览的文档不适用该条件!)。
- 3、如文档侵犯您的权益,请联系客服反馈,我们会尽快为您处理(人工客服工作时间:9:00-18:30)。
Application
Face Recognition Access Control System
Face Recognition access control system is called FaceGate, Whenever one wishes to access a building, FaceGate verifies the person’s entry code or card, then compares his face with its stored “key.” It registers him as being authorized and allows him to enter the building. Access is denied to anyone whose face does not match.
Fundamentals
step 3 ) recognization process
After step2, the extracted feature of the input face is matched against those faces in the database; just like this pictuer, it outputs the result when a match is found.
Application
Face recognition to pay
Alibaba Group founder Jack Ma showed off the technology Sunday during a CeBIT event that would seamlessly scan users’ faces via their smartphones to verify mobile payments. The technology, called “Smile to Pay,” is being developed
Face recognition-based systems in these applications can achieve high accuracy without much cooperation from the users.
Thank You!
Face Recognition
甘显豪 张向裕 孙吉刚 劳建成 范 超
Contents
Face Recognition Processing Flow Fundamentals
Application
step1 step2 step3
What is Face Recognition
An advance biometric identification technique
by Alibaba’s finance arm, Ant Financial.
Application
Find My Face---a tagging suggestion tool for its Google+ social network.
Find My Face scans users' and their friends' photos for recognizable faces, and suggests nametags for the faces by matching them with users' profile photos and other tagged photos on the social network.
Fundamentals
step 2 ) feature extraction for trained set(database) at the same time for input image
Feature extraction can provide effective information .Like those pictures, a birthmark under the right eye is useful to distinguish that they are one person.
Fundamentals
step 1 ) face deteห้องสมุดไป่ตู้tion
In this step, the system will check is input image a face or not?
face detection is a computer technology that identifies human faces in digital images. It detects human faces which might then be used for recognizing a particular face. This technology is being used in a variety of applications nowadays.
A computer application for automatically identifying or verifying a person from a digital image or a video frame from a video source.
Processing Flow