ch11MEASURING AND MANAGING ECONOMIC EXPOSURE(跨国公司财务管理-Joseph F. Greco)
与经济管理有关的 几个m单词

与经济管理有关的几个m单词Topic: The Impact of Monetary Policy on the EconomyIntroduction:Monetary policy is a crucial tool used by central banks to manage and control an economy. It involves actions taken by the central bank to regulate the supply of money, interest rates, and control inflation levels. In this article, we will explore several key terms related to monetary policy and discuss their significance in shaping the overall economic landscape.1. Money Supply:The term "money supply" refers to the total amount of money available in an economy at a given time. Central banks have the authority to influence the money supply through various measures such as open market operations, reserve requirements, and setting interest rates. By regulating the money supply, central banks aim to maintain price stability and promote sustainable economic growth.2. Interest Rates:Interest rates are the cost of borrowing money, typically expressed as an annual percentage. Central banks have the power to influenceinterest rates through monetary policy tools. Lowering interest rates encourages borrowing and investment, which stimulates economic activity. Conversely, raising interest rates can curb inflation and keep economic growth in check. The manipulation of interest rates by central banks is a crucial mechanism for regulating the overall economic environment.3. Inflation:Inflation is the sustained increase in the general price level of goods and services over a specific period. Central banks aim to keep inflation within a target range conducive to economic stability. Too high inflation erodes purchasing power and diminishes consumer confidence, while too low inflation can hinder economic growth. Monetary policy plays a vital role in curbing inflation by adjusting interest rates and controlling the money supply.4. Monetary Policy Tools:Central banks utilize various tools to implement monetary policy effectively. One such tool is open market operations, where the central bank buys or sells government securities to influence the money supply. By purchasing government bonds, the central bank injects money into the economy, increasing the money supply.Alternatively, selling government bonds reduces the money supply. Another tool is reserve requirements, which mandate that banks hold a certain percentage of customer deposits as reserves. Adjusting reserve requirements can influence the amount of money banks can lend out, thereby impacting the money supply. Lastly, the central bank can directly intervene in the foreign exchange market to manipulate exchange rates.5. Economic Growth:Monetary policy plays a crucial role in promoting economic growth. By maintaining price stability and controlling inflation, central banks create a favorable environment for businesses to invest and consumers to spend. Lower interest rates can stimulate borrowing for investment purposes, leading to increased production and job creation. However, excessive economic growth can result in overheating and financial imbalances, which necessitate appropriate monetary policy adjustments to ensure long-term stability.Conclusion:Understanding the key terms associated with monetary policy is essential to comprehend the intricate relationship between centralbank actions and an economy's performance. From regulating the money supply and interest rates to managing inflation and promoting economic growth, central banks utilize a range of tools strategically. By effectively implementing monetary policy, central banks aim to maintain financial stability, foster economic growth, and improve the overall welfare of a nation.。
Chapter+21Measuring GDP and Economic Growth

In the figure, the blue flow, Y, shows total income paid by firms to households.
© 2014 Pearson Addison-Wesley
Gross Domestic Product
© 2014 Pearson Addison-Wesley
© 2014 Pearson Addison-Wesley
Gross Domestic Product
GDP Defined GDP or gross domestic product is the market value of all final goods and services produced in a country in a given time period.
© 2014 Pearson Adhe U.S. economy expand more rapidly next year or will it sink back into another recession? To assess the state of the economy and to make big decisions about business expansion, firms use forecasts of GDP. What exactly is GDP? How do we use GDP to tell us how rapidly our economy is expanding or whether our economy is in a recession?
How do we take the effects of inflation out of GDP to reveal the growth rate of our economic well-being?
solutions05
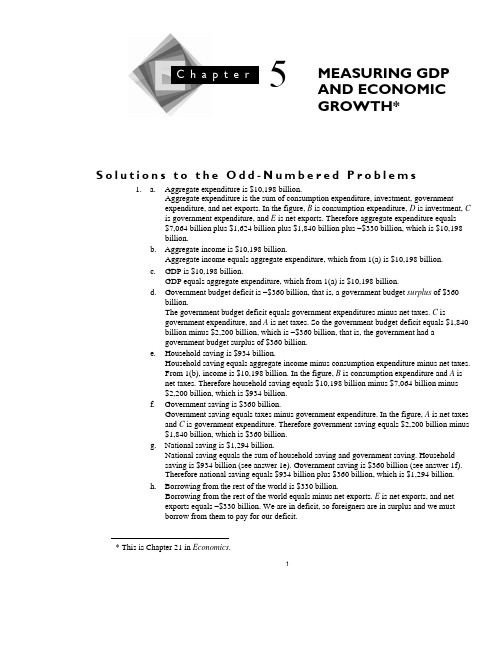
15 MEASURING GDP AND ECONOMIC GROWTH* * This is Chapter 21 in Economics .S o l u t i o n s t o t h e O d d -N u m b e r e d P r o b l e m s1. a. Aggregate expenditure is $10,198 billion.Aggregate expenditure is the sum of consumption expenditure, investment, governmentexpenditure, and net exports. In the figure, B is consumption expenditure, D is investment, C is government expenditure, and E is net exports. Therefore aggregate expenditure equals$7,064 billion plus $1,624 billion plus $1,840 billion plus −$330 billion, which is $10,198 billion.b. Aggregate income is $10,198 billion.Aggregate income equals aggregate expenditure, which from 1(a) is $10,198 billion.c. GDP is $10,198 billion.GDP equals aggregate expenditure, which from 1(a) is $10,198 billion.d. Government budget deficit is −$360 billion, that is, a government budget surplus of $360billion.The government budget deficit equals government expenditures minus net taxes. C isgovernment expenditure, and A is net taxes. So the government budget deficit equals $1,840 billion minus $2,200 billion, which is −$360 billion, that is, the government had agovernment budget surplus of $360 billion.e. Household saving is $934 billion.Household saving equals aggregate income minus consumption expenditure minus net taxes. From 1(b), income is $10,198 billion. In the figure, B is consumption expenditure and A is net taxes. Therefore household saving equals $10,198 billion minus $7,064 billion minus$2,200 billion, which is $934 billion.f. Government saving is $360 billion.Government saving equals taxes minus government expenditure. In the figure, A is net taxes and C is government expenditure. Therefore government saving equals $2,200 billion minus $1,840 billion, which is $360 billion.g. National saving is $1,294 billion.National saving equals the sum of household saving and government saving. Householdsaving is $934 billion (see answer 1e). Government saving is $360 billion (see answer 1f). Therefore national saving equals $934 billion plus $360 billion, which is $1,294 billion.h. Borrowing from the rest of the world is $330 billion.Borrowing from the rest of the world equals minus net exports. E is net exports, and netexports equals −$330 billion. We are in deficit, so foreigners are in surplus and we must borrow from them to pay for our deficit. C h a p t e r3. Martha’s initial capital stock is 10 copiers, depreciation is 1 copier per year, gross investment is 5copiers, net investment is 4 copiers, and the final capital stock is 14 copiers. Final capital stockequals initial capital stock plus net investment. Net investment equals gross investment minusdepreciation.5. a. Ecoland’s GDP is $1,100,000.GDP equals the sum of consumption expenditure plus investment plus governmentexpenditure plus exports minus imports. That is, GDP equals $600,000 plus $250,000 plus$200,000 plus $300,000 minus $250,000. GDP equals $1,100,000.b. Expenditure approach. The income approach cannot be used because there are no data oninterest, rent, depreciation, and indirect taxes and subsidies.c. Investment is financed by private saving plus government saving plus borrowing from therest of the world.Private saving equals GDP minus consumption expenditure minus net taxes. Net taxes equaltaxes ($250,000) minus transfer payments ($50,000), which is $200,000. So private saving is$300,000. Government saving equals the budget surplus, which equals net taxes minusgovernment expenditure. Government saving equals net taxes ($200,000) minus governmentexpenditure ($200,000), which is zero. Private saving exceeds investment by $50,000 andthis amount is lent to the rest of the world.7. a. The growth rate of real GDP in 2006 is 6.79 percent.The chain-weighted output index method uses the prices of 2005 and 2006 to calculate thegrowth rate in 2006.The value of the 2005 quantities at 2005 prices is $7,000. The value of the 2006 quantities at2005 prices is $7,450. We now compare these values. The increase in the value is $450. Thepercentage increase is ($450 ÷ $7,000) × 100, which is 6.43 percentThe value of the 2005 quantities at 2006 prices is $7,000. The value of the 2006 quantities at2006 prices is $7,500. We now compare these values. The increase in the value is $500. Thepercentage increase is ($500 ÷ $7,000) × 100, which is 7.14 percent.The chain-weighted output index calculates the growth rate as the average of these twopercentage growth rates. That is, the growth rate in 2006 is 6.79 percentb. The GDP deflator in 2006 is 100.33.GDP deflator equals nominal GDP in 2006 divided by real GDP in 2006, multiplied by 100.Real GDP in 2006 is 6.79 percent higher than real GDP in 2005. Real GDP in 2005 is$7,000, so real GDP in 2006 is $7,475.3.GDP deflator equals ($7,500 ÷ $7,475.3) × 100 = 100.33.c. Real GDP in 2006 using the base-year prices method is $7,450. Real GDP in 2006 using thechain-weighted output index method is $7,475.3. The base-year prices method measure realGDP growth as being slower than the chain-weighted index measure.2。
1002-ch11曼昆 宏观经济学
1
price price of of beef chicken
2004
2005 2006
$4
$5 $9
$4
$5 $6
The CPI basket cost $120 in 2004, the base year.
B. What was the inflation rate from 2005-2006?
In the previous chapter, we introduced the GDP deflator as a measure of the price level. It is the broadest measure of price level, as it include the price of every final g&s. However, for some purposes, we want a narrower measure…
The Consumer Price Index (CPI)
Data
USA: Bureau of the Census (BLS)
/
HK: Census & Statistics Department
.hk/home/index.jsp
11
Housing
ECON1002 C/D (2011) Chapter 11: MEASURING THE COST OF LIVING
© 2009 South-Western Principles of Macroeconomics, by N. G. Mankiw.
What’s in the HK CPI’s Basket?
Over time, some prices rise faster than others.
Managerial EconomicsChapter 2
Chapter 2Student: ___________________________________________________________________________1. If the price of a complement decreases, all else equal,A. Quantity demanded will decrease.B. Quantity supplied will decrease.C. Demand will increase.D. Demand will decrease.E. Supply will increase.2. The market demand curve for a given good shifts when there is a change in any of the following factors EXCEPTA. The price of the good.B. The level of consumers' income.C. The prices of goods related in consumption.D. The tastes of consumers.3. Which of the following would lead to a DECREASE in the demand for tennis balls?A. An increase in the price of tennis balls.B. A decrease in the price of tennis rackets.C. An increase in the cost of producing tennis balls.D. A decrease in average household income when tennis balls are a normal good.E. None of the above.4. If input prices increase, all else equal,A. Quantity supplied will decrease.B. Supply will increase.C. Supply will decrease.D. Demand will decrease.5. Which of the following would increase the supply of corn?A. An increase in the price of pesticides.B. A decrease in the demand for corn.C. A fall in the price of corn.D. A severe drought in the corn belt.E. A decrease in the price of wheat.6. Which of the following will cause a change in quantity supplied?A. A change in input prices.B. Technological change.C. A change in the number of firms in the market.D. A change in the market price of the good.Use the following general linear demand relation to answer questions 9 through 13:where M is income and is the price of a related good, R.7. From this relation it is apparent that the good is:A. An inferior good.B. A substitute for good R.C. A normal good.D. A complement for good R.E. Both c and d.8. If M = $15,000 and = $20, the demand function isA. .B. .C. .D. .E. .9. If M = $15,000 and = $20 and the supply function is , equilibrium price and quantity are, respectively,A. P = $55 and Q = 195.B. P = $6 and Q = 38.C. P = $12 and Q = 200.D. P = $50 and Q = 170.E. P = $40 and Q = 250.10. If M = $15,000 and = $20 and the supply function is , then, when the price of the good is $60,A. There is a shortage of 60 units of the good.B. There is equilibrium in the market.C. There is a surplus of 60 units of the good.D. The quantities demanded and supplied are indeterminate.11. If M = $15,000 and = $20 and the supply function is , then, when the price of the good is $40,A. There is equilibrium in the market.B. There is a shortage of 180 units of the good.C. There is a surplus of 180 units of the good.D. There is a shortage of 80 units of the good.Questions 12 – 14 refer to the following figure:12. If price is $16 there isA. A shortage of 250 units.B. A surplus of 250 units.C. A shortage of 125 units.D. A surplus of 125 units.E. Equilibrium in the market.13. If the price is $6, the resultingA. Surplus will lead to a fall in price.B. Shortage will lead to a fall in price.C. Surplus will lead to a rise in price.D. Shortage will lead to a rise in price.14. If price is $8,A. There will be a surplus of 150 units.B. There will be a shortage of 150 units.C. Price will fall.D. Shortage of 75 units.E. Surplus of 75 units.15. So long as the actual market price exceeds the equilibrium market price, there will beA. Downward pressure on the price.B. Upward pressure on the price.C. Excess demand.D. A shortage.16. Increases in the wage rates of coal miners and decreases in the price of natural gas would cause the price of coal toA. Rise, fall, or remain unchanged depending on the magnitude of the changes, but the equilibrium quantity of coal would fall.B. Rise, fall, or remain unchanged depending on the magnitude of the changes, but the equilibrium quantity of coal would increase.C. Rise, but the equilibrium quantity of coal would rise or fall depending on the magnitude of the changes.D. Rise, but the equilibrium quantity of coal would fall.E. Fall, but the equilibrium quantity of coal would rise or fall depending on the magnitude of the changes.Use the following figure to answer the next 4 questions:17. In the figure, the equilibrium price and quantity areA. P = $6 and Q = 800.B. P = $4 and Q = 300.C. P = $4 and Q = 400.D. P = $6 and Q = 300.E. P = $7 and Q = 800.18. Let demand remain constant at D; an increase in wages causes firms to be willing and able to sell 150 fewer units at each price than they were before the wage increase.A. The new equilibrium price and quantity will be P = $6 and Q = 150.B. The new equilibrium price and quantity will be P = $6 and Q = 400.C. The new equilibrium price and quantity will be P = $7 and Q = 250.D. The new equilibrium price and quantity will be P = $8 and Q = 300.19. Let supply remain constant at S; a decrease in income causes consumers to be willing and able to purchase 150 fewer units at each price than they were previously.A. The new equilibrium price and quantity will be P = $6 and Q = 150.B. The new equilibrium price and quantity will be P = $5 and Q = 150.C. The new equilibrium price and quantity will be P = $7 and Q = 250.D. The new equilibrium price and quantity will be P = $5 and Q = 200.20. Let supply remain constant at S; an increase in the price of a substitute good causes consumers to be willing and able to buy 150 more units of the good at each price in the list than they were when demand was D. Which of the following statements is (are) true?A. At the original equilibrium price there will be a shortage of 150.B. At the original equilibrium price there will be a surplus of 150.C. At the new equilibrium P = $6 and Q = 450.D. At the new equilibrium P = $7 and Q = 400.E. Both a and d.Use the following demand and supply functions to answer the next three questions.Demand: .Supply: .21. Equilibrium price and output areA. P = $7 and Q = 480.B. P = $10 and Q = 300.C. P = $20 and Q = 150.D. P = $100 and Q = 5,300.E. None of the above.22. If the price is currently $11, there is aA. Surplus of 110 units.B. Shortage of 240 units.C. Surplus of 350 units.D. Shortage of 700 units.E. None of the above.23. Let supply remain constant; an increase in income causes consumers to be willing and able to buy 220 more units at each price than they were previously. The new equilibrium price and quantity areA. P = $10 and Q = 520.B. P = $12 and Q = 400.C. P = $10 and Q = 80.D. P = $15 and Q = 600.E. None of the above.Use the following general linear demand relation to answer questions 36 through 41:where P is the price of good X, M is income, and is the price of a related good, R.24. Income is $80,000, and the price of the related good is $40. Also let consumers' tastes change so that consumers now demand 100 more units at each price. When the price of the good is $50, how many units of the good are demanded?A. 70.B. 200.C. 220.D. 100.E. None of the above.25. If a demand curve goes through the point P = $6 and = 400, thenA. $6 is the highest price consumers will pay for 400 units.B. $6 is the lowest price consumers can be charged to induce them to buy 400 units.C. 400 units are the most consumers will buy if price is $6.D. Consumers will buy more than 400 if price is $6.E. Both a and c.26. If a supply curve goes through the point P = $10 and = 320, thenA. $10 is the highest price that will induce firms to supply 320 units.B. $10 is the lowest price that will induce firms to supply 320 units.C. At a price higher than $10 there will be a surplus.D. At a price lower than $10 there will be a shortage.E. Both c and d.27. In the general demand function, when a good is a normal good, the sign on the slope parameter of____________ is _____________ (positive, negative, zero).28. In the general demand function, if goods X and R are substitutes, the sign on the slope parameter of the______________ good is ______________ (positive, negative, zero).29. The demand function slopes ______________ because of the law of _____________ which states that, other things equal, price and quantity demanded are ______________ related.30. If income increases, the demand for a(n) ______________ good will decrease.31. The general demand function for good A iswhere = quantity demanded of good A per month, P = the price of good A, M = average household income, = price of related good B, = a consumer taste index, P e = price consumers expect to pay next month for good A, and N = number of buyers in market for good.a. Good A is a(n) ___________ good because the slope parameter on __________ is _________.b. Goods A and B are ________________ because the slope parameter on ________ is _____________.c. When P = $6, M = $40,000, = $20, = 8, P e = $2, and N = 10,000, quantity demanded of good A is ____________ units per month.Chapter 2 Key1. If the price of a complement decreases, all else equal,a. Quantity demanded will decrease.b. Quantity supplied will decrease.C. Demand will increase.d. Demand will decrease.e. Supply will increase.Thomas - Chapter 02 #12. The market demand curve for a given good shifts when there is a change in any of the following factors EXCEPTA. The price of the good.b. The level of consumers' income.c. The prices of goods related in consumption.d. The tastes of consumers.Thomas - Chapter 02 #23. Which of the following would lead to a DECREASE in the demand for tennis balls?a. An increase in the price of tennis balls.b. A decrease in the price of tennis rackets.c. An increase in the cost of producing tennis balls.D. A decrease in average household income when tennis balls are a normal good.e. None of the above.Thomas - Chapter 02 #34. If input prices increase, all else equal,a. Quantity supplied will decrease.b. Supply will increase.C. Supply will decrease.d. Demand will decrease.Thomas - Chapter 02 #45. Which of the following would increase the supply of corn?a. An increase in the price of pesticides.b. A decrease in the demand for corn.c. A fall in the price of corn.d. A severe drought in the corn belt.E. A decrease in the price of wheat.Thomas - Chapter 02 #56. Which of the following will cause a change in quantity supplied?a. A change in input prices.b. Technological change.c. A change in the number of firms in the market.D. A change in the market price of the good.Thomas - Chapter 02 #7Use the following general linear demand relation to answer questions 9 through 13:where M is income and is the price of a related good, R.Thomas - Chapter 027. From this relation it is apparent that the good is:a. An inferior good.b. A substitute for good R.c. A normal good.d. A complement for good R.E. Both c and d.Thomas - Chapter 02 #98. If M = $15,000 and = $20, the demand function isa. .B. .c. .d. .e. .Thomas - Chapter 02 #109. If M = $15,000 and = $20 and the supply function is , equilibrium price and quantity are, respectively,A. P = $55 and Q = 195.b. P = $6 and Q = 38.c. P = $12 and Q = 200.d. P = $50 and Q = 170.e. P = $40 and Q = 250.Thomas - Chapter 02 #1110. If M = $15,000 and = $20 and the supply function is , then, when the price of the good is $60,a. There is a shortage of 60 units of the good.b. There is equilibrium in the market.C. There is a surplus of 60 units of the good.d. The quantities demanded and supplied are indeterminate.Thomas - Chapter 02 #1211. If M = $15,000 and = $20 and the supply function is , then, when the price of the good is $40,a. There is equilibrium in the market.B. There is a shortage of 180 units of the good.c. There is a surplus of 180 units of the good.d. There is a shortage of 80 units of the good.Thomas - Chapter 02 #13Questions 17 – 19 refer to the following figure:Thomas - Chapter 0212. If price is $16 there isa. A shortage of 250 units.B. A surplus of 250 units.c. A shortage of 125 units.d. A surplus of 125 units.e. Equilibrium in the market.Thomas - Chapter 02 #1713. If the price is $6, the resultingA. Surplus will lead to a fall in price.b. Shortage will lead to a fall in price.c. Surplus will lead to a rise in price.d. Shortage will lead to a rise in price.Thomas - Chapter 02 #1814. If price is $8,a. There will be a surplus of 150 units.B. There will be a shortage of 150 units.c. Price will fall.d. Shortage of 75 units.e. Surplus of 75 units.Thomas - Chapter 02 #1915. So long as the actual market price exceeds the equilibrium market price, there will beA. Downward pressure on the price.b. Upward pressure on the price.c. Excess demand.d. A shortage.Thomas - Chapter 02 #2316. Increases in the wage rates of coal miners and decreases in the price of natural gas would cause the price of coal toA. Rise, fall, or remain unchanged depending on the magnitude of the changes, but the equilibrium quantity of coal would fall.b. Rise, fall, or remain unchanged depending on the magnitude of the changes, but the equilibrium quantity of coal would increase.c. Rise, but the equilibrium quantity of coal would rise or fall depending on the magnitude of the changes.d. Rise, but the equilibrium quantity of coal would fall.e. Fall, but the equilibrium quantity of coal would rise or fall depending on the magnitude of the changes. Thomas - Chapter 02 #25Use the following figure to answer the next 4 questions:Thomas - Chapter 0217. In the figure, the equilibrium price and quantity area. P = $6 and Q = 800.b. P = $4 and Q = 300.c. P = $4 and Q = 400.D. P = $6 and Q = 300.e. P = $7 and Q = 800.Thomas - Chapter 02 #2618. Let demand remain constant at D; an increase in wages causes firms to be willing and able to sell 150 fewer units at each price than they were before the wage increase.a. The new equilibrium price and quantity will be P = $6 and Q = 150.b. The new equilibrium price and quantity will be P = $6 and Q = 400.C. The new equilibrium price and quantity will be P = $7 and Q = 250.d. The new equilibrium price and quantity will be P = $8 and Q = 300.Thomas - Chapter 02 #2719. Let supply remain constant at S; a decrease in income causes consumers to be willing and able to purchase 150 fewer units at each price than they were previously.a. The new equilibrium price and quantity will be P = $6 and Q = 150.b. The new equilibrium price and quantity will be P = $5 and Q = 150.c. The new equilibrium price and quantity will be P = $7 and Q = 250.D. The new equilibrium price and quantity will be P = $5 and Q = 200.Thomas - Chapter 02 #2820. Let supply remain constant at S; an increase in the price of a substitute good causes consumers to be willing and able to buy 150 more units of the good at each price in the list than they were when demand was D. Which of the following statements is (are) true?a. At the original equilibrium price there will be a shortage of 150.b. At the original equilibrium price there will be a surplus of 150.c. At the new equilibrium P = $6 and Q = 450.d. At the new equilibrium P = $7 and Q = 400.E. Both a and d.Thomas - Chapter 02 #29Use the following demand and supply functions to answer the next three questions.Demand: .Supply: .Thomas - Chapter 0221. Equilibrium price and output area. P = $7 and Q = 480.B. P = $10 and Q = 300.c. P = $20 and Q = 150.d. P = $100 and Q = 5,300.e. None of the above.Thomas - Chapter 02 #3022. If the price is currently $11, there is aA. Surplus of 110 units.b. Shortage of 240 units.c. Surplus of 350 units.d. Shortage of 700 units.e. None of the above.Thomas - Chapter 02 #3123. Let supply remain constant; an increase in income causes consumers to be willing and able to buy 220 more units at each price than they were previously. The new equilibrium price and quantity area. P = $10 and Q = 520.B. P = $12 and Q = 400.c. P = $10 and Q = 80.d. P = $15 and Q = 600.e. None of the above.Thomas - Chapter 02 #32Use the following general linear demand relation to answer questions 36 through 41:where P is the price of good X, M is income, and is the price of a related good, R.Thomas - Chapter 0224. Income is $80,000, and the price of the related good is $40. Also let consumers' tastes change so that consumers now demand 100 more units at each price. When the price of the good is $50, how many units of the good are demanded?A. 70.b. 200.c. 220.d. 100.e. None of the above.Thomas - Chapter 02 #4125. If a demand curve goes through the point P = $6 and = 400, thena. $6 is the highest price consumers will pay for 400 units.b. $6 is the lowest price consumers can be charged to induce them to buy 400 units.c. 400 units are the most consumers will buy if price is $6.d. Consumers will buy more than 400 if price is $6.E. Both a and c.Thomas - Chapter 02 #4226. If a supply curve goes through the point P = $10 and = 320, thena. $10 is the highest price that will induce firms to supply 320 units.B. $10 is the lowest price that will induce firms to supply 320 units.c. At a price higher than $10 there will be a surplus.d. At a price lower than $10 there will be a shortage.e. Both c and d.Thomas - Chapter 02 #4327. In the general demand function, when a good is a normal good, the sign on the slope parameter of____________ is _____________ (positive, negative, zero).income; positive.Thomas - Chapter 02 #6128. In the general demand function, if goods X and R are substitutes, the sign on the slope parameter of the ______________ good is ______________ (positive, negative, zero).related; positive.Thomas - Chapter 02 #6229. The demand function slopes ______________ because of the law of _____________ which states that, other things equal, price and quantity demanded are ______________ related.downward; demand; inversely.Thomas - Chapter 02 #6330. If income increases, the demand for a(n) ______________ good will decrease.inferior.Thomas - Chapter 02 #6431. The general demand function for good A iswhere = quantity demanded of good A per month, P = the price of good A, M = average household income, = price of related good B, = a consumer taste index, P e = price consumers expect to pay next month for good A, and N = number of buyers in market for good.a. Good A is a(n) ___________ good because the slope parameter on __________ is _________.b. Goods A and B are ________________ because the slope parameter on ________ is _____________.c. When P = $6, M = $40,000, = $20, = 8, P e = $2, and N = 10,000, quantity demanded of good A is ____________ units per month.a. normal; M; positive.b. complements; P B; negative.c. 51,000.Thomas - Chapter 02 #75Chapter 2 SummaryCategory # of Questions Thomas - Chapter 02 36。
Measuring and Managing Economic Exposure49425345
0109
201306130907
24
豐田汽車公司 1/3
日本最大的汽車公司 一半公上的產品是外銷,主要銷往美國 如果日圓升值:
日圓收入將減少
如果豐田汽車維持日圓價格不變,則它的汽車出口 價格將上升且銷售量將減少 如豐田汽車決定維持美國的市場佔有率,它必須維 持美元價格不變。
0109
201306130907
15
If HC Appreciates
Pricing Flexibility is key
0109
201306130907
16
If HC Appreciates
Can the firm maintain its profit margins both at home and abroad? If price elasticity of demand is low, the more price flexibility a firm has. i.e. Availability of good substitutes
0109 201306130907 18
If HC Appreciates
The Ability to Shift Production and to source inputs from other countries e.g. Japanese car makers in the late 1980’s
0109
201306130907
27
PART II.MANAGING OPERATING EXPOSURE
I. INTRODUCTION Operating exposure management requires long-term operating adjustments and the involvement of all departments.
Ch10 Measuring a Nation's Income
• Exchange Rate Determination
– The role of changing exchange rates is at the center of international economics.
Copyright © 2003 Pearson Education, Inc. Slide 1-10
– Many people are skeptical about importing goods that a country could produce for itself. – When countries sell goods to one another, all countries benefit. – Trade and income distribution
• For example, in 1998 both China and South Korea ran trade surpluses of about $40 billion each.
– Is it good to run a trade surplus and bad to run a trade deficit?
Slide 1-7
What is International Economics About?
• The Pattern of Trade (who sells what to whom?)
– Climate and resources determine the trade pattern of several goods. – In manufacturing and services the pattern of trade is more subtle. – There are two types of trade:
Chapter 2 (EC)
3. Separation of Ownership and Control
- The Principal-Agent Problem - Corporate Control Mechanisms
4. Market Structure and Managerial Decision Making
Price taker, Price-setting firm, Market power Different market structures (Perfect competition, Monopoly, Monopolistic competition, Oligopoly) Globalization of markets
– Although economists emphasize the importance of price in purchasing decisions. – Many other factors?
Demand
• Variables that influence Qd ?
– Only six factors are considered, which are sufficiently important to be included in most studies of market: – Price of good or service (P) – Incomes of consumers (M)
• Inferior good
– A good or service for which an increase (decrease) in income causes consumers to demand less (more) of the good, holding all other variables in the generalized demand function constant.
Measuring and managing customer value[外文翻译]
标题:Measuring and managing customer value原文:Keywords: value, management , customer satisfaction , marketingAbstractCustomer value management (CVM) aims to improve the productivity of marketing activity, and the profitability of business by identifying the value of different customer segments and aligning marketing strategies, plans and resourcing accordingly. There are two complementary approaches to CVM. The first attempts to measure and evaluate the perceived value placed on goods/services by customers. This information is used as the basis of continuous review and improvement of those goods/ services. The second approach measures the value of specific customers,or customer segments, to the organization and uses this to tailor marketing activity. Addressed together these approaches ensure that both sides of a business relationship gain added value. This paper explains the concept of CVM and key issues in using it to drive more effective marketing activityIntroductionThere are two complementary approaches t o measuring and exploiting customer value. The first seeks to identify the value’’ per ceived by customers of the organ iz ation’s goods and/or services. Where such value is better’’ or higher’’than the perceived value of compe titors’ offer ings, the organization has the potential to succeed in the mark etplac e. However, where customers place a higher value on competi tors’offerings, the organization needs to take some action t o maintain competi tiveness.The second approach is to measure the value that a customer (or a category of customer) brings into the organization and use this as the basis of, for example, targeted marketing campaigns. This can work in two ways: using the knowledge of high valu e customers to offer them additional information or incentive to maintain their loyalty, or offering incentives to the low er value customers to try and move them into the high value category.Customer satisfactionSince we have (allegedly) been through a quality revolution’’,products and services delivered to customers should be of appropriate quality, and we should have satisfied customers. Of course, the issue is not quite so simple. Raising quality —assuming it is done at all —can simple raise expe ctation levels; the net result may be no change in satisfaction levels. And, if course, satisfaction is not only based on perceived quality even if we define that as widely as possible; it is influenced by other factors —especially price.Value can be defined simply as the ratio of perceived benefit to perceived cost.Any simplistic approach to custome r satisfaction measurement thatfails to recognize the concept of value is likely to fail. It can be useful to ask customers to expr ess their satisfaction and many organizations do theseusing simple questionnaires with equally simple scoring systems. However,the y tend to give a snapshot of the custome r perception, and using such simple data as the basis of any time series is too uns ophistic ated to use asthe basis of real, hard decision making. A recognition of this limitation hasgiven rise to the concepts of customer value’’(CV)and customer value manag ement’’ (CVM)If we are to use CVM strategically, the firs t task is to identify the strategically impo rtant product/markets within each business unit; these are naturally the products/markets that will be prioritized. The next task is to understand what is important to the custome r base within those produc t/market s.At the most basic level, CVM relies on enhanced measurement of customer satisfaction incorporating price and valu e factors. Thus, CVM measures not just satisfaction’’ with a product or service —i.e. the measure of quality’’—but also relates this satisfaction to the price paid to arrive at a measure of perceived valu e.It is necessary but not sufficient for effec tive CVM to measure the value perceptions of customers with our products/services; to gather a true picture, it is also necessary to measure the value perceptions of comp etitors’ customers toarrive at compara tive assessments of value within a given mark et.The customer value approach thus attempts to identify how people evaluate competi ng offerings —assuming that when they make their purchasing decisions, they do so wi th value’’as a key driver. This approach to value management also recognizes that it is essential in identifying the competitive value proposition’’ for a specific market segment, to examine the key non-price drivers of custome r value relative to price. Once those key value drivers are identified, customer perceptions of company performance on these drivers becomes the means by which all competitors can be plotted on a competi tive matrix to understand positioning within the produc t/market.This requires the determination of answers to three basic questio ns:(1) What are the key factors that custo mers value when they choose bet ween competing offerings in the marketplac e?(2) How is the organization’s performance rated on each factor relative to each of the main com petitors?(3) What is the relative importance or weighting assigned (presumabl y intuitively) by customers to each of the se components of customer value?It is then possible to construct a weighte d index of customer value for the company and its competitors and construct the competi tive m atrix.A breakdown of this analysis by customer type also allows the organization to assess the loyalty of the various parts of the custome r base —and the degree to which that part of the customer base is vulnerable to compe titive intrusion. The model can be further exten ded to assess and include quality metrics to complete the assessment of product attribut es and their effect on customer satisfac tion.This stage of analysis aims to arrive at a shared understanding and agreement on the key product, service and price purcha se criteria that influence custome rs’ purc hasin g and loyalty decisions. The next stage is to work towards an action plan to move forward and improve, since this assessment of the nature of the competitive position within the marketplace can then lead to a re-focusing of marketing campaigns, a better unders tanding of the potential of particularacquisitions, and even re-prioritizing of capital invest ment. Thus CVM becomes the heart of organizational strategy, using this improved understanding of customer satisfaction to maximize the value delivered to target markets, to gain strategic advantage and to enhance profitabi lity.Much of the customer-related informat ion may arise as a result of questionnaires and surveys. Obviously, if we are to use the results to drive strategic decision making, these must be well designed (with outside, expert help) and systematically issued and analyzed. It is obviously important to prioritize customers in key markets —either because they are growing or shrinking, where the potential for gain is highest. It is useful to maintain a core set of questions —to ensure some comparison over time —but the inclusion of new, fresh questions also helps to keep the attention of those completing the surve y.To monitor and manage the surve y/fieldwork quality effectively (especially when undertaken by an external agency), it is important to consider the methodology and the quality standards that will be adopted (including the procedures for eliminating/ minimizing sampling and non-non-sampling errors).Since we wish to repeat the data coll ection at regular intervals, it is of course important t o recognize that customers (and especial ly potential customers) may resen t questionnaires presented at frequent int ervals. This can be prevented by using different samples from the same constituent groups. Since questionnaires and surveys are often best carried out in tandem with less structured ways of gathering information, a focus group’’approach can be used both to collect data and to reward contributors for their participation —perhaps simply by givin g them a good dinner.Data miningThe alternative approach to customer value —that of identifying high value customers or customer categories—requires a n organization to evaluate collected data on past transactions to identify such customers. For large organizations, with a large customer base, this probably needs a data warehouse/ data mining approach —as the basis of database m arketing.A data warehouse is simply a repository for relevant business data. While tradi tional databases primarily store current operatio nal data, data warehouses consolidate data from multiple operational and external sources in order to attain an accurate, consolidated view of customers and the b usiness.Database marketing involves, first, the identification of market segments contai ning customers or prospects with high profit potential and, second, the building and execution of marketing campaigns that favorably impact the behavior of these individuals.The first task —that of identifyin g appropriate market segments —requ ires significant data about prospective custo mers and their buying behaviors. In theory, more data is the basis of better knowledge. In practice, however, very large data stores make analysis and understanding very diffi cult. This is where data mining software comes in. Data mining software automates the pro cess of searching large volumes of data (us ing standard statistical techniques as well as advanced technologies such as decision tre es and even neural networks) to find patterns that are good predictors of —in this case —purchasing behavio rs.Data mining, by its simplest definition, automates the detection of relevant patte rns in a database. For example, a pattern might indicate that married males with children are twice as likely to drive a particular sports car as married males with no children. If you are a marketing manager for a car (or car supp lies/ accessories) manufacturer, this somewhat surprising pattern could be very valua ble.However, data mining is not magic, nor is it a new phenomenon. For many years, statisticians have manually mined d atabases looking for statistically significant patterns. Today, the process is automated. Data m ining uses well-established statistical and m achine learning techniques to build models tha t predict customer behavior. The te chnolo gy enhances the procedure by automating the mining process, integrating it wi th comme rcial data warehouses, and pres enting it in a relevant way for business use rs.The leading data mining products, such as those from companies like SAS andIBM, are now significantly more than just mod eling engines employing powerful algorithms. The y now address broader business and techn ical issues, such as their integration into compl ex information technology envi ronments.If the appropriate source information exists in a data warehouse, data mining can extra ct it and use it to model customer activity. The aim is to identify patterns relevant to current business problems. Typical questions that data mining could be used to answer are :•Which of our customers are most likely to terminate their cell-phone contract?•What is the probability that a customer will purchase multiple items from our catalogue if we offer some form of incenti ve?•Which potential customers are most likely to respond to a particular free g ift promotio n?Answers to these questions can help ret ain customers and increase campaign response rates, which, in turn, increase buying, cross- selling and return on inve stment.The hype around data mining, when it was first advanced as a commercial software proposition, suggested that it would el iminate the need for statistical analysts to build predictive models. As ever, the hype failed to recognize reality. The value of such an analyst cannot be automated out of exist ence.Analysts are still needed to assess m odel results and validate the reasonability’’ of the model predictions; the effectiveness of the entire procedure is dependent on the quali ty of the predictive model, itself dependent on the quality of data collected. The compl exity of the model created typically depends on a number of factors, such as database size, the number of variables known about each customer, the kind of data mining algorit hms used (a variable of the software adopted) an d the modeler’s experience. Since data mining software lacks the human experience and intuition to recognize the difference between a relevant and an irrelevant correlation, statist ical analysts remain in high demand.Data mining helps marketing profes sionals improve their understanding of the behav ior of their customers and potential customers. This, in turn, allows them to target m arketing campaigns more accurately and to align campaigns more closely with the needs, wants and attitudes of customers and prospects.The behavioral models within the so ftware are normally very simple. The pred iction provided by a model is usually called a score. A score (typically a numerical value) is assigned to each record in the database and indicates the likelihood that the custome r whose record has been scored will exhibit a particular behavior.After mining the data, the results are fed into campaign management software that manages the campaign directed at the def ined market segments. In this example, the numerical values that indicate likely attrition may be used to select the most appropriate prospects for a targeted marketing campaign.出处:George Evans: Measuring and managing customer value Work study V olume 51.Number 3.2002.pp.134-139标题:测量与管理客户价值译文:关键字:价值,管理,客户满意度,市场营销摘要客户价值管理(CVM)的目的是通过识别不同客户群的价值来提高营销活动的生产率和企业的赢利能力并调整营销战略,计划和配置相应的资源。
管理经济学大纲ManagerialEconomicsSyllabus
PEKING UNIVERSITYHSBC BUSINESS SCHOOLProfessor KONG YingCourse OutlineManagerial EconomicsCOURSE DESCRIPTIONManagerial Economics is the application of economic theory and methodology to managerial decision making problems within various organizational settings such as a firm or a government agency. The emphasis in this course will be on demand analysis and estimation, production and cost analysis under different market conditions, advanced topics in business strategy. Students taking this course are expected to have had some exposure to economics and be comfortable with basic algebra. Some knowledge of calculus would also be helpful.COURSE OBJECTIVEIn today's dynamic economic environment, effective managerial decision making requires timely and efficient use of information. The purpose of this course is to provide students with a basic understanding of the economic theory and analytical tools that can be used in decision making problems. Students who successfully complete the course will have a good understanding of economic concepts and tools that have direct managerial applications. The course will sharpen their analytical skills through integrating their knowledge of the economic theory with decision making techniques. Students will learn to use economic models to isolate the relevant elements of a managerial problem, identify their relationships, and formulate them into a managerial model to which decision making tools can be applied. Among the topics covered in the course are: price determination in alternative market structures, demand theory, production and cost functions, and business strategy. In addition, the course will provide a basic introduction to econometric analysis and its role in managerial decision making.TEXBOOKS AND CLASS NOTESThe main textbook is Managerial Economics and Business Strategy, 7th ed. by Michael Baye, McGraw HillClass notes (PPT) and other materials will be posted online for students download.COURSE EVELUATIONMidterm Exam: 30%Final Exam: 50% Consulting Projects: 20%SYLLABUSAll chapters listed below refer to the Baye textbook unless otherwise indicated. You are responsible for materials in the Baye text that correspond to the material covered in class. The Baye text should be viewed as a learning aide, NOT as an independent source of examinable material. However, doing questions end of each chapters will greatly help you to prepare exams.Week 1The Fundamentals of Managerial Economics Ch 1Market Forces: Demand and Supply Ch 2Week 2Quantitative Demand Analysis Ch 3The Theory of Individual Behavior Ch 4Week 3The Production Process and Costs Ch 5Week 4The Organization of the Firm Ch 6The Nature of Industry Ch 7Week 5Midterm ExamManaging in Competitive, Monopolistic,Monopolistically Competitive Market Ch 8Week 6Basic Oligopoly Models Ch 9Game Theory: Inside Oligopoly Ch 10Week 7Pricing Strategies for Firms with Market Power Ch 11Week 8The Economics of Information Ch 12Advanced Topics in Business Strategy Ch 13Week 9A Manager’s Guide to Government in the Marketplace Ch 14Project Presentation and Hand InFinal Exam (TBD)CONSULTING PROJECTSIn order to help students to build up the managerial economics analysis skill we provide 4 real world consulting projects in the course. Students are required to independently conduct 4 consulting reports regarding to the 4 projects. The exercises require you to apply some of the tools you learned in each chapter covered in the class to make a recommendation based on an actual business scenario. The topics of 4 consulting projects are,·Estimating Industry Demand for Fresh Market Carrots·Estimation and Analysis of Demand for Fast Food Meals·Production Decisions at Harding Silicon Enterprises, Inc.·Pricing and Production Decisions at PoolVac, Inc.Cheating, Plagiarism and Free RiderThe penalties for any form of cheating or plagiarism (whether in exams or project) are severe. Written work submitted must be your own. Any sources of information used in completing your work must be identified. Plagiarized written work will not be accepted and you should be aware that non acceptance of a submission might, in some cases, lead to failure in the course. Since the project is a team work, the final report should identify each student’s contribution. The significant uneven contribution in the work will lead to less mark for the student who made less contribution comparing to his/her team member.。
- 1、下载文档前请自行甄别文档内容的完整性,平台不提供额外的编辑、内容补充、找答案等附加服务。
- 2、"仅部分预览"的文档,不可在线预览部分如存在完整性等问题,可反馈申请退款(可完整预览的文档不适用该条件!)。
- 3、如文档侵犯您的权益,请联系客服反馈,我们会尽快为您处理(人工客服工作时间:9:00-18:30)。
u =
AN OPERATIONAL MEASURE OF EXCHANGE RISK
1. Output measures: a. Beta coefficient () measures the association of changes in cash flows to exchange rate changes.
21
AN OPERATIONAL MEASURE OF EXCHANGE RISK
VI. SUMMARY: A. The focus of the accounting profession on the balance sheet impact of currency changes has led to ignoring the important impact on future cash flows.
3
PART I. FOREIGN EXCHANGE RISK AND ECONOMIC EXPOSURE
I. FOREIGN EXCHANGE RISK A. Economic exposure focuses on the impact of currency fluctuations on firm’s value. 1 . Expectations about the fluctuation must be incorporated in all basic decisions of the firm.
16
PART V. AN OPERATIONAL MEASURE OF EXCHANGE RISK
V. NEED FOR A WORKABLE APPROACH
A. Regression Analysis 1. Variables a. Independent: changes in parent’s cash flows b. Dependent: Average nominal exchange rate change. 17
Multinational Financial Management
Alan Shapiro 7th Edition J.Wiley & Sons
Power Points by Joseph F. Greco, Ph.D. California State University, Fullerton
23
AN OPERATIONAL MEASURE OF EXCHANGE RISK
C. To measure exposure properly, you must focus on inflation-adjusted or real exchange rates instead of nominal or actual exchange rates.
9
THE ECONOMIC CONSEQUENCES OF EXCHANGE RATE CHANGES
II. ECONOMIC CONSEQUENCES (con’t) B. Operating Exposure : real rate change 1. Pricing flexibility is key 2. Product differentiation 3. Substitution of inputs
14
IDENTIFYING ECONOMIC EXPOSURE
C. TOYOTA MOTOR COMPANY 1. Exchange rate risk affected BOTH revenues and costs. 2. Flow back effect: previously exported goods return with increased domestic competition. 3. Lower profit margins domestically
CFt a EXCHt ut
where CFt = EXCHt = CFt - CFt-1 and CFt is the dollar value of total affiliate(parent)cash flows in period t EXCHt - EXCHt-1 equals the average nominal exchange rate during period t a random error term
extent that variations in the dollar value of the unit’s cash flows are correlated with variations in the nominal exchange rate
18
AN OPERATIONAL MEASURE OF EXCHANGE RISK
15
PART IV. CALCULATING ECONOMIC EXPOSURE
IV. A quantitative assessment of economic exposure depends on underlying assumptions concerning: A. future cash flows; B. sensitivity to exchange rate changes.
11
PART III. IDENTIFYING ECONOMIC EXPOSURE
III. CASE STUDIES OF ECONOMIC EXPOSURE A. ASPEN SKIING COMPANY 1. Firm’s exchange rate risk affected its sales revenues.
12
IDENTIFYING ECONOMIC EXPOSURE
A. ASPEN SKIING COMPANY (con’t) 2. Although there was no translation
risk, the global market with its
exchange rate risk and its
8
PART II. THE ECONOMIC CONSEQUENCES OF EXCHANGE RATE CHANGES
II. ECONOMIC CONSEQUENCES A. Transaction exposure 1. On-balance sheet 2. Off-balance sheet
5
FOREIGN EXCHANGE RISK AND ECONOMIC EXPOSURE THE REAL EXCHANGE RATE
et' et (1 i f ) t (1 ih ) t
6
FOREIGN EXCHANGE RISK AND ECONOMIC EXPOSURE B. Real Exchange Rates and Risk 1. Nominal v. real exchange rates: the real rate has been adjusted for price changes.
1
CHAPTER 11
MEASURING AND MANAGING ECONOMIC EXPOSURE
2
CHAPTER OVERVIEW
I. FOREIGN EXCHANGE RISK AND ECONOMIC EXPOSURE II. THE ECONOMIC CONSEQUENCES OF EXCHANGE RATE CHANGES III. IDENTIFYING ECONOMIC EXPOSURE IV. CALCULATING ECONOMIC EXPOSURE V. AN OPERATIONAL MEASURE OF EXCHANGE RISK VI. MANAGING OPERATING EXPOSURE
20
AN OPERATIONAL MEASURE OF EXCHANGE RISK
b. the higher the percentage change of cash flow to changes in exchange rates, the greater the economic exposure (higher beta values).
10
THE ECONOMIC CONSEQUENCES OF EXCHANGE RATE CHANGES
II. SUMMARY The sector of the economy in which the firm operates; the sources of the firm’s inputs; and fluctuations in firm’s true economic exposure.
7
FOREIGN EXCHANGE RISK AND ECONOMIC EXPOSURE
3. SUMMARY a. the economic impact of a currency change depends on the offset by the difference in inflation rates or the real exchange rate. b. It is the relative price changes that ultimately determine a firm’s long-run exposure.
I. INTRODUCTION Operating exposure management requires long-term operating adjustments. A. Real v. Nominal Changes 1. Relative price changes leads to marketing and/or production revisions
4
FOREIGN EXCHANGE RISK AND ECONOMIC EXPOSURE 2. Definitions: a. Accounting exposure