污水处理外文翻译(带原文)
两篇印染废水处理的外文翻译
5 处理效果
该工程 2007 年 5 月竣工后,经试运行 3 个月,于 9 月正式投入正常运行, 从运行 1 年的情况来看,系统运行稳定、处理效果显著,出水水质良好。经环境 监测站在不同的时期测得出水水质各项指标均己达《污水综合排放标准》 (GB 8978-1996)一级排放标准,测得的部分结果如表 2 所示。
-1-
苏州科技学院本科毕业设计(外文翻译 1)
距采用 1 cm , 一天清理 2 次,以保证排水畅通。废水先经格栅去除大块杂物后, 自流入隔油池。 (2)调节池 钢混结构,尺寸 8 m ×6 m×2.5 m , 1 座,HRT 2.3 h。废水在调节池内一方 面利用气浮作用将油脂进一步除去,另一方面将废水充分混合,均匀水质水量。 (3)催化氧化池 内设组合式催化氧化装置 2 台,尺寸 6 m ×4 m×3 m ,处理能力为 25 m3 /h, 其关键装置是一个管式催化氧化单元。管径采用 200(根据情况可大可小)的不 锈钢管或 PVC 管,管内壁涂有光催化功能的 TiO2 涂层, 这种装置单位体积/ 表面 积大,1 m3 液体管内表面积达 20 m 2。管内沿管径轴向安装紫外灯管,废水进入 管中通过管道推流混合,不用搅拌装置。废水在管内流动与管内壁的 TiO2 涂层 接触,在其表面发生光催化氧化反应,同时 H2O2 在紫外光作用下也产生各种氧 化反应, 最终达到去除污染物的目的。 该设备适用范围广, 可改善废水可生化性; 操作简单,清洗方便,不会发生 结垢和有机物粘附现象;催化表面积大,催化 效率高;紫外光能利用充分,大大降低单位处理能耗。 (4)沉淀池 钢混结构,尺寸 5 m×5 m ×3 m, 2 座,HRT 3 h。 (5) ABR 池 2 座,钢混结构,尺寸 8 m×6.5 m × 4 m,HRT 10 h,池内放置大比表面积 的球状悬浮生物填料。废水经催化氧化处理去除部分有机物,改善废水可生化性 和脱色后,经排放到 pH 中和池加碱调到中性,再进入 ABR 池。 (6) MBR 池 2 座,钢混结构,尺寸 8 m× 6 m × 4 m , HRT 8 h ,流量为 12 m3/h 。 MBR 池为板框抽吸淹没式结构,膜组件为孔径约 0.2μm 的 PVDF 中空纤维膜。平常 通过周期性地间歇操作和通风来减少膜污染,每 6 个月进行一次化学清洗,用 0.1% 的 NaClO 和 4%的 NaOH 将膜组件浸泡 24 h 。 (7)中间水池 2 座,钢混结构,尺寸 6 m× 3.5 m ×4 m,HRT 8 h。 (8)回用水池 2 座,钢混结构,尺寸 6 m× 3.5 m ×4 m,HRT 8 h。 (9)污泥处理系统。 污泥池 2 座,钢混结构,尺寸 6 m ×4 m×3 m ,压滤机 2 台,污泥泵 4 台。 沉淀污泥排放到污泥池后,用污泥泵打入板框压滤机,经压滤后的干渣外运到固 废处理站处理,压滤出水回废水调节池。
污水处理工业废水回用中英文对照外文翻译文献
污水处理工业废水回用中英文对照外文翻译文献XXX and resource recovery in us industries。
and they are of significant XXX-catalysis has been well established for water recovery and reuse。
chemo-catalysis is only starting to make an XXX-catalytic processes for water reuse。
XXX。
XXX.2.Chemo-XXX reuseChemo-XXX。
including XXX。
One of the most promising ns of chemo-XXX。
XXX。
This process has been shown to be effective in removing COD (chemical oxygen demand) XXX.3.XXX COD removalXXX treatment。
The process involves the use of a XXX can be a metal oxide or a metal complex。
and the oxidizing agent can be hydrogen peroxide。
ozone。
or XXX mild ns。
and the process is XXX.4.XXXXXX (AOPs) such as XXX。
photo-Fenton n。
and electro-XXX include the use of anic frameworks (MOFs) XXX.5.nIn n。
chemo-catalytic processes。
XXX。
XXX。
such as AOPs。
MOFs。
and nanomaterials。
污水处理厂 外文文献

ENVIRONMENTAL BIOTECHNOLOGYOne-stage partial nitritation/anammox at15°Con pretreated sewage:feasibility demonstration at lab-scale Haydée De Clippeleir&Siegfried E.Vlaeminck&Fabian De Wilde&Katrien Daeninck&Mariela Mosquera&Pascal Boeckx&Willy Verstraete&Nico BoonReceived:26November2012/Revised:28January2013/Accepted:30January2013#Springer-Verlag Berlin Heidelberg2013Abstract Energy-positive sewage treatment can beachieved by implementation of oxygen-limited autotrophicnitrification/denitrification(OLAND)in the main water line,as the latter does not require organic carbon and thereforeallows maximum energy recovery through anaerobic diges-tion of organics.To test the feasibility of mainstreamOLAND,the effect of a gradual temperature decrease from29to15°C and a chemical oxygen demand(COD)/Nincrease from0to2was tested in an OLAND rotatingbiological contactor operating at55–60mg NH4+–NL−1 and a hydraulic retention time of1h.Moreover,the effectof the operational conditions and feeding strategies on thereactor cycle balances,including NO and N2O emissionswere studied in detail.This study showed for the first timethat total nitrogen removal rates of0.5g NL−1day−1can bemaintained when decreasing the temperature from29to15°Cand when low nitrogen concentration and moderate CODlevels are treated.Nitrite accumulation together with elevatedNO and N2O emissions(5%of N load)were needed to favoranammox compared with nitratation at low free ammonia(<0.25mg NL−1),low free nitrous acid(<0.9μg NL−1),and higher DO levels(3–4mg O2L−1).Although the total nitrogen removal rates showed potential,the accumulation of nitrite and nitrate resulted in lower nitrogen removal efficiencies (around40%),which should be improved in the future. Moreover,a balance should be found in the future between the increased NO and N2O emissions and a decreased energy consumption to justify OLAND mainstream treatment. Keywords Energyself-sufficient.Nitrospira.Nitricoxide. Nitrous oxide.DeammonificationIntroductionCurrently,around40full-scale one-stage partial nitrita-tion/anammox plants are implemented to treat highly loaded nitrogen streams devoid in carbon(Vlaeminck et al.2012). This process,known under the acronyms oxygen-limited autotrophic nitrification/denitrification(OLAND)(Kuai and Verstraete1998),deammonification(Wett2006),com-pletely autotrophic nitrogen removal over nitrite(Third et al. 2001),etc.,showed highly efficient and stable performance when treating digestates from sewage sludge treatment plants and industrial wastewaters(Wett2006;Abma et al. 2010;Jeanningros et al.2010).For clarity,one-stage partial nitritiation/anammox processes will be referred to as OLAND in this work.From an energy point of view,the implementation of the OLAND process for the treatment of sewage sludge digestate decreased the net energy consump-tion of a municipal wastewater treatment plant(WWTP)by 50%,with a combination of a lower aeration cost in the side stream and the opportunity to recover more organics from the mainstream(Siegrist et al.2008).Moreover,when co-digestion of kitchen waste was applied,an energyneutral Electronic supplementary material The online version of this article(doi:10.1007/s00253-013-4744-x)contains supplementary material,which is available to authorized users.H.De Clippeleir:S.E.Vlaeminck:F.De Wilde:K.Daeninck:M.Mosquera:W.Verstraete:N.Boon(*)Laboratory for Microbial Ecology and Technology(LabMET),Ghent University,Coupure Links653,9000Gent,Belgiume-mail:Nico.Boon@UGent.beP.BoeckxLaboratory of Applied Physical Chemistry(ISOFYS),Ghent University,Coupure Links653,9000Gent,BelgiumAppl Microbiol BiotechnolDOI10.1007/s00253-013-4744-xWWTP was achieved(Wett et al.2007).To fully recover the potential energy present in wastewater,a first idea of a new sustainable wastewater treatment concept was reported (Jetten et al.1997).Recently,a“ZeroWasteWater”concept was proposed which replaces the conventional activated sludge system by a highly loaded activated sludge step (A-step),bringing as much as organic carbon(chemical oxygen demand(COD))as possible to the solid fraction, and a second biological step(B-step)removing the residual nitrogen and COD with a minimal energy demand (Verstraete and Vlaeminck2011).Subsequently,energy is recovered via anaerobic digestion of the primary and sec-ondary sludge.For the B-step in the main line,OLAND would potentially be the best choice as this process can work at a low COD/N ratio,allowing maximum recovery of COD in the A-step.Moreover,it was calculated that if OLAND is implemented in the main water treatment line and a maximum COD recovery takes place in the A-step,a net energy gain of the WWTP of10Wh inhabitant equivalent (IE)−1day−1is feasible(De Clippeleir et al.2013).To allow this energy-positive sewage treatment,OLAND has to face some challenges compared with the treatment of highly loaded nitrogen streams(>250mg NL−1).A first difference is the lower nitrogen concentration to be removed by OLAND.Domestic wastewater after advanced concen-tration will still contain around30–100mg NL−1and113–300mg CODL−1(Metcalf and Eddy2003;Tchobanoglous et al.2003;Henze et al.2008).High nitrogen conversion rates(around400mg NL−1day−1)by the OLAND process can be obtained at nitrogen concentrations of30–60mg N L−1and at low hydraulic retention times(HRT)of1–2h(De Clippeleir et al.2011).A second challenge is the low tem-perature at which OLAND should be operated(10–15°C compared with34°C).Several studies already described the effect of temperature on the activity of the separate micro-bial groups(Dosta et al.2008;Guo et al.2010;Hendrickx et al.2012).Only a few studies showed the long-term effect of a temperature decrease below20°C on the microbial bal-ances of anoxic and aerobic ammonium-oxidizing bacteria (AnAOB and AerAOB)and nitrite-oxidizing bacteria (NOB)at nitrogen concentrations above100mg NL−1 (Vazquez-Padin et al.2011;Winkler et al.2011).However, the combination of low temperature and low nitrogen con-centration was never tested on a co-culture of AerAOB, AnAOB,and NOB before.At temperatures around15°C, maintaining the balance between NOB and AnAOB and the balance between NOB and AerAOB will get more challeng-ing since the growth rate of NOB will become higher than the growth rate of AerAOB(Hellinga et al.1998). Therefore,it will not be possible to wash out NOB based on overall or even selective sludge retention.The third and main challenge in this application will therefore be the suppression of NOB at temperature ranges of10–20°C and at nitrogen concentration ranges of30–60mg NL−1 (low free ammonia and low nitrous acid),which was not shown before.A final fourth challenge will include the higher input of organics at moderate levels of90–240mg biodegradable CODL−1in the wastewater.Depending on the raw sewage strength,COD/N ratios between2and3are expected after the concentration step,which is on the edge of the described limit for successful OLAND(Lackner et al. 2008).The presence of organics could result in an extra competition of heterotrophic denitrifiers with AerAOB for oxygen or with AnAOB for nitrite or organics,since certain AnAOB can denitrify consuming organic acids (Kartal et al.2007).In this study,the challenges2to4,were evaluated in an OLAND rotating biological contactor(RBC).This reactor at 29°C was gradually adapted over24,22,and17to15°C under synthetic wastewater conditions(60mg N L−1, COD/N of0).Additionally,the COD/N ratio of the influent was increased to2by supplementing NH4+to diluted sewage to simulate pretreated sewage.The effect of the operational conditions and feeding strategies on the reactor cycle balan-ces,including gas emissions and microbial activities were studied in detail.An alternative strategy to inhibit NOB activity and as a consequence increase AnAOB activity at low temperatures based on NO production was proposed. Materials and methodsOLAND RBCThe lab-scale RBC described by De Clippeleir et al.(2011) was further optimized at29°C by an increase in the influent nitrogen concentration from30to60mg NL−1and a limitation of the oxygen input through the atmosphere by covering the reactor before this test was started.The reactor was based on an air washer LW14(Venta,Weingarten, Germany)with a rotor consisting of40discs interspaced at 3mm,resulting in a disc contact surface of1.32m2.The reactor had a liquid volume of2.5L,immersing the discs for 55%.The latter was varied over the time of the experiment. The reactor was placed in a temperature-controlled room. The DO concentration was not directly controlled.In this work,continuous rotation was applied at a constant rotation speed of3rpm,which allowed mixing of the water phase. RBC operationThe RBC was fed with synthetic wastewater during phases I to VII.From phase VIII onwards,the COD/N was gradually increased(phases VIII–X)to2(phases XI–XIII).The syn-thetic influent of an OLAND RBC,consisted of(NH4)2SO4 (55–60mg NL−1),NaHCO3(16mg NaHCO3mg−1N),andAppl Microbiol BiotechnolKH2PO4(10mg PL−1).Pretreated sewage was simulated by diluting raw sewage of the communal WWTP of Gent, Belgium(Aquafin).The raw wastewater after storage at 4°C and settlement contained23–46mg NH4+–NL−1, 0.2–0.4mg NO2−–NL−1,0.4–2.7mg NO3−–NL−1,23–46mgKjeldahl–NL−1,3.8–3.9mg PO43−–PL-1,26–27mg SO42−–S L−1,141–303mg COD tot L−1,and74–145mg COD sol L−1.The raw sewage was diluted by factors2–3to obtain COD values around110mg COD tot L−1and by addition of(NH4)2SO4to obtain final COD/N values around2.The reactor was fed in a semi-continuous mode:two periods of around10min/h for phases I–XI and one period of20min/h for phases XII and XIII.The influent flow range varied from47to65Lday−1and the reactor volume from3.7to2.5L(during78and55% submersion,respectively).Corresponding HRTare displayed in Tables1and2.Reactor pH,DO,and temperature were daily monitored and influent and effluent samples were taken at least thrice a week for ammonium,nitrite,nitrate,and COD analyses. Detection of AerAOB,NOB,and AnAOB with FISHand qPCRFor NOB and AnAOB,a first genus screening among the most commonly present organisms was performed by fluo-rescent in-situ hybridization(FISH)on biomass of days1 (high temperature)and435(low temperature and COD presence).A paraformaldehyde(4%)solution was used for biofilm fixation,and FISH was performed according to Amann et al.(1990).The Sca1309and Amx820probes were used for the detection of Cand.Scalindua and Cand. Kuenenia&Brocadia,respectively,and the NIT3and Ntspa662probes and their competitors for Nitrobacter and Nitrospira,respectively(Loy et al.2003).This showed the absence of Nitrobacter and Scalindua(Table S1in the Electronic supplementary material(ESM)).Biomass sam-ples(approximately5g)for nucleic acid analysis were taken from the OLAND RBC at days1,60,174,202,306,385, 399,and413of the operation.DNA was extracted using FastDNA®SPIN Kit for Soil(MP Biomedicals,LLC), according to the manufacturer’s instructions.The obtained DNA was purified with the Wizard®DNA Clean-up System (Promega,USA)and its final concentration was measured spectrophotometrically using a NanoDrop ND-1000spec-trophotometer(Nanodrop Technologies).The SYBR Green assay(Power SyBr Green,Applied Biosystems)was used to quantify the16S rRNA of AnAOB and Nitrospira sp.and the functional amoA gene for AerAOB.The primers for quantitative polymerase chain reactions(qPCR)for detection of AerAOB,NOB,and AnAOB were amoA-1F–amoA-2R (Rotthauwe et al.1997),NSR1113f–NSR1264r(Dionisi et al. 2002),and Amx818f–Amx1066r(Tsushima et al.2007),re-spectively.For bacterial amoA gene,PCR conditions were: 40cycles of94°C for1min,55°C for1min,and60°C for 2min.For the amplification of Nitrospira sp.16S rRNA gene, 40cycles of95°C for1min,50°C for1min,and60°C for 1min were used while for AnAOB16S rRNA the PCR temperature program was performed by40cycles of15s at 94°C and1min at60°C.Plasmid DNAs carrying NitrospiraTable1Effect of temperature decrease on the operational conditions and performance of OLAND RBC reactorPhase I II III IV V VI VIIPeriod(days)1–2122–3536–6162–210210–263263–274275–306 Immersion level(%)78787878557855 Temperature(°C)29±224±122±0.617±1.216±0.915±0.814±0.4 Operational conditionsDO(mg O2L−1) 1.1±0.2 1.3±0.2 1.4±0.1 1.7±0.3 2.8±0.4 2.4±0.2 3.1±0.2 pH(−)7.5±0.17.5±0.17.5±0.17.6±0.17.7±0.17.7±0.17.8±0.1 HRT(h) 1.85±0.04 1.84±0.09 1.73±0.04 1.86±0.11 1.09±0.02 1.57±0.02 1.09±0.02 FA(mg NL−1)0.35±0.180.36±0.180.34±0.140.36±0.130.25±0.160.33±0.170.13±0.04 FNA(μg NL−1)0.3±0.10.3±0.20.4±0.20.4±0.10.9±0.40.6±0.10.9±0.2 PerformanceTotal N removal efficiency(%)54±552±549±934±936±936±942±4 Relative NO3−prod(%of NH4+cons a)7±17±17±114±618±916±321±4 Relative NO2−accum(%of NH4+cons)2±43±45±515±530±826±631±5 AerAOB activity(mg NH4+–NL−1day−1)267±38267±49260±52260±53811±229460±44986±71 NOB activity(mg NO2–NL−1day−1)0±00±00±09±1260±9420±585±25 AnAOB activity(mg N tot L−1day−1)412±38403±37368±76248±67448±117305±74529±75DO dissolved oxygen,HRT hydraulic retention time,F A free ammonia,FNA free nitrous acid,cons consumption,prod production,accum accumulation,tot totala NH4+consumption is corrected for nitrite accumulationAppl Microbiol Biotechnoland AnAOB16S rRNA gene and AerAOB functional AmoA gene,respectively,were used as standards for qPCR.All the amplification reactions had a high correlation coefficient (R2>0.98)and slopes between−3.0and−3.3.Detailed reactor cycle balancesFor the measurements of the total nitrogen balance,including the NO and N2O emissions,the OLAND RBC was placed in a vessel(34L)which had a small opening at the top(5cm2).In this vessel,a constant upward air flow(around1ms−1or0.5L s-1)was generated to allow calculations of emission rates.On the top of the vessel(air outlet),the NO and N2O concentra-tion was measured,off-and online,respectively.NH3emis-sions were negligible in a RBC operated at about2mg NH3–NL−1(Pynaert et al.2003).Since FA levels in the currentstudy are about ten times lower,NH3emissions were not included.In the water phase,ammonium,nitrite,nitrate,hy-droxylamine(NH2OH),N2O,and COD concentrations were measured.Moreover,DO concentration and pH values were monitored.The air flow was measured with Testo425hand probe(Testo,Ternat,Belgium).Chemical analysesAmmonium(Nessler method)was determined according to standard methods(Greenberg et al.1992).Nitrite and nitrate were determined on a761compact ion chromatograph equipped with a conductivity detector(Metrohm,Zofingen, Switzerland).Hydroxylamine was measured spectrophoto-metrically(Frear and Burrell1955).The COD was determined with NANOCOLOR®COD1500en NANOCOLOR®COD 160kits(Macherey-Nagel,Düren,Germany).The volumetric nitrogen conversion rates by AerAOB,NOB,and AnAOB were calculated based on the measured influent and effluent compositions and the described stoichiometries,underestimat-ing the activity of AnAOB by assuming that all COD removed was anoxically converted with nitrate to nitrogen gas (Vlaeminck et al.2012).DO and pH were measured with respectively,a HQ30d DO meter(Hach Lange,Düsseldorf, Germany)and an electrode installed on a C833meter (Consort,Turnhout,Belgium).Gaseous N2O concentrations were measured online at a time interval of3min with a photo-acoustic infrared multi-gas monitor(Brüel&Kjær, Model1302,Nærem,Denmark).Gas grab samples were taken during the detailed cycle balance tests for NO detec-tion using Eco Physics CLD77AM(Eco Physics AG, Duernten,Switzerland),which is based on the principle of chemiluminescence.For dissolved N2O measurements,a1-mL filtered(0.45μm)sample was brought into a7-mL vacutainer(−900hPa)and measured afterwards by pressure adjustment with He and immediate injection at21°C in a gas chromatograph equipped with an electron capture detector (Shimadzu GC-14B,Japan).Table2Effect of COD/N increase on the operational conditions and performance of OLAND RBC reactorPhase VIII IX X XI XII XIIIPeriod(days)355–361362–369370–374375–406407–421422–435 Immersion level(%)555555555555COD/N(-)0.51 1.5222 Feeding regime(pulsesh−1)222211 Operational conditionsDO(mg O2L−1) 2.9±0.3 2.5±0.6 2.4±0.3 3.0±0.7 3.6±0.3 3.2±0.3 pH(−)7.8±0.027.7±0.17.6±0.027.6±0.17.6±0.27.6±0.1 HRT(h) 1.06±0.11 1.03±0.020.92±0.020.94±0.05 1.10±0.05 1.06±0.2 FA(mg NL−1)0.10±0.050.04±0.050.15±0.050.21±0.100.23±0.120.04±0.02 FNA(μg NL−1)0.4±0.10.2±0.20.2±0.010.3±0.10.2±0.10.6±0.2 PerformanceTotal N removal efficiency(%)36±545±1823±328±623±1342±3 Relative NO3−prod(%of NH4+cons a)42±543±1263±250±662±1846±6 Relative NO2−accum(%of NH4+cons)20±410±105±18±37±413±6 AerAOB activity(mg NH4+–NL−1day−1)592±15446±31238±28352±73289±138600±204 NOB activity(mg NO2−–NL−1day−1)257±19294±81465±60352±84427±115394±76 AnAOB activity(mg N tot L−1day−1)385±86452±205262±39355±73281±159481±73COD removal rates were negligible in all phasesDO dissolved oxygen,HRT hydraulic retention time,F A free ammonia,FNA free nitrous acid,cons consumption,prod production,accum accumulation,tot totala NH4+consumption is corrected for nitrite accumulationAppl Microbiol BiotechnolResultsEffect of temperature decreaseDuring the reference period (29°C),a well-balanced OLAND performance (Fig.1;Table 1)was reached with minimal nitrite accumulation (2%)and minimal nitrate production (7%).This was reflected in an AerAOB/AnAOB activity ratio of 0.6(Table 1,phase I).The total nitrogen removal rate was on average 470mg N L −1day −1or 1314mg Nm −2day −1,and the total nitrogen removal efficiency was 54%.Decreasing the temperature from 29to 24°C and further to 22°C over the following 40days,did not result in anysignificant changes of the operational conditions (Table 1;phases I –III),performance of the reactor (Fig.1)or abun-dance of the bacterial groups (qPCR;Fig.S1in the ESM ).However at 17°C,a decrease in total nitrogen removal efficiency was observed (Table 1;phase IV).An imbalance between the AerAOB and the AnAOB was apparent from a stable AerAOB activity yet a declining AnAOB activity.Moreover,NOB activity was for the first time detected in spite of free ammonia (FA)and free nitrous acid (FNA)con-centrations did not change (Table 1;phase IV).Moreover,no significant differences in abundance of NOB,AerAOB,and AnAOB could be detected with qPCR (Fig.S1in the ESM ).However,DO concentrations started to increase during that period from 1.4to 1.7mg O 2L −1.As the availabilityofFig.1Phases I –VII:effect of temperature decrease on the volumetric rates (top )and nitrogen concentrations (bottom )Appl Microbiol Biotechnoloxygen through the liquid phase did not seem to be satisfac-tory to counteract the decrease in ammonium removal effi-ciency,the immersion level was lowered to55%to increase the availability of oxygen through more air-biofilm contact surface.Consequently,the volumetric loading rate increased (factor1.7)due to the decrease in reactor volume(day210, Fig.1).This action allowed higher ammonium removal effi-ciencies due to higher AerAOB activities(factor3).AnAOB activity increased with a similar factor as the volumetric loading rate(1.8compared with1.7)consequently resulting in an increased imbalance between these two groups of bac-teria(Table1;phase V).Moreover,although the FNA in-creased with a factor2,the NOB activity increased with a factor7,resulting in a relative nitrate production of30% (Table1;phase V).As NOB activity prevented good total nitrogen removal efficiencies,the immersion level was in-creased again to78%(day263;Fig.1).This resulted indeed in a lower NOB activity(Table1;phase VI).However,also the AerAOB activity decreased with the same factor,due to the lower availability of atmospheric oxygen.Therefore,the reactor was subsequently operated again at the lower immer-sion level(55%)to allow sufficient aerobic ammonium conversion.The latter allowed a stable removal efficiency of 42%.The AnAOB activity gradually increased to a stable anoxic ammonium conversion rate of529mg NL−1day−1. During the synthetic phase,no changes in AerAOB, AnAOB,and NOB abundance were measured with qPCR (Fig.S1in the ESM).The effluent quality was however not optimal as still high nitrite(around15mg NL−1)and nitrate (around13mg NL−1)levels were detected.Effect of COD/N increaseThe synthetic feed was gradually changed into pretreated sewage by diluting raw sewage and adding additional nitro-gen to obtain a certain COD/N ratio.During the first3weeks of this period(Fig.2),the COD/N ratio was gradually increased from0.5to2.Due to the short adaptation periods (1week per COD/N regime),the performance was unstable (Fig.2;Table2,phases VIII–XI).Compared with the end of the synthetic period(phase VII),operation at a COD/N ratio of2(phase XI)resulted in a sharp decrease in nitrite accu-mulation(Fig.2)and an increase in the ammonium and nitrate levels.This indicated increased NOB activity(factor 4),decreased AerAOB(factor3)and decreased AnAOB (factor2)activity(Tables1and2).To allow higher nitrogen removal rates,the HRT was increased from0.94to1.1h,by decreasing the influent flow rate.Moreover,the feeding regime was changed from two pulses of10min in1h to one period of20min/h.These actions did not significantly decrease the effluent nitrogen concentration(Fig.2)and did not influence the microbial activities(Table2,phase XII). Therefore the loading rate was again increased to the levels before phase XII.However,the single-pulse feeding wasmaintained.This resulted in high ammonium removal effi-ciencies and therefore low ammonium effluent concentra-tion around dischargeable level(4±1mg NH4+–NL−1; Fig.2).Nitrate and nitrite accumulation were not counter-acted by denitrification as only0.02mg CODL−1day−1wasremoved.Therefore,nitrite and nitrate levels were still toohigh to allow effluent discharge.The total nitrogen removalefficiency(42%)and rate(549±83mg NL−1day−1or1,098±106mgNm−2day−1)at COD/N ratios of2wassimilar as during the synthetic period(phase VII).Comparedwith the reference period at29°C,the total nitrogen removalrate did not changed significantly(470±43versus549±83mgNL−1day−1at high and low temperatures,respectively).The22%lowered removal efficiency was merely due to anincreased nitrogen loading rate.Nitratation and NO/N2O emissionsAt the end of the synthetic phase(phase VII)and the end ofthe experiment(phase XIII),the total nitrogen balance of thereactor was measured.A total nitrogen balance was obtainedby measuring all nitrogen species(NH4+,NO2−,NO3−,NH2OH,and N2O)in the liquid phase and N2O and NO inthe gas phase.A constant air flow,diluting the emitted N2Oand NO concentrations was created over the reactor tomeasure gas fluxes over time.The effect of the loading rate,feeding pattern,and concentration of nitrite and ammoniumon the total nitrogen balance in the reactor were tested(Table3).NH2OH measurements showed low concentra-tions(<0.2mg NL−1)in all tests,making it difficult to linkthe profiles with the N2O emission.Lowering the loading rate by increasing the HRT(Table3,test B)increased the DO values and allowed higherDO fluctuations over time at synthetic conditions.Moreover,NOB activity increased significantly resultingin lower total nitrogen removal efficiencies and high levelsof nitrate in the effluent(Table3,test B).The relative N2Oemissions did not change and were relatively high(6%of Nload).However,the concentration of N2O in the liquid andin the gas phase decreased with a factor2(Table3).When pretreated sewage was fed to the reactor,theOLAND RBC was operated at lower nitrite concentration,while similar ammonium and nitrate concentrations wereobtained(Table3,test C).The lower nitrite concentrationshowever did not result in lower N2O emission rates.Whenthe feeding regime was changed to a more continuous-likeoperation(4pulses/h),the N2O emission increased signifi-cantly,while NO emission remained constant(Table3,testD).Due to the lower ammonium removal efficiency(65compared with81%),but similar relative nitrite and nitrateaccumulation rate,the total nitrogen removal efficiencydecreased.Appl Microbiol BiotechnolWhen a nitrite pulse was added just after feeding,about 20mg NO 2−–NL −1was obtained in the reactor.This did increase the NO and N 2O emissions significantly (p <0.05)compared with the same feeding pattern (Table 3,tests C –E).Although similar constant total nitrogen removal efficien-cies were obtained during this operation,a significant (p <0.05)decrease in the relative nitrate production was observed.The latter was mainly caused by a global increase in AnAOB activity.In the last test (F),the influent ammo-nium concentration was doubled,leading to higher ammo-nium and also FA concentrations (1±0.4mg N L −1compared with 0.1±0.4mg NL −1).Due to overloading of the system,the total nitrogen removal efficiency decreased.However,at these conditions a lower relative nitrate pro-duction was obtained;due to a decrease in NOB and in-crease in AnAOB activity (Table 3,test F).Together with this,increased NO and N 2O emissions were observed.As the influence of the nitrogen loading and DO concentration could be considered minor in this test range (Fig.S2in the ESM ),these tests show a relation between increased NO emissions and decreased relative nitrate productions (Table 3).When the activity during the feeding cycle was studied in more detail,it could be concluded that the highest nitrogen conversion rates took place during the feeding period,which was characterized by a high substrate availability and high turbulence (Fig.3).As the HRT is only 1h,the reactor volume is exchanged in 20min.During this phase,ammo-nium increased,while nitrite and nitrate concentrations de-creased due to dilution (Figs.S3,S4,and S5in the ESM ).The NOB/AnAOB ratio was around 1,which means that NOB were able to take twice as much nitrite thanAnAOBFig.2Phases VIII –XIII:effect of COD/N increase on the volumetric rates (top )and nitrogen concentrations (bottom ).Data during the N balance tests (days 424–431)were not incorporated in the figure but are shown in Table 3Appl Microbiol BiotechnolTable 3Operational parameters and nitrogen conversion rates during the six different RBC operations which differ from feeding composition and feeding regime (volume at 2.5L and 50%immersion of the discs,days 307–309for synthetic feed,and days 424–431)Reactor phaseVII (synthetic)XIII (pretreated sewage)Test A a B C a D E -F Additive––––NO 2−NH 4+Feeding regime (pulses/h)221411Total N loading rate (mg NL −1day −1)1,1695851,3401,5541,7372,718Temperature water (°C)15±0.316±0.2*14±0.415±0.1*16±0.1*15±0.4DO (mg O 2L −1) 2.9±0.1 3.7±0.6* 4.0±0.1 3.2±0.1* 3.3±0.1* 3.2±0.1*pH (-)7.6±0.067.6±0.057.6±0.047.6±0.017.6±0.027.8±0.02*Ammonium out (mg NL −1)9±1 1.4±1*11±319±3*12±158±4*Nitrite out (mg NL −1)14±213±16±16±0.418±2*9±0.3*Nitrate out (mg NL −1)17±337±6*18±216±1*18±0.420±0.4NH 4+oxidation rate (mg NL −1day −1)895±22509±2*1,051±73957±891,053±161,285±93*Relative nitrite accumulation (%)25±320±1*14±315±18±4*15±1Relative nitrate production (%)36±876±6*48±147±342±2*34±3*Total efficiency (%)38±417±4*35±328±4*32±227±4*AerAOB activity (mg NH 4+–NL −1day −1)658±88469±17*827±44781±57795±30938±46*NOB activity (mg NO 2−–NL −1day −1)174±59299±28*375±38342±24*362±13277±18*AnAOB activity (mg N tot L −1day −1)205±3849±13*234±20218±29263±15*354±49*N 2O in liquid (μg NL −1)64±4630±22*78±12104±29*61±1374±4NO emission (mg Nday −1)0.53±0.03n.d.0.66±0.060.74±0.08 1.65±0.18*0.82±0.1*N 2O emission (mg Nday −1)151±2893±23*170±19179±6*274±37*202±18*%N 2O emission on loading5.1±1.06.4±1.6*5.0±0.64.5±0.2*6.2±0.8*3.0±0.3*aReference period for synthetic and pretreated sewage*p <0.05,significant differences compared with referenceperiod Fig.3Detailed NO/N 2Omonitoring during the reference test (Table 3,test C)and when nitrite was pulsed (Table 3,test E)and effect on AerAOB,AnAOB,and NOB activity during the different phases of the feeding cycle.Significant differences in AerAOB,AnAOB,NOB,and NO/N 2O concentration compared with the reference period areindicated with asterisks ,circles ,double quotation mark ,and plus sign ,respectivelyAppl Microbiol Biotechnol。
污水处理工业废水回用中英文对照外文翻译文献

(文档含英文原文和中文翻译)中英文资料对照外文翻译Catalytic strategies for industrial water re-useAbstractThe use of catalytic processes in pollution abatement and resource recovery is widespread and of significant economic importance [R.J. Farrauto, C.H. Bartholomew, Fundamentals of Industrial Catalytic Processes, Blackie Academic and Professional,1997.]. For water recovery and re-use chemo-catalysis is only just starting to make an impact although bio-catalysis is well established [J.N. Horan, BiologicalWastewater Treatment Systems; Theory and Operation, Chichester, Wiley,1990.]. This paper will discuss some of the principles behind developing chemo-catalytic processes for water re-use. Within this context oxidative catalytic chemistry has many opportunities to underpin the development of successful processes and many emerging technologies based on this chemistry can be considered .Keywords: COD removal; Catalytic oxidation; Industrial water treatment1.IntroductionIndustrial water re-use in Europe has not yet started on the large scale. However, with potential long term changes in European weather and the need for more water abstraction from boreholes and rivers, the availability of water at low prices will become increasingly rare. As water prices rise there will come a point when technologies that exist now (or are being developed) will make water recycle and re-use a viable commercial operation. As that future approaches, it is worth stating the most important fact about wastewater improvement–avoid it completely if at all possible! It is best to consider water not as a naturally available cheap solvent but rather, difficult to purify, easily contaminated material that if allowed into the environment will permeate all parts of the biosphere. A pollutant is just a material in the wrong place and therefore design your process to keep the material where it should be –contained and safe. Avoidance and then minimisation are the two first steps in looking at any pollutant removal problem. Of course avoidance may not be an option on an existing plant where any changes may have large consequences for plant items if major flowsheet revision were required. Also avoidance may mean simply transferring the issue from the aqueous phase to the gas phase. There are advantages and disadvantages to both water and gas pollutant abatement. However, it must be remembered that gas phase organic pollutant removal (VOC combustion etc.,) is much more advanced than the equivalent water COD removal and therefore worth consideration [1]. Because these aspects cannot be over-emphasised,a third step would be to visit the first two steps again. Clean-up is expensive, recycle and re-use even if you have a cost effective process is still more capital equipment that will lower your return on assets and make the process less financially attractive. At present the best technology for water recycle is membrane based. This is the only technology that will produce a sufficiently clean permeate for chemical process use. However, the technology cannot be used in isolation and in many (all) cases will require filtration upstream and a technique for handling the downstream retentate containing the pollutants. Thus, hybrid technologies are required that together can handle the all aspects of the water improvement process[6,7,8].Hence the general rules for wastewater improvement are:1. Avoid if possible, consider all possible ways to minimise.2. Keep contaminated streams separate.3. Treat each stream at source for maximum concentration and minimum flow.4. Measure and identify contaminants over complete process cycle. Look for peaks, which will prove costly to manage and attempt to run the process as close to typical values as possible. This paper will consider the industries that are affected by wastewater issues and the technologies that are available to dispose of the retentate which will contain the pollutants from the wastewater effluent. The paper will describe some of the problems to be overcome and how the technologies solve these problems to varying degrees. It will also discuss how the cost driver should influence developers of future technologies.2. The industriesThe process industries that have a significant wastewater effluent are shown in Fig. 1. These process industries can be involved in wastewater treatment in many areas and some illustrations of this are outlined below.Fig. 1. Process industries with wastewater issues.2.1. RefineriesThe process of bringing oil to the refinery will often produce contaminated water. Oil pipelines from offshore rigs are cleaned with water; oil ships ballast with water and the result can be significant water improvement issues.2.2. ChemicalsThe synthesis of intermediate and speciality chemicals often involve the use of a water wash step to remove impurities or wash out residual flammable solvents before drying.2.3. PetrochemicalsEthylene plants need to remove acid gases (CO2, H2S) formed in the manufacture process. This situation can be exacerbated by the need to add sulphur compounds before the pyrolysis stage to improve the process selectivity. Caustic scrubbing is the usual method and this produces a significant water effluent disposal problem.2.4. Pharmaceuticals and agrochemicalsThese industries can have water wash steps in synthesis but in addition they are often formulated with water-based surfactants or wetting agents.2.5. Foods and beveragesClearly use water in processing and COD and BOD issues will be the end result.2.6. Pulp and paperThis industry uses very large quantities of water for processing –aqueous peroxide and enzymes for bleaching in addition to the standard Kraft type processing of the pulp. It is important to realise how much human society contributes tocontaminated water and an investigation of the flow rates through municipal treatment plants soon shows the significance of non-process industry derived wastewater.3. The technologiesThe technologies for recalcitrant COD and toxic pollutants in aqueous effluent are shown in Fig. 2. These examples of technologies [2,6,8] available or in development can be categorised according to the general principle underlying the mechanism of action. If in addition the adsorption (absorption) processes are ignored for this catalysis discussion then the categories are:1. Biocatalysis2. Air/oxygen based catalytic (or non-catalytic).3. Chemical oxidation1. Without catalysis using chemical oxidants2. With catalysis using either the generation of _OH or active oxygen transfer. Biocatalysis is an excellent technology for Municipal wastewater treatment providing a very cost-effective route for the removal of organics from water. It is capable of much development via the use of different types of bacteria to increase the overall flexibility of the technology. One issue remains –what to do with all the activated sludge even after mass reduction by de-watering. The quantities involved mean that this is not an easy problem to solve and re-use as a fertilizer can only use so much. The sludge can be toxic via absorption of heavy metals, recalcitrant toxic COD. In this case incineration and safe disposal of the ash to acceptable landfill may be required. Air based oxidation [6,7] is very attractive because providing purer grades of oxygen are not required if the oxidant is free. Unfortunately, it is only slightly soluble in water, rather unreactive at low temperatures and, therefore, needs heat and pressure to deliver reasonable rates of reaction. These plants become capital intensive as pressures (from _10 to 100 bar) are used. Therefore, although the running costs maybe low the initial capital outlay on the plant has a very significant effect on the costs of the process. Catalysis improves the rates of reaction and hence lowers the temperature and pressure but is not able to avoid them and hence does not offer a complete solution. The catalysts used are generally Group VIII metals such as cobalt or copper. The leaching of these metals into the aqueous phase is a difficulty that inhibits the general use of heterogeneous catalysts [7]. Chemical oxidation with cheap oxidants has been well practised on integrated chemical plants. The usual example is waste sodium hypochlorite generated in chlor-alkali units that can be utilised to oxidise COD streams from other plants within the complex. Hydrogen peroxide, chlorine dioxide, potassium permanganate are all possible oxidants in this type of process. The choice is primarily determined by which is the cheapest at the point of use. A secondary consideration is how effective is the oxidant. Possibly the mostresearched catalytic area is the generation and use of _OH as a very active oxidant (advanced oxidation processes) [8]. There are a variety of ways of doing this but the most usual is with photons and a photocatalyst. The photocatalyst is normally TiO2 but other materials with a suitable band gap can be used [9,10]. The processes can be very active however the engineering difficulties of getting light, a catalyst and the effluent efficiently contacted is not easy. In fact the poor efficiency of light usage by the catalyst (either through contacting problems or inherent to the catalyst) make this process only suitable for light from solar sources. Photons derived from electrical power that comes from fossil fuels are not acceptable because the carbon dioxide emission this implies far outweighs and COD abatement. Hydroelectric power (and nuclear power) are possible sources but the basic inefficiency is not being avoided. Hydrogen peroxide and ozone have been used with photocatalysis but they can be used separately or together with catalysts to effect COD oxidation. For ozone there is the problem of the manufacturing route, corona discharge, which is a capital intensive process often limits its application and better route to ozone would be very useful. It is important to note at this point that the oxidants discussed do not have sufficient inherent reactivity to be use without promotion. Thus, catalysis is central to their effective use against both simple organics (often solvents) or complex recalcitrant COD. Hence, the use of Fenton’s catalyst (Fe) for hydrogen peroxide [11]. In terms of catalysis these oxidants together with hypochlorite form a set of materials that can act has ‘active oxygen transfer (AOT) oxidants’ in the presence of a suitable catalyst. If the AOT oxidant is hypochlorite or hydrogen peroxide then three phase reactions are avoided which greatly simplifies the flowsheet. Cheap, catalytically promoted oxidants with environmentally acceptable products of oxidation that do not require complex chemical engineering and can be produced efficiently would appear to offer one of the best solutions to the general difficulties often observed.3.1. Redox catalysis and active oxygen transferThe mechanism of catalytically promoted oxidation with hydrogen peroxide or sodium hypochlorite cannot be encompassed within one concept, however there are general similarities between the two oxidants that allows one to write a series of reactions for both (Fig. 3) [5]. This type of mechanism could be used to describe a broad range of reactions for either oxidant from catalytic epoxidation to COD oxidation. The inherent usefulness of the reactions is that;1. The reactions take place in a two-phase system.2. High pressure and temperature are not required.3. The catalytic surface can act as an adsorbent of the COD to be oxidised effectively increasing the concentration and hence the rate of oxidation.The simple mechanism shows the selectivity issue with this type of processes. The oxidant can simply be decomposed by the catalyst to oxygen gas – this reaction must be avoided because dioxygen will play no role in COD removal. Its formation is an expensive waste of reagent with oxygen gas ($20/Te) compared to the oxidant ($400–600/Te). To be cost competitive with alternative processes redox catalysis needs excellent selectivity.3.2. Technology mappingThe technologies so far described can be mapped [12] for their applicability with effluent COD concentration (measured as TOC) and effluent flow rate (m3 h-1). The map is shown in Fig. 4. The map outlines the areas where technologies are most effective. The boundaries, although drawn, are in fact fuzzier and should be only used as a guide. Only well into each shape will a technology start to dominate. The underlying cost model behind the map is based on simple assertions – at high COD mass flows only air/oxygen will be able to keep costs down because of the relatively low variable cost of the oxidant. At high COD concentrations and high flows only biological treatment plants have proved themselves viable –of course if done at source recovery becomes an option. At low flows and low COD levels redox AOT catalysis is an important technology – the Synetix Accent 1 process being an example of this type of process (see Fig. 5 for a simplified flowsheet). The catalyst operates under very controlled conditions at pH > 9 and hence metal leaching can be avoided (<5 ppb). The activity and selectivity aspects of the catalyst displayed in Fig. 3 can be further elaborated to look at the potential surface species. This simple view has been extended by a significant amount of research [3,4,5]. Now the mechanism of such a catalyst can be described in Fig. 6. The key step is to avoid recombination of NiO holes to give peroxy species and this can be contrasted with the hydrogen peroxide situation where the step may be characterized as oxygen vacancy filled. From both recombination will be facilitated by electronic and spatial factors. The range of application of the process is outlined below. From laboratory data some general types of chemical have been found suitable –sulphides, amines, alcohols, ketones, aldehydes, phenols, carboxylic acids, olefins and aromatic hydrocarbons. From industrial trials recalcitrant COD (nonbiodegradable) and sulphur compounds have been successfully demonstrated and a plant oxidising sulphur species has been installed and is operational.4. ConclusionsWastewater treatment processes are in the early stages of development. The key parameters at present are effectiveness and long term reliability. Many processes operating are in this stage, including the redox Accent TM is a trademark of the ICIGroup of Companies. catalysis systems. However,once proven, redox catalysis offers many advantages for COD removal from wastewater:1. The low capital cost of installation.2. Simple operation that can be automated.3. Flexible nature of the process – can be easily modified to meet changing demands of legislation.Hence it will be expected to develop into an important technology in wastewater improvement.AcknowledgementsThe author is grateful to Jane Butcher and Keith Kelly of Synetix for discussions on this paper. References[1] R.J. Farrauto, C.H. Bartholomew, Fundamentals of Industrial Catalytic Processes, Blackie Academic and Professional, 1997. F.E. Hancock / Catalysis Today 53 (1999) 3–9 9[2] J.N. Horan, Biological Wastewater Treatment Systems; Theory and Operation, Chichester, Wiley, 1990.[3] F.E. Hancock et al., Catalysis Today 40 (1998) 289.[4] F. King, F.E. Hancock, Catal. Today 27 (1996) 203.[5] J. Hollingworth et al., J. Electron Spectrosc., in press.[6] F. Luck, Environmental Catalysis, in: G. Centi et al. (Eds.), EFCE Publishers, Series 112, p. 125.[7] D. Mantzavinos et al., in: V ogelpohl and Geissen (Eds.), in: Proceedings of the Conference on Water Science and Technology, Clausthal-Zellerfeld, Germany, May 1996, J. Int. Assoc. Water Quality, Pergamon, 1997.[8] R. Venkatadri, R.W. Peters, Hazardous Waste Hazardous Mater. 10 (1993) 107.[9] A.M. Braun, E. Oliveros, Water Sci. Tech. 35 (1997) 17.[10] D. Bahnemann et al., Aquatic and surface photochemistry, Am. Chem. Soc. Symp. Ser. (1994) 261.[11] J. Prousek, Chem. Lisy 89 (1995) 11.工业废水回用的接触反应策略摘要:无论从控制污染还是资源恢复的角度,接触反应都是被广泛应用并极具经济效益的。
污水处理工业废水回用中英文对照外文翻译文献
中英文资料对照外文翻译Catalytic strategies for industrial water re-useAbstractThe use of catalytic processes in pollution abatement and resource recovery is widespread and of significant economic importance [R.J. Farrauto, C.H. Bartholomew, Fundamentals of Industrial Catalytic Processes, Blackie Academic and Professional,1997.]. For water recovery and re-use chemo-catalysis is only just starting to make an impact although bio-catalysis is well established [J.N. Horan, BiologicalWastewater Treatment Systems; Theory and Operation, Chichester, Wiley, 1990.]. This paper will discuss some of the principles behind developing chemo-catalytic processes for water re-use. Within this context oxidative catalytic chemistry has many opportunities to underpin the development of successful processes and many emerging technologies based on this chemistry can be considered .Keywords: COD removal; Catalytic oxidation; Industrial water treatment1.IntroductionIndustrial water re-use in Europe has not yet started on the large scale. However, with potential long term changes in European weather and the need for more water abstraction from boreholes and rivers, the availability of water at low prices will become increasingly rare. As water prices rise there will come a point when technologies that exist now (or are being developed) will make water recycle and re-use a viable commercial operation. As that future approaches, it is worth stating the most important fact about wastewater improvement–avoid it completely if at all possible! It is best to consider water not as a naturally available cheap solvent but rather, difficult to purify, easily contaminated material that if allowed into the environment will permeate all parts of the biosphere. A pollutant is just a material in the wrong place and therefore design your process to keep the material where it should be –contained and safe. Avoidance and then minimisation are the two first steps in looking at any pollutant removal problem. Of course avoidance may not be anoption on an existing plant where any changes may have large consequences for plant items if major flowsheet revision were required. Also avoidance may mean simply transferring the issue from the aqueous phase to the gas phase. There are advantages and disadvantages to both water and gas pollutant abatement. However, it must be remembered that gas phase organic pollutant removal (VOC combustion etc.,) is much more advanced than the equivalent water COD removal and therefore worth consideration [1]. Because these aspects cannot be over-emphasised,a third step would be to visit the first two steps again. Clean-up is expensive, recycle and re-use even if you have a cost effective process is still more capital equipment that will lower your return on assets and make the process less financially attractive. At present the best technology for water recycle is membrane based. This is the only technology that will produce a sufficiently clean permeate for chemical process use. However, the technology cannot be used in isolation and in many (all) cases will require filtration upstream and a technique for handling the downstream retentate containing the pollutants. Thus, hybrid technologies are required that together can handle the all aspects of the water improvement process[6,7,8].Hence the general rules for wastewater improvement are:1. Avoid if possible, consider all possible ways to minimise.2. Keep contaminated streams separate.3. Treat each stream at source for maximum concentration and minimum flow.4. Measure and identify contaminants over complete process cycle. Look for peaks, which will prove costly to manage and attempt to run the process as close to typical values as possible. This paper will consider the industries that are affected by wastewater issues and the technologies that are available to dispose of the retentate which will contain the pollutants from the wastewater effluent. The paper will describe some of the problems to be overcome and how the technologies solve these problems to varying degrees. It will also discuss how the cost driver should influence developers of future technologies.2. The industriesThe process industries that have a significant wastewater effluent are shown in Fig. 1. These process industries can be involved in wastewater treatment in many areas and some illustrations of this are outlined below.Fig. 1. Process industries with wastewater issues.2.1. RefineriesThe process of bringing oil to the refinery will often produce contaminated water. Oil pipelines from offshore rigs are cleaned with water; oil ships ballast with water and the result can be significant water improvement issues.2.2. ChemicalsThe synthesis of intermediate and speciality chemicals often involve the use of a water wash step to remove impurities or wash out residual flammable solvents before drying.2.3. PetrochemicalsEthylene plants need to remove acid gases (CO2, H2S) formed in the manufacture process. This situation can be exacerbated by the need to add sulphur compounds before the pyrolysis stage to improve the process selectivity. Caustic scrubbing is the usual method and this produces a significant water effluent disposal problem.2.4. Pharmaceuticals and agrochemicalsThese industries can have water wash steps in synthesis but in addition they are often formulated with water-based surfactants or wetting agents.2.5. Foods and beveragesClearly use water in processing and COD and BOD issues will be the end result.2.6. Pulp and paperThis industry uses very large quantities of water for processing –aqueous peroxide and enzymes for bleaching in addition to the standard Kraft type processing of the pulp. It is important to realise how much human society contributes to contaminated water and an investigation of the flow rates through municipal treatment plants soon shows the significance of non-process industry derived wastewater.3. The technologiesThe technologies for recalcitrant COD and toxic pollutants in aqueous effluent are shown in Fig. 2. These examples of technologies [2,6,8] available or in development can be categorised according to the general principle underlying the mechanism of action. If in addition the adsorption (absorption) processes are ignored for this catalysis discussion then the categories are:1. Biocatalysis2. Air/oxygen based catalytic (or non-catalytic).3. Chemical oxidation1. Without catalysis using chemical oxidants2. With catalysis using either the generation of _OH or active oxygen transfer. Biocatalysis is an excellent technology for Municipal wastewater treatment providing a very cost-effective route for the removal of organics from water. It is capable of much development via the use of different types of bacteria to increase the overall flexibility of the technology. One issue remains –what to do with all the activated sludge even after mass reduction by de-watering. The quantities involved mean that this is not an easy problem to solve and re-use as a fertilizer can only use so much. The sludge can be toxic via absorption of heavy metals, recalcitrant toxic COD. Inthis case incineration and safe disposal of the ash to acceptable landfill may be required. Air based oxidation [6,7] is very attractive because providing purer grades of oxygen are not required if the oxidant is free. Unfortunately, it is only slightly soluble in water, rather unreactive at low temperatures and, therefore, needs heat and pressure to deliver reasonable rates of reaction. These plants become capital intensive as pressures (from _10 to 100 bar) are used. Therefore, although the running costs maybe low the initial capital outlay on the plant has a very significant effect on the costs of the process. Catalysis improves the rates of reaction and hence lowers the temperature and pressure but is not able to avoid them and hence does not offer a complete solution. The catalysts used are generally Group VIII metals such as cobalt or copper. The leaching of these metals into the aqueous phase is a difficulty that inhibits the general use of heterogeneous catalysts [7]. Chemical oxidation with cheap oxidants has been well practised on integrated chemical plants. The usual example is waste sodium hypochlorite generated in chlor-alkali units that can be utilised to oxidise COD streams from other plants within the complex. Hydrogen peroxide, chlorine dioxide, potassium permanganate are all possible oxidants in this type of process. The choice is primarily determined by which is the cheapest at the point of use. A secondary consideration is how effective is the oxidant. Possibly the most researched catalytic area is the generation and use of _OH as a very active oxidant (advanced oxidation processes) [8]. There are a variety of ways of doing this but the most usual is with photons and a photocatalyst. The photocatalyst is normally TiO2 but other materials with a suitable band gap can be used [9,10]. The processes can be very active however the engineering difficulties of getting light, a catalyst and the effluent efficiently contacted is not easy. In fact the poor efficiency of light usage by the catalyst (either through contacting problems or inherent to the catalyst) make this process only suitable for light from solar sources. Photons derived from electrical power that comes from fossil fuels are not acceptable because the carbon dioxide emission this implies far outweighs and COD abatement. Hydroelectric power (and nuclear power) are possible sources but the basic inefficiency is not being avoided. Hydrogen peroxide and ozone have been used with photocatalysis but they can be used separately or together with catalysts to effect COD oxidation. For ozone there is the problem of the manufacturing route, corona discharge, which is a capital intensive process often limits its application and better route to ozone would be very useful. It is important to note at this point that the oxidants discussed do not have sufficient inherent reactivity to be use without promotion. Thus, catalysis is central to their effective use against both simple organics (often solvents) or complex recalcitrant COD. Hence, the use of Fenton’s catalyst (Fe) for hydrogen peroxide [11]. In terms of catalysis these oxidants together with hypochlorite form a set of materials that can acthas ‘active oxygen transfer (AOT) oxidants’ in the presence of a suitable catalyst. If the AOT oxidant is hypochlorite or hydrogen peroxide then three phase reactions are avoided which greatly simplifies the flowsheet. Cheap, catalytically promoted oxidants with environmentally acceptable products of oxidation that do not require complex chemical engineering and can be produced efficiently would appear to offer one of the best solutions to the general difficulties often observed.3.1. Redox catalysis and active oxygen transferThe mechanism of catalytically promoted oxidation with hydrogen peroxide or sodium hypochlorite cannot be encompassed within one concept, however there are general similarities between the two oxidants that allows one to write a series of reactions for both (Fig. 3) [5]. This type of mechanism could be used to describe a broad range of reactions for either oxidant from catalytic epoxidation to COD oxidation. The inherent usefulness of the reactions is that;1. The reactions take place in a two-phase system.2. High pressure and temperature are not required.3. The catalytic surface can act as an adsorbent of the COD to be oxidised effectively increasing the concentration and hence the rate of oxidation.The simple mechanism shows the selectivity issue with this type of processes. The oxidant can simply be decomposed by the catalyst to oxygen gas – this reaction must be avoided because dioxygen will play no role in COD removal. Its formation is an expensive waste of reagent with oxygen gas ($20/Te) compared to the oxidant ($400–600/Te). To be cost competitive with alternative processes redox catalysis needs excellent selectivity.3.2. Technology mappingThe technologies so far described can be mapped [12] for their applicability with effluent COD concentration (measured as TOC) and effluent flow rate (m3 h-1). The map is shown in Fig. 4. The map outlines the areas where technologies are most effective. The boundaries, although drawn, are in fact fuzzier and should be only used as a guide. Only well into each shape will a technology start to dominate. The underlying cost model behind the map is based on simple assertions – at high COD mass flows only air/oxygen will be able to keep costs down because of the relatively low variable cost of the oxidant. At high COD concentrations and high flows only biological treatment plants have proved themselves viable –of course if done at source recovery becomes an option. At low flows and low COD levels redox AOT catalysis is an important technology – the Synetix Accent 1 process being an example of this type of process (see Fig. 5 for a simplified flowsheet). The catalyst operates under very controlled conditions at pH > 9 and hence metal leaching can be avoided (<5 ppb). The activity and selectivity aspects of the catalyst displayed in Fig. 3 can befurther elaborated to look at the potential surface species. This simple view has been extended by a significant amount of research [3,4,5]. Now the mechanism of such a catalyst can be described in Fig. 6. The key step is to avoid recombination of NiO holes to give peroxy species and this can be contrasted with the hydrogen peroxide situation where the step may be characterized as oxygen vacancy filled. From both recombination will be facilitated by electronic and spatial factors. The range of application of the process is outlined below. From laboratory data some general types of chemical have been found suitable –sulphides, amines, alcohols, ketones, aldehydes, phenols, carboxylic acids, olefins and aromatic hydrocarbons. From industrial trials recalcitrant COD (nonbiodegradable) and sulphur compounds have been successfully demonstrated and a plant oxidising sulphur species has been installed and is operational.4. ConclusionsWastewater treatment processes are in the early stages of development. The key parameters at present are effectiveness and long term reliability. Many processes operating are in this stage, including the redox Accent TM is a trademark of the ICI Group of Companies. catalysis systems. However,once proven, redox catalysis offers many advantages for COD removal from wastewater:1. The low capital cost of installation.2. Simple operation that can be automated.3. Flexible nature of the process – can be easily modified to meet changing demands of legislation.Hence it will be expected to develop into an important technology in wastewater improvement.AcknowledgementsThe author is grateful to Jane Butcher and Keith Kelly of Synetix for discussions on this paper. References[1] R.J. Farrauto, C.H. Bartholomew, Fundamentals of Industrial Catalytic Processes, Blackie Academic and Professional, 1997. F.E. Hancock / Catalysis Today 53 (1999) 3–9 9[2] J.N. Horan, Biological Wastewater Treatment Systems; Theory and Operation, Chichester, Wiley, 1990.[3] F.E. Hancock et al., Catalysis Today 40 (1998) 289.[4] F. King, F.E. Hancock, Catal. Today 27 (1996) 203.[5] J. Hollingworth et al., J. Electron Spectrosc., in press.[6] F. Luck, Environmental Catalysis, in: G. Centi et al. (Eds.), EFCE Publishers, Series 112, p. 125.[7] D. Mantzavinos et al., in: V ogelpohl and Geissen (Eds.), in: Proceedings of the Conference on Water Science and Technology, Clausthal-Zellerfeld, Germany, May 1996, J. Int. Assoc. Water Quality, Pergamon, 1997.[8] R. Venkatadri, R.W. Peters, Hazardous Waste Hazardous Mater. 10 (1993) 107.[9] A.M. Braun, E. Oliveros, Water Sci. Tech. 35 (1997) 17.[10] D. Bahnemann et al., Aquatic and surface photochemistry, Am. Chem. Soc. Symp. Ser. (1994) 261.[11] J. Prousek, Chem. Lisy 89 (1995) 11.工业废水回用的接触反应策略摘要:无论从控制污染还是资源恢复的角度,接触反应都是被广泛应用并极具经济效益的。
污水处理的英文文献翻译(1)
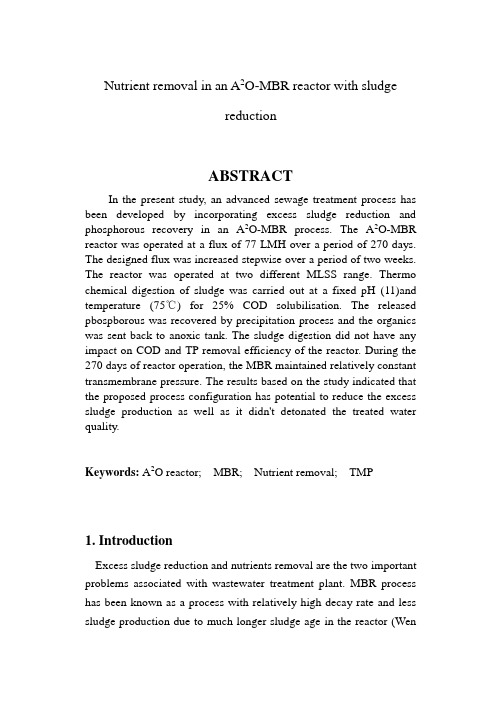
Nutrient removal in an A2O-MBR reactor with sludgereductionABSTRACTIn the present study, an advanced sewage treatment process has been developed by incorporating excess sludge reduction and phosphorous recovery in an A2O-MBR process. The A2O-MBR reactor was operated at a flux of 77 LMH over a period of 270 days. The designed flux was increased stepwise over a period of two weeks. The reactor was operated at two different MLSS range. Thermo chemical digestion of sludge was carried out at a fixed pH (11)and temperature (75℃) for 25% COD solubilisation. The released pbospborous was recovered by precipitation process and the organics was sent back to anoxic tank. The sludge digestion did not have any impact on COD and TP removal efficiency of the reactor. During the 270 days of reactor operation, the MBR maintained relatively constant transmembrane pressure. The results based on the study indicated that the proposed process configuration has potential to reduce the excess sludge production as well as it didn't detonated the treated water quality.Keywords: A2O reactor; MBR; Nutrient removal; TMP1. IntroductionExcess sludge reduction and nutrients removal are the two important problems associated with wastewater treatment plant. MBR process has been known as a process with relatively high decay rate and less sludge production due to much longer sludge age in the reactor (Wenet al., 2004). Sludge production in MBR is reduced by 28-68%, depending on the sludge age used (Xia et al.,2008). However, minimizing the sludge production by increasing sludge age is limited due to the potential adverse effect of high MLSS concentrations on membrane (Yoon et al., 2004). This problem can be solved by introducing sludge disintegration technique in MBR (Young et al., 2007). Sludge disintegration techniques have been reported to enhance the biodegradability of excess sludge (Vlyssides and Karlis, 2004). In overall, the basis for sludge reduction processes is effective combination of the methods for sludge disintegration and biodegradation of treated sludge. Advances in sludge disintegration techniques offer a few promising options including ultrasound (Guo et al., 2008), pulse power (Choi et al.,2006), ozone (Weemaes et al., 2000), thermal (Kim et al., 2003), alkaline (Li et al., 2008) acid (Kim et al., 2003) and thermo chemical(Vlyssides and Karlis, 2004). Among the various disintegration techniques, thermo chemical was reported to be simple and cost effective (Weemaes and Verstraete, 1998). In thermal-chemical hydrolysis, alkali sodium hydroxide was found to be the most effective agent in inducing cell lysis (Rocker et al., 1999). Conventionally, the nutrient removal was carried out in an A2O process. It has advantage of achieving, nutrient removal along with organic compound oxidation in a single sludge configuration using linked reactors in series (Tchobanoglous et al., 2003). The phosphoroes removal happens by subjecting phosphorous accumulating organisms (PAO) bacteria under aerobic and anaerobic conditions (Akin and Ugurlu, 2004). These operating procedures enhance predominance PAO, which are able to uptake phosphorous in excess. During the sludge pretreatment processes the bound phosphorous was solubilised and it increases the phosphorousconcentration in the effluent stream (Nishimura, 2001).So, it is necessary to remove the solubilised phosphorus before it enters into main stream. Besides, there is a growing demand for the sustainable phosphorous resources in the industrialized world. In many developed countries, researches are currently underway to recover the phosphoroes bound in the sludge's of enhanced biological phosphorus removal system (EBPR). The released phosphorous can be recovered in usable products using calcium salts precipitation method. Keeping this fact in mind, in the present study, a new advanced wastewater treatment process is developed by integrating three processes, which are: (a) thermo chemical pretreatment in MBR for excess sludge reduction (b) A2O process for biological nutrient removal (c) P recovery through calcium salt precipitation. The experimental data obtained were then used to evaluate the performance of this integrated system.2. Methods2.1. WastewaterThe synthetic domestic wastewater was used as the experimental influent. It was basically composed of a mixed carbon source, macro nutrients (N and P), an alkalinity control (NaHCO3) and a microelement solution. The composition contained (/L) 210 mg glucose, 200 mg NH4C1, 220 mg NaHCO3, 22一34 mg KH2PO4, microelement solution (0.19 mg MnCl2 4H20, 0.0018 mg ZnCl22H2O,0.022 mg CuCl22H2O, 5.6 mg MgSO47H2O, 0.88 mg FeCl36H2O,1.3 mg CaCl2·2H2O). The synthetic wastewater was prepared three times a week with concentrations of 210±1.5 mg/L chemical oxygen demand (COD), 40±1 mg/L total nitrogen (TN) and 5.5 mg/L total phosphorus (TP).2.2. A2O-MBRThe working volume of the A2O-MBR was 83.4 L. A baffle was placed inside the reactor to divide it into anaerobic (8.4 L) anoxic (25 L) and aerobic basin (50 L). The synthetic wastewater was feed into the reactor at a flow rate of 8.4 L/h (Q) using a feed pump. A liquid level sensor, planted in aerobic basin of A2O-MBR controlled the flow of influent. The HRT of anaerobic, anoxic and aerobic basins were 1, 3 and 6 h, respectively. In order to facilitate nutrient removal, the reactor was provided with two internal recycle (1R). IRl (Q= 1)connects anoxic and anaerobic and IR 2 (Q=3) was between aerobic and anoxic. Anaerobic and anoxic basins were provided with low speed mixer to keep the mixed liquid suspended solids (MLSS) in suspension. In the aerobic zone, diffusers were used to generate air bubbles for oxidation of organics and ammonia. Dissolved oxygen (DO) concentration in the aerobic basin was maintained at 3.5 mg/1 and was monitored continuously through online DO meter. The solid liquid separation happens inaerobic basin with the help of five flat sheet membranes having a pore size of 0.23 pm. The area of each membrane was 0.1 m2. They were connected together by a common tube. A peristaltic pumpwas connected in the common tube to generate suction pressure. In the common tube provision was made to accommodate pressure gauge to measure transmembrane pressure (TMP) during suction. The suction pump was operated in sequence of timing, which consists of 10 min switch on, and 2 min switch off.2.3. Thermo chemical digestion of sludgeMixed liquor from aerobic basin of MBR was withdrawn at the ratio of 1.5% of Q/day and subjected to thermo chemical digestion. Thermo chemical digestion was carried out at a fixed pH of 11(NaOH) and temperature of 75℃for 3 h. After thermo chemical digestion the supernatant and sludge were separated. The thermo-chemicallydigested sludge was amenable to further anaerobic bio-degradation (Vlyssides and Karlis, 2004), so it was sent to theanaerobic basin of the MBR2.4. Phosphorus recoveryLime was used as a precipitant to recover the phosphorous in the supernatant. After the recovery of precipitant the content was sent back to anoxic tank as a carbon source and alkalinity supelement for denitrification.2.5. Chemical analysisCOD, MLSS, TP, TN of the raw and treated wastewater were analyzed following methods detailed in (APHA, 2003). The influent and effluent ammonia concentration was measured using an ion-selective electrode (Thereto Orion, Model: 95一12). Nitrate in the sample was analyzed using cadmium reduction method (APHA, 2003).3. Results and discussionFig. 1 presents data of MLSS and yield observed during the operational period of the reactor. One of the advantages of MBR reactor was it can be operated in high MLSS concentration. The reactor was seeded with EBPR sludge from the Kiheung, sewage treatment plant, Korea. The reactor was startup with the MLSS concentration of 5700 mg/L. It starts to increase steadily with increase in period of reactor operation and reached a value of 8100 mg/L on day 38. From then onwards, MLSS concentration was maintained in the range of 7500 mg/L by withdrawing excess sludge produced and called run I. The observed yields (Yobs) for experiments without sludge digestion (run I) and with sludge digestion were calculated and given in Fig. 1. The Yobs for run I was found to be 0.12 gMLSS/g COD. It was comparatively lower than a value of 0.4 gMLSS/g CODreported for the conventional activated sludge processes (Tchoba-noglous et al., 2003). The difference in observed yield of these two systems is attributed to their working MLSS concentration. At high MLSS concentration the yield observed was found to be low (Visva-nathan et al., 2000). As a result of that MBR generated less sludge.The presently used MLSS ranges (7.5一10.5 g/L) are selected on the basis of the recommendation by Rosenberger et al. (2002). In their study, they reported that the general trend of MLSS increase on fouling in municipal applications seems to result in no impact at medium MLSS concentrations (7一12 g/L).It is evident from the data that the COD removal efficiency of A2O system remains unaffected before and after the introduction of sludge digestion practices. A test analysis showed that the differences between the period without sludge digestion (run I) and with sludge digestion (run II and III) are not statistically significant.However, it has been reported that, in wastewater treatment processes including disintegration-induced sludge degradation, the effluent water quality is slightly detonated due to the release of nondegradable substances such as soluble microbial products (Ya-sui and Shibata, 1994; Salcai et al., 1997; Yoon et al., 2004). During the study period, COD concentration in the aerobic basin of MBR was in the range of 18-38 mg/L and corresponding organic concentration in the effluent was varied from 4 to 12 mg/L. From this data it can be concluded that the membrane separation played an important role in providing the excellent and stable effluent quality.Phosphorus is the primary nutrient responsible for algal bloom and it is necessary to reduce the concentration of phosphorus in treated wastewater to prevent the algal bloom. Fortunately its growth can be inhibited at the levels of TP well below 1 mg/L (Mer-vat and Logan, 1996).Fig. 2 depicts TP removal efficiency of the A2O-MBR system during the period of study. It is clearly evident from the figure that the TP removal efficiency of A/O system was remains unaffected after the introduction of sludge reduction. In the present study, the solubilised phosphorous was recovered in the form of calcium phosphate before it enters into main stream. So, the possibility of phosphorus increase in the effluent due to sludge reduction practices has been eliminated. The influent TP concentration was in the range of 5.5 mg/L. During thefirst four weeks of operation the TP removal efficiency of the system was not efficient as the TP concentration in the effluent exceeds over 2.5 mg/L. The lower TP removal efficiency during the initial period was due to the slow growing nature of PAO organisms and other operational factors such as anaerobic condition and internal recycling. After the initial period, the TP removal efficiency in the effluent starts to increase with increase in period of operation. TP removal in A2O process is mainly through PAO organisms. These organisms are slow growing in nature and susceptible to various physicochemical factors (Carlos et al., 2008). During the study period TP removal efficiency of the system remains unaffected and was in the range of 74-82%.。
关于水污染控制工程文献的外文翻译(附原文链接)
水本实验中使用来自一个住宅社区。
质量指标列于表1。
2.3方法CODcr的是由重铬酸钾法测定;BOD5是通过稀释和接种方法进行测试;氨氮是由纳氏光谱法测试;总磷是用二氯化锡的方法测试;pH值是由膜电极的方法进行测试。
2.4启动反应在生物接触氧化之前有必要驯化微生物使其正常运行。
这个过程称为生物膜的形成。
有两种方法来培养微生物。
在这个实验中,采用天然生物薄膜形成方法。
在实验的开始,将生活污水被通入氧化槽1和槽2,保持空气/水的比例5:1。
2天后,在填料的表面可以观察到淡黄的生物膜填料,4天后完全覆盖生物膜。
然后采用流化培养。
从氧化槽1流出的废水流进氧化槽2。
7天之后成功地形成生物膜(生物膜和COD浓度的废水作为标准)。
图2示出了填充物的生物膜已经形成之前和之后的对比。
可以发现,生物薄膜在罐2比在槽1和较厚的种类和细菌的数量在等级1是更加薄笏在罐2。
而原生动物和后生动物在罐2的量为大于在罐1中,其原因可能是,对于细菌的营养物质已被而消耗和有毒物质的一部分已经在罐1被移除。
3结果和讨论3.1水力停留时间的影响当每个反应器的滞留时间相等时,该系统将处于最佳状态。
因此每个接触氧化槽在该实验中的保留时间来设计是相同的。
后的生物薄膜形成过程结束时,实验继续持续了7天。
图3显示HRT和CODcr的平均去除率在HRT为30,60,90,120,180,和300分钟之间的关系。
结果表明,当HRT增加时,CODcr的平均去除率增大,。
当每个氧化池的水力停留时间为1h时,CODcr的去除率为91.2%,。
因为停留时间的进一步增加不会导致在CODcr的去除速率明显增加,在本实验中,HRT选择1小时。
3.2空气/水比例的影响气体流量是影响对去除速率的重要因素。
在相同的HRT——1h条件,通过控制两个氧化槽的气/水比例,其结果示于表2。
从表2中可以看出,是在氧化一总空气/水的比例为5:1,以3:1在氧化槽1的空气/水比,和2:1的条件下得到的流出物的最佳结果槽2的空气/水的比率下降将导致减少溶解氧的浓度和微生物的生物降解性的。
污水处理 英文文献3 翻译

丹宁改性絮凝剂处理城市污水J.Beltrán-heredia,J.ánche z-Martin埃斯特雷马杜拉大学化学工程系和物理化学系,德埃娃儿,S / N 06071,巴达霍斯,西班牙摘要一种新的以丹宁为主要成分的混凝剂和絮凝剂已经过测试用以处理城市污水。
TANFLOC 证实了其在浊度的去除上的高效性(接近100%,取决于剂量),并且近50%的BOD5和COD 被去除,表明TANFLOC是合适的凝集剂,效力可与明矾相媲美。
混凝絮凝剂过程不依赖于温度,发现最佳搅拌速度和时间为40转/每分钟和30分钟。
多酚含量不显著增加,30%的阴离子表面活性剂被去除。
沉淀过程似乎是一种絮凝分离,所以污泥体积指数和它随絮凝剂剂量的改变可以确定。
证明TANFLOC是相当有效的可用于污水处理的混凝絮凝剂。
关键词: 基于丹宁的絮凝剂城市污水絮凝天然混凝剂1.简介人类活动是废物的来源。
特别是在城市定居点,来自家庭和工业的废水可能是危险有害的产品[ 1 ],需要适当的处理,以避免对环境[ 2 ]和健康的影响[ 3,4 ]。
2006年12月4日联合国大会通过决议宣布2008为国际卫生年。
无效的卫生基础设施促使每年220万人死于腹泻,主要在3岁以下儿童,600万人因沙眼失明,两亿人感染血吸虫病,只是为了给出一些数据[ 5 ]。
显然,他们中的大多数都是在发展中国家,所以谈及城市污水,必须研究适当的技术来拓宽可能的处理技术种类。
在这个意义上,许多类型的水处理被使用。
他们之间的分歧在于经济和技术特点上。
了摆脱危险的污染[ 6 ],一些令人关注的论文已经发表的关于城市污水处理的几种天然的替代方法,包括绿色过滤器、化学初步分离、紫外消毒[ 7 ]和多级程序[ 8 ]。
几个以前的文件指出了城市污水管理[9,10]的重要性。
这种类型的废物已成为社会研究的目标,因为它涉及到几个方面,都与社会结构和社会组织[11 ]相关。
根据这一维度,必须认识到废水管理作为发展中国家的一种社会变化的因素,事关污水处理和生产之间的平衡,是非常重要的,一方面,人类要发展,另一方面,显而易见。
- 1、下载文档前请自行甄别文档内容的完整性,平台不提供额外的编辑、内容补充、找答案等附加服务。
- 2、"仅部分预览"的文档,不可在线预览部分如存在完整性等问题,可反馈申请退款(可完整预览的文档不适用该条件!)。
- 3、如文档侵犯您的权益,请联系客服反馈,我们会尽快为您处理(人工客服工作时间:9:00-18:30)。
提高塔式复合人工湿地处理农村生活污水的脱氮效率1摘要:努力保护水源,尤其是在乡镇地区的饮用水源,是中国污水处理当前面临的主要问题。
氮元素在水体富营养化和对水生物的潜在毒害方面的重要作用,目前废水脱氮已成为首要关注的焦点。
人工湿地作为一种小型的,处理费用较低的方法被用于处理乡镇生活污水。
比起活性炭在脱氮方面显示出的广阔前景,人工湿地系统由于溶解氧的缺乏而在脱氮方面存在一定的制约。
为了提高脱氮效率,一种新型三阶段塔式混合湿地结构----人工湿地(thcw)应运而生。
它的第一部分和第三部分是水平流矩形湿地结构,第二部分分三层,呈圆形,呈紊流状态。
塔式结构中水流由顶层进入第二层及底层,形成瀑布溢流,因此水中溶解氧浓度增加,从而提高了硝化反应效率,反硝化效率也由于有另外的有机物的加入而得到了改善,增加反硝化速率的另一个原因是直接通过旁路进入第二部分的废水中带入的足量有机物。
常绿植物池柏(Taxodium ascendens),经济作物蔺草(Schoenoplectus trigueter),野茭白(Zizania aquatica),有装饰性的多花植物睡莲(Nymphaea tetragona),香蒲(Typha angustifolia)被种植在湿地中。
该系统对总悬浮物、化学需氧量、氨氮、总氮和总磷的去除率分别为89%、85%、83%、83% 和64%。
高水力负荷和低水力负荷(16 cm/d 和32 cm/d)对于塔式复合人工湿地结构的性能没有显著的影响。
通过硝化活性和硝化速率的测定,发现硝化和反硝化是湿地脱氮的主要机理。
塔式复合人工湿地结构同样具有观赏的价值。
关键词:人工湿地;硝化作用;反硝化作用;生活污水;脱氮;硝化细菌;反硝化细菌1. 前言对于提高水源水质的广泛需求,尤其是提高饮用水水源水质的需求是目前废水深度处理的技术发展指向。
在中国的乡镇地区,生活污水是直接排入湖泊、河流、土壤、海洋等水源中。
这些缺乏处理的污水排放对于很多水库、湖泊不能达到水质标准是有责任的。
许多位于中国的乡镇地区的社区缺乏足够的生活污水处理设备。
由于山区地形、人口分散、经济基础差等原因,废水的收集和处理是很成问题的。
由于资源短缺,经济欠发达地区所采取的废水处理技术必须低价高效,并且要便于施用,能量输入及维护费用较低,而且要保证出水能达标。
建造在城市中基于活性污泥床的废水集中处理厂,对于小乡镇缺乏经济适用性,主要是由于污水收集结构的建造费用高。
1Ecological Engineering,Fen xia ,Ying Li。
在另一方面,在中国,许多河流、水库、湖泊的氮含量没有达到国家和当地的政府的标准。
虽然许多湖泊、大部分入海口、基本上所有的海岸的水看起来都很清洁,但是氮元素仍然在水体富营养化中扮演着一个主要的角色。
因此相关叫做“新农村”国家标准已经颁布了。
这个新标准规定,乡镇地区的的生活废水必须经过处理才能排入水源或土壤中。
人工湿地已经被科学的认识并且建造于小型乡镇地区的污水处理工程。
人工湿地简单的结构,具有大的缓冲能力,产出较少的剩余污泥的,操作和维护简捷,操作和维护费用很低。
这项技术对于SS,BOD,COD的脱除效率一般情况下是良好的,但是氮的脱除尤其是氨氮的脱除在现在运行的湿地系统中(水平流主导控制的湿地)是偏低的,这主要由于人工湿地中可被硝化微生物群利用的氧气量的缺乏导致的。
在268号欧洲湿地中给出如下数据,一般氮的脱除在表面水平流系统(SSHF)是大约30–40%,这意味着大约30%的氨氮(NH3-N)和39.6%的总氮被脱除。
无论如何,单一数据与大部分长期被监测的表面水平流系统在脱除氮方面是存在极大的不同的(Vymazal, 2005)。
这个问题是由于底部不合格的渗透系数及氧合作用的不足导致的。
要达到更高的脱除效率垂直流系统技术一定要比较完善。
但是在以上这些人工湿地的设计中氮的脱除通常是不足的。
通常被认为硝化反应发生在湿地系统中,但是需要更长的水力停留时间(HRT)。
生物硝化反硝化反应是人工湿地系统脱氮最重要的机理;其他的机理比如植物吸收、吸附、氨的挥发是比较次重要的(Green, 1997)。
尽管植物吸收了氮,但是仅仅一小部分被植物在一个可接受的范围内进行重移。
在收割之后计算水生植物的吸收能力,粗略的统计为200–2500 kg N/每年,相比而言水下植物的吸收能力较弱为(<700 kg N/每年)(Brix, 1994)。
此外,如果没有收割湿地植物,绝大部分已经被吸收并构成入植物机体的氮元素会伴随腐败过程重新回到水中。
生物硝化反硝化作用依赖于很多因素如:温度、pH、碱度、电势和可利用的溶解氧。
NH3-N的脱除大部分依赖于氧气的供应。
连续不断的流水的反应床是一般是厌氧的。
由于植物运输氧气到其根部,并在根部生长了好氧微生物,因此在靠近根部的地方NH4+由如亚硝化单细胞菌此类的硝化细菌氧化为亚硝酸盐,发生了硝化反应,然后由带有相同霉的细菌氧化为硝酸盐,如硝化杆菌。
随后在湿地的一个厌氧区域扩散并且在有乳酸或是氢气这样电子源存在的情况下,硝酸盐为一个庞大的被称作硝酸盐生产者的的细菌群落提供电子。
硝酸盐最后转化为氮气释放入大气中(Drio et al.,1997)。
硝化速率比反硝化速率明显偏低,事实上,硝化速率变成了氮的脱除的限制因素。
当1gNH3-N 被氧化为NO3-N,需要4.3g氧气。
当NH3-N为1mg/L时,直到溶解氧浓度达到4.6mg/L硝化反应才能进行。
入水BOD中过量的矿物质与溶解氧都与硝化作用缓慢与否有关。
无论如何,由水培养殖产生的氧气是有限的。
与水生植物多寡相关的水底氧气的释放量据报道是在0.5-5.2g/(m2d) 左右(Caffreya and Kempb, 1991)。
在人工湿地的次级生长床层(VSB)表面水的溶解氧通常是偏低的。
比如,次级生长床层(VSB)的微型植物系统的溶解氧浓度通常会小于1ppm (Steinberg and Coonrod, 1994)。
许多研究已经显示很多大型水生植物根部的溶解氧浓度远远小于有机物氧化分解及硝化作用的需氧量。
由于人工湿地结构在次级生长床层(VSB)低浓度的溶解氧,硝化作用被认为是脱氮的限制环节。
在低溶解氧的情况下硝化反应可以发生,但其反应速率是远远小于当溶解氧大于2 mg/L时的反应速率(Grady et al.,1980)。
为了提高脱氮效率,通风应用于提高溶解氧浓度和硝化反应效率。
但当NH3-N的脱除效率提高的同时的NO3-N脱除效率则会下降(Green, 1997)。
人工湿地要促进反硝化需具备两个环境条件:对于反硝化反应的一个必要条件是厌氧沉淀物(氧化还原电位小于300mv)的存在;另一个条件是碳源的提供(Vymazal, 2005)。
人工湿地植被脱除的氮有87%是依靠反硝化作用,剩余13%积累在沉淀和生物体中。
凭借为反硝化提供有机碳和制造缺氧环境,植物体及其残渣和进水的有机物共同脱除大约50%的氮元素(vanOostrom,1995; Newman et al., 2000)。
反硝化1 g NO3-N成为N2,相当于消耗BOD2.86g。
并且被发现当碳氮(质量比)小于2.3可以限制反硝化反应的速率。
无论如何,反硝化消耗的有机物在人工湿地结构的前端占有了主导位置,同时也导致了其后部有机物不足及反硝化效率低下。
所以,如果人工湿地结构一部分的氧气是足够完成NH3-N的硝化,那么氮的硝化反硝化联合路径可以被改良;同时也意味着在人工湿地结构的另一部分对于反硝化是厌氧且有机物充足的。
小型人工湿地结构处理乡镇生活污水是一门相对较新的技术,并且其物理、化学、生物的反应流程还没有完全弄清。
综合表面水平流、自由水流和表面垂直流的优缺点,可以合并这几种系统彼此互补。
这样可以产生低COD含量的出水,这种出水经过了完全硝化和部分反硝化,因此出水的总氮浓度会更低。
研究目的:1.评价新型人工湿地的性能,塔式复合人工湿地(THCW),尤其是在高水力负荷的情况下脱氮效率。
这种人工湿地结构设计通过瀑布形式的水流进行被动充氧从而提高废水中溶解氧浓度进而提高硝化速率,依靠直接在湿地中间部分加入原废水提高反硝化速率,从而促进硝化反硝化过程。
2.对于在人工湿地结构中常绿多年生木本植物和草本植物共同脱除氮的效率的评价,尤其是在冬季的阶段,且在湿地里植物的生长量对于氮的脱除是有帮助作用的。
3.研究表面水平流、自由水流相结合的系统是否在脱除和转化废水中污染物方面表现出更好的性能,尤其是脱氮方面。
2. 材料和方法2.1 系统描述我们研究队伍设计的人工湿地结构位于中国宁波某村。
它包括三个部分,容积按照四十人排量设计。
气候特点为年降水量1300-1400mm和累计年平均气温16.2℃。
极高极低值分别为38.8℃和-4.2℃。
较冷的时间段以十二月到二月为代表并且在这个时间段里出水比较接近于8℃(最低5℃)。
第一部分和第三部分8m长6m宽1.0m深。
反应床有三层构成,最底一层由厚20 cm的洗净的砾石(2–6 cm)构成,中间层由65 cm厚的细砂(0.5–2.0 cm)粒构成,最上层由15 cm厚的土壤(0.1–0.2 cm)构成。
底面坡度大约1%。
第三部分有三个环形的单元构成,直径分别为7m、5m和3m,由下向上每个0.6m深,表面积近似估算为38.5m2。
由顶部向低处单元的溢流会立即产生的瀑布似的紊流可以增大溶解氧含量和维持含氧条件。
图 1 塔式复合人工湿地水流示意图:1.进水区 2.塔式区 3.出水区 4.湿地植物 5.顶部环形区域 6.中部环形区域 7.底部环形区域 8.瀑布似溢流湿地结构的底部用高密度的聚乙烯作为衬里,环形区域则是要铺衬5cm厚的砌砖墙,为了防止污水的渗漏及污水与地下水混合。
由苗圃购得的池柏(Taxodium ascendens)的幼苗以间距0.8m间隔围绕整个湿地结构底部环形种植,湿地结构地层中部种植密度为56株/m2的蔺草(Schoenoplectus trigueter),于头年十一月种植第二年五月份收割。
在蔺草收获后的六至十月份,以9株/m2的种植密度种植野茭白(Zizania aquatica)。
在第二部分顶部的环形部分以近似6株/m2的种植密度种植睡莲(Nymphaea tetragona),在中间环形区域以的36株/m2种植密度种植香蒲(Typha angustifolia)。
表1 THCW进水和出水的物理化学特性80%的原污水不断的流入湿地结构的第一部分。
20%的污水由泵直接输入第二部分的环形结构最高层,溢流进入环形结构中间一层,之后流入最后一层。
此时第二部分处理污水与第一部分处理后的污水一起流入湿地结构的第三部分并最终由其排出。