波士顿咨询公司模板-56页精选文档
波士顿咨询公司模板.ppt

Too much information?
Proposed Contact Model
Team Leader
Plant
Remote TE
Customer
CSR
TE CAS
Proposed Organizational Structure VP, National Sales
Business Managers
• Several low value areas consume time • TSE time consumed by activities which could be handled more
efficiently by other resources • No sales growth from current model • Lots of opportunity to leverage other resources, like CAS • Most customers receptive to recommendations that allow us to
GM (%) 37.6 45.3 34.9 40.9 50.5 (9.9) 20.0 40.2
GM ($000) 958 2,400 827 624 641 (15) 138 5,573
GM % of Total 17.2 43.1 14.8 11.2 11.5 (0.3) 2.5 100
Messages are buried in the data
Competitor A
Won + Lost = Net
117
(61) 56)
290
(32) 258)
7
(50) (43)
波士顿咨询公司模板.ppt
(11) 98)
412
(149) 263)
---
---
---
98
(155) (57)
218
(97) 121)
0
(21) (21)
316
(273) 43)
102 75 26
312
1,866 1,334
(90) 12) (19) 56) (33) (7) (45) 267)
(677) 657)
Raw data only, no analysis presented to support the conclusion (hypothesis)
69 75 34 366
1,721 1,464
(99) (30)
(7) 68)
(31)
3)
(46) 320)
(570) 894)
Starting Base
Competitor B
Won + Lost = Net
91
(68) 23)
267
(19) 248)
5
(82) (77)
31
(37) (6)
109
leverage sales force time
Evaluate Alternatives:
Opportunities point to new contact model
Current Contact Model
Technical Assistance
Technical Assistance
Technical
5
Example
STRONG GROWTH IN OTHER PRODUCTS OFFSET BY PARTS’ DECLINE
波士顿咨询公司模型
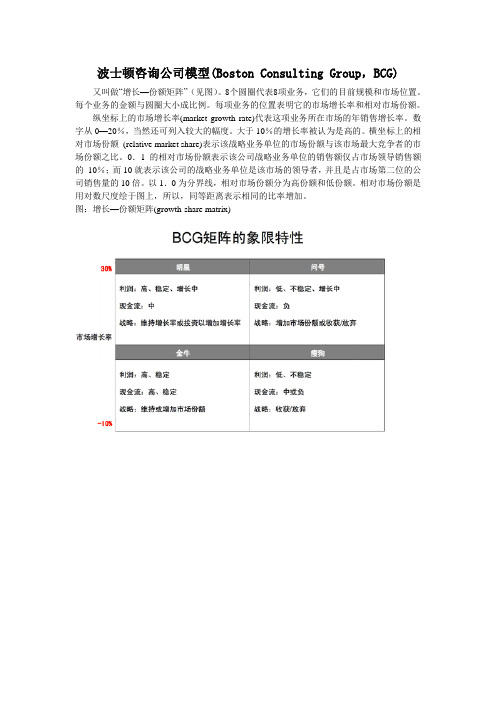
波士顿咨询公司模型(Boston Consulting Group,BCG)又叫做“增长—份额矩阵”(见图)。
8个圆圈代表8项业务,它们的目前规模和市场位置。
每个业务的金额与圆圈大小成比例。
每项业务的位置表明它的市场增长率和相对市场份额。
纵坐标上的市场增长率(market growth rate)代表这项业务所在市场的年销售增长率。
数字从0—20%,当然还可列入较大的幅度。
大于10%的增长率被认为是高的。
横坐标上的相对市场份额(relative market share)表示该战略业务单位的市场份额与该市场最大竞争者的市场份额之比。
0.1的相对市场份额表示该公司战略业务单位的销售额仅占市场领导销售额的10%;而10就表示该公司的战略业务单位是该市场的领导者,并且是占市场第二位的公司销售量的10倍。
以1.0为分界线,相对市场份额分为高份额和低份额。
相对市场份额是用对数尺度绘于图上,所以,同等距离表示相同的比率增加。
图:增长—份额矩阵(growth-share matrix)增长—份额矩阵分成四格,每格代表一类业务:1.问题类:市场增长率高而相对市场份额低的公司业务。
大多数业务都从问题类开始,问题类业务要求投入大量现金,因为公司必须添置厂房、设备和人员,以跟上迅速增长的市场需要,此外,它还要赶超领导者。
公司必须认真考虑是否要对它进行大量投资还是及时摆脱出来。
如图所示,该公司经营三项问题类业务,这似乎太多了些。
2.明星类:如果在问题类业务上经营成功,就变成明星。
明星类业务能给公司带来大量现金。
公司必须投大量金钱来维持市场增长率和击退竞争者的各种进攻。
明星类业务常常是现金消耗者而非现金生产者。
在图中,公司有两个明星类业务。
3.金牛类:当市场的年增长率下降到10%以下时,如果它继续保持较大的市场份额,明星类业务就成了金牛类业务。
这类业务为公司带来大量的现金收入。
由于市场增长率低,公司不必大量投资;同时,因为该业务是市场领导者,它还享有规模经济和较高利润率优势。
波士顿咨询公司模板.ppt-精选文档

3
WHAT PUZZLES YOU OR CHALLENGS YOU THE MOST WHEN WRITING SLIDES?
4
WRITING CLEAR, SUCCINCT, AND INTERESTING SLIDES
Good slides, bad slides How to use slides in a presentation How to choose among words, tables, graphics How to display information on slides effectively
GM % of Total 17.2 43.1 14.8 11.2 11.5 (0.3) 2.5
Total
13,863
100
(1.6)
40.2
5,573
100
Messages are buried in the data
Source: Annual Division Budget
6
Example
THE REDESIGN PROCESS INVOLVES FOUR DISCRETE STAGES
Analysis Extensive customer analysis • Customer service and support requirements Detailed internal diagnostic • Time spent by activity by responsibility • Capacity of the system Findings • Current contact model does not have capacity to serve all customers adequately • Several low value areas consume time • TSE time consumed by activities which could be handled more efficiently by other resources • No sales growth from current model • Lots of opportunity to leverage other resources, like CAS • Most customers receptive to recommendations that allow us to leverage sales force time Analysis: Identify opportunities
波士顿咨询公司模型

波士顿咨询公司模型在商业领域中,波士顿咨询公司模型(Boston Consulting Group Model,简称BCG模型)是一种经典的战略分析工具,它被广泛用于评估公司业务组合的竞争地位和潜在增长机会。
BCG模型通过将业务组合中的各个产品或业务划分到不同的象限中,帮助企业识别并重点管理不同业务单元的投资和资源分配。
BCG模型的核心是以产品市场占有率(Market Share)和市场增长率(Market Growth)为基准,将公司的业务单元分为四个象限:明星(Stars)、问题子弹(Question Marks)、现金奶牛(Cash Cows)和狗(Dogs)。
通过这种划分,企业可以获得对各个业务单元的全面了解,并制定相应的战略。
首先来看明星象限,这些业务单元通常有高市场增长率和高市场份额。
明星象限代表着公司的快速增长领域,这些业务既能够带来高收益,又需要大量的资本投入来维持增长。
在这一象限中,企业应该继续投入更多资源,以保持市场份额的增长,并推动业务的持续发展。
其次是问题子弹象限,这些业务单元通常有高市场增长率,但市场份额相对较低。
问题子弹象限代表着具有潜力但存在风险的业务领域,需要更多的市场调研和投资才能实现持续增长。
企业在这一象限中应该进行进一步的研究和分析,以确定如何最大化这些业务的增长潜力,并决策是否继续投入资源。
第三个象限是现金奶牛象限,这些业务单元通常有低市场增长率,但市场份额较高。
现金奶牛象限代表着公司的稳定现金流来源,这些业务单元可能已经进入到成熟阶段,并不需要大量的资本投入。
在这一象限中,企业可以通过降低成本、提高效率和推出增值服务等方式来最大化利润。
最后是狗象限,这些业务单元通常有低市场增长率和低市场份额。
狗象限代表着公司的低增长领域,这些业务可能已经失去竞争力或者没有明确的发展前景。
企业在这一象限中可以考虑退出或转型,以释放资源并集中精力发展其他更有前景的业务。
波士顿咨询公司模型的优势在于它简单易懂且易于实施。
咨询公司模板系列-波士顿55页56页PPT
Current Organizational Structure
Detailed internal diagnostic • Time spent by activity by responsibility • Capacity of the system
• Current contact model does not have capacity to serve all customers adequately
• From choosing the most appropriate slide type – words, tables, graphics
• To writing a slide that is clear and interesting
3
WHAT PUZZLES YOU OR CHALLENGS YOU THE MOST WHEN WRITING SLIDES?
GM (%) 37.6 45.3 34.9 40.9 50.5 (9.9) 20.0 40.2
GM ($000) 958 2,400 827 624 641 (15) 138 5,573
GM % of Total 17.2 43.1 14.8 11.2 11.5 (0.3) 2.5 100
Messages are buried in the data
ES
Assistance
CAS
Technical
TSE
Assistance
Price
Concessions
Expediting
DM
Price Concessions
Expediting
ቤተ መጻሕፍቲ ባይዱ
Customer
波士顿咨询公司模板.ppt 56页
efficiently by other resources • No sales growth from current model • Lots of opportunity to leverage other resources, like CAS • Most customers receptive to recommendations that allow us to
Lifter Bore (Volume)
179
91
60
30
Is the complexity necessary?
Note: Width of bar is proportional to CDGI
*Valuation ROI - 3y median CFROI
8
Sources: LRP; HOLT Value Model
GM (%) 37.6 45.3 34.9 40.9 50.5 (9.9) 20.0 40.2
GM ($000) 958 2,400 827 624 641 (15) 138 5,573
GM % of Total 17.2 43.1 14.8 11.2 11.5 (0.3) 2.5 100
Messages are buried in the data
382
(218) 164)
97
(218) (121)
79
(224) (145)
---
--- ---)
1
(55) (54)
世界知名咨询公司波士顿咨询公司的模板
efficiently by other resources • No sales growth from current model • Lots of opportunity to leverage other resources, like CAS • Most customers receptive to recommendations that allow us to
5
Example
STRONG GROWTH IN OTHER PRODUCTS OFFSET BY PARTS’ DECLINE
Product Alarm & detection Broad diffusion IR sensors Chloride Bulk chloride Parts Design Total
4
WRITING CLEAR, SUCCINCT, AND INTERESTING SLIDES
Good slides, bad slides How to use slides in a presentation How to choose among words, tables, graphics How to display information on slides effectively
leverage sales force time
Evaluate Alternatives:
Opportunities point to new contact model
咨询公司模板系列波士顿
波士顿咨询公司通过对制造业的产业链、技术创新和市场趋 势的研究,为制造业企业提供战略规划、运营优化、供应链 管理和智能制造等方面的咨询服务,推动企业转型升级,提 高生产效率和竞争力。
医疗保健行业案例
总结词
波士顿咨询公司为医疗保健机构提供战略咨询,助力医疗保健行业变革。
详细描述
波士顿咨询公司通过对医疗保健行业的政策环境、市场需求和竞争格局的研究,为医疗机构提供战略 规划、服务模式创新、运营管理和数字化转型等方面的咨询服务,助力医疗保健行业变革,提升患者 就医体验和服务质量。
对行业的价值
创新引领
波士顿咨询公司致力于引领行业创新,通过研究和实践前 沿理论和方法,推动行业的变革和发展。
01
行业规范
作为行业内的领军企业,波士顿咨询公 司积极参与制定行业规范和标准,推动 行业的健康和司拥有广泛的行业资源 和网络,通过资源整合和共享,促进 行业内企业的合作和共赢。
咨询公司模板系列波 士顿
目 录
• 波士顿咨询公司简介 • 波士顿咨询公司的咨询方法 • 波士顿咨询公司的案例研究 • 波士顿咨询公司的价值主张 • 波士顿咨询公司的未来展望
01
波士顿咨询公司简介
公司历史与发展
创立背景
波士顿咨询公司成立于1963年,由布鲁斯·亨德森创立,初衷是为 了提供战略咨询服务给当时的全球商业巨头。
总结词
波士顿咨询公司为金融机构提供战略 咨询,帮助企业提升竞争力。
详细描述
波士顿咨询公司通过对金融行业的深 入了解,为金融机构提供风险管理、 业务优化、组织变革和数字化转型等 方面的咨询服务,帮助企业提升竞争 力,实现可持续发展。
制造业案例
总结词
波士顿咨询公司为制造业企业提供战略咨询,推动企业转型 升级。
波士顿咨询报告
波士顿咨询报告概览:波士顿咨询报告,是一份对于企业在市场及竞争环境中的现状和发展策略做出分析和建议的深度咨询报告。
本次咨询报告对目标企业进行了深入的市场分析,针对企业的问题和优劣势提出了相应的解决方案和建议。
背景:下文所述的波士顿咨询报告是针对 ABC 公司的。
ABC 公司成立于 2005 年,总部位于美国硅谷。
ABC 公司专注于开发和销售智能硬件产品,包括智能家居、智能健康和智能可穿戴设备等。
随着智能硬件市场竞争的加剧,ABC 公司遇到了一些问题,需要寻求专业咨询来提升市场占有率和盈利能力。
分析:市场情况ABC 公司竞争对手众多,而公司产品在市场占有率和品牌知名度方面处于相对劣势。
经过市场调研,咨询师发现 ABC 公司的产品相较于竞争对手有明显的渠道缺失,缺乏真正意义的渠道覆盖。
ABC 公司应该通过寻找更广泛的销售渠道,来提升市场占有率和销售额。
产品定位ABC 公司的智能硬件产品定位虽然较为明确,但并没有得到有效宣传。
对比竞争对手,ABC 公司除了产品价格较为优惠外,品牌影响力较弱。
因此,ABC 公司应该对产品进行有效宣传,提升品牌影响力。
销售策略ABC 公司的销售策略过于单一,主要采用线上销售渠道。
虽然线上销售获得了较高的成交量,但线下经销商渠道的开发却相对滞后。
市场调研显示,ABC 公司的潜在客户多数喜欢到实体店购买产品。
因此,ABC 公司应该在线上和线下双管齐下,使整个销售渠道更为完善。
建议:根据针对 ABC 公司所做的市场分析,我们针对其问题和优势提出以下建议:1. 寻找更广泛的销售渠道,提升市场占有率和销售额2. 对产品进行有效宣传,提升品牌影响力3. 在线上和线下双管齐下,使整个销售渠道更为完善结论:ABC 公司在智能硬件市场中有很大的发展空间,只要采取合适的市场策略,扩大销售渠道,加强品牌宣传,并将线上与线下销售结合起来,就一定会取得更好的市场表现。
我们也相信,ABC 公司在未来一定会成为行业中的佼佼者。
- 1、下载文档前请自行甄别文档内容的完整性,平台不提供额外的编辑、内容补充、找答案等附加服务。
- 2、"仅部分预览"的文档,不可在线预览部分如存在完整性等问题,可反馈申请退款(可完整预览的文档不适用该条件!)。
- 3、如文档侵犯您的权益,请联系客服反馈,我们会尽快为您处理(人工客服工作时间:9:00-18:30)。
efficiently by other resources • No sales growth from current model • Lots of opportunity to leverage other resources, like CAS • Most customers receptive to recommendations that allow us to
1991 Sales ($000)
2,551 5,303 2,372 1,524 1,270
152 691 13,863
Sales % of Total
18.3 38.3 17.1 11.0
9.2 1.1 5 100
1987-91 CAGR (Real %) 31.9 10.9 13.8 (28.5) (4.0) (36.2) (2.9) (1.6)
Other Segments Segment 1 Segment 2 Segment 3 Segment 4
Total
Starting Base
Client
Won + Lost = Net
60
(98) (38)
198
(56) 142)
6
(52) (46)
25
(81) (56)
153
(29) 124)
Lifter Bore (Volume)
179
91
60
30
Is the complexity necessary?
Note: Width of bar is proportional to CDGI
*Valuation ROI - 3y median CFROI
8
Sources: LRP; HOLT Value Model
69 75 34 366
1,721 1,464
(99) (30)
(7) 68)
(31)
3)
(46) 320)
(570) 894)
Starting Base
Competitor B
Won + Lost = Net
91
(68) 23)
267
(19) 248)
5
(82) (77)
31
(37) (6)
109
1992 Product Family Profitability
CFROI (%)
12.0
9.7 8.3
Discount Rate 4.66%
Current Dollar G.I. ($M) Revenues ($M)
36”
555 349
10” 96”
19 35 17 19
0.85
0.02
14”
12”
1990 & 1991 Most Often Brand Switchers Within Last Three Years
9
Source: Continuous Tracking from Sample of 29,081; Consulting Analysis
WHAT DO YOU SEE IN A GOOD OR BAD SLIDES?
Competitor A
Won + Lost = Net
117
(61) 56)
290
(32) 258)
7
(50) (43)
30
(37) (7)
92
(11) 81)
419
(130) 289)
155
(98) 57)
---
---
---
224
(79) 145)
5
(19) (14)
384
(196) (188)
WRITING CLEAR AND INTERESTING SLIDES
2019,Shanghai
THE BOSTON CONSULTING GROUP
1
WRITING CLEAR AND INTERESTING SLIDES
2
TODAY’S OBJECTIVE
To give you the tools to write slides that communicate the results of our work in a way that helps clients understand, accept, and use those results This session will help you through the process of writing slides
Too much information?
Proposed Contact Model
Team Leader
Plant
Remote TE
Customer
CSR
TE CAS
Proposed Organizational Structure VP, National Sales
Business Managers
382
(218) 164)
97
(218) (121)
79
(224) (145)
---
--- ---)
1
(55) (54)
177
(497) (320)
2,836
62 110
22 324
1,137
(104) (29) (69) (72)
(1,087)
(42) 81) (47) 252)
50)
Starting Base
11
SLIDES ARE VISUAL AIDS
Focus the audience’s attention on message • Help explain the message • Provide another means for the audience to process the information • Reinforce the message–aid to memory
ES
Assistance
CAS
Technical
TSE
Assistance
Price
Concessions
Expediting
DM
Price Concessions
Expediting
Customer
Ordering ASP selling/implementation ISP selling Quoting/cross-referencing Expediting Technical assistance in person Rotational calls Availability
(10) Telemarketing
TSRs
CSRs (65)
(13)
Latrobe Telemarketing
(9)
ES District Managers
(6)
District Managers
(30)
ESs
TSEs (186)
(46)
TSRs (23)
CAS Manager
(1)
CAS Reps (4)
Good slides are:
Bad slides are:
We will revisit toward the end of the session
10
WRITING CLEAR, SUCCINCT, AND INTERESTING SLIDES
Good slides, bad slides How to use slides in a presentation How to choose among words, tables, graphics How to display information on slides effectively
Availability Quoting ISP cross-referencing Ordering Price concessions Expediting
Price Concessions
Group
Ordering
Quoting Availability
Price concessions
CSR Expediting
4
WRITING CLEAR, SUCCINCT, AND INTERESTING SLIDES
Good slides, bad slides How to use slides in a presentation How to choose among words, tables, graphics How to display information on slides effectively
Source: Annual Division Budget
6
Example
THE REDESIGN PROCESS INVOLVES FOUR DISCRETE STAGES
Analysis
Findings
Analysis: Identify opportunities
Extensive customer analysis • Customer service and support requirements
Detailed internal diagnostic • Time spent by activity by responsibility • Capacity of the system