光学外文文献及翻译
光学中英文 光学书籍_期刊介绍

序号关键词书名作者1成像C语言成像与光线追踪程序设计2成像成像跟踪技术导论杨宜禾,周维真著3成像成像光学王之江,伍树东著4成像成像过程的机理和应用雅各布森(K.I.Jacobeon),中国科学技术情报研究所编5成像出国参观考察报告 第六届光电成像器件会议6成像磁共振成像系统的原理及其应用赵喜平编著7成像共焦显微术的三维成像原理(澳)M.顾(Min Gu)著 王桂8成像光电成像原理邹异松等编著9成像光电子成像器件原理向世明,倪国强编著10成像脑磁共振波谱成像[巴西]LARA A.BRANDAO RO11成像热成像张维力,宋广礼编著12成像随机介质中光的传播与成像张逸新编著13成像微波成像术张直中著14成像微光与红外成像技术张敬贤等编著15成像现代成像系统徐之海,李奇16成像遥感成像原理及图像特征张 庸主编17成像医学成像技术杨国忠编著18成像医学成像技术霍纪文,王秀章主编19成像医学成像系统(美)A.马科夫斯基(Albert20成像医学数字成像技术胡军武主编21辐射电磁波与幅射系统Е.с.约敦22辐射光点幅射韩森林著23辐射光幅射测量原理与技术李振国, 魏 青主编24辐射核幅射测量歇普(J.Sharpe)著 钱景华25辐射红外幅射测量基础周书铨编26辐射研究幅射的电子学方法苏)萨宁(А.А.Санин)著 忻贤李旭主编27光电21世纪高职高专电子信息系列规划教材 光电28光电半导体光电化学(苏)古列维奇(Гуревнч,Ю.Я29光电半导体光电器件田等先编著30光电半导体光电器件及其应用上海无线电十七厂编辑31光电半导体光电器件及其应用上海无线电十七厂32光电半导体光电器件及其应用潘天明编著33光电场助半导体光电阴极理论与实验李晋闽著中国科学技术情报研究所编34光电出国参观考察报告 第六届光电成像器件会议35光电大气中之光电现象(日)国富信一著 沈懋德译36光电电子发射与光电阴极刘元震等编著37光电短程光电测距仪的应用毛能武编38光电短程光电测距仪和激光定位仪及其应用清华大学测量教研组编39光电多碱光电阴极 机理、特性与应用常本康著40光电分子材料 光电功能化合物游效曾著41光电钢中磷的光电比色测定法中国科学院化工冶金研究所42光电高等学校教材 光电材料黄书万编43光电光电、红外、比色温度计原理与检定李吉林等编44光电光电倍增管陈成杰,徐正卜著45光电光电倍增管( )W.哈特曼,( )F.伯恩哈46光电光电比色计和分光光度计方国铭,胡国成编著47光电光电比色计与分光光度计王 洁编著48光电光电测距张坤宜编著49光电光电测距仪(苏)康德拉什科夫(А.В.Кондр50光电光电测距仪实用检测新方法黄伟明著51光电光电测距应用技术毛能武等编著52光电光电测量何照才主编 中国人民解放53光电光电测试技术张广军主编54光电光电测试技术范志刚主编55光电光电测试仪器原理及应用[苏]Л.А.诺维茨基主编56光电光电成象器件及其应用张彤57光电光电成像原理邹异松等编著58光电光电传感器及其应用何勇59光电光电导物理及其应用应根裕编著60光电光电电路赵宏图61光电光电电子线路胡士凌,孔得入编著62光电光电对抗技术李世祥编著63光电光电对抗――信息武器徐起编著64光电光电发射材料 制备、特性与应用美)萨默(A.H.Sommer)著 侯65光电光电功能超薄膜黄春辉66光电光电管与光电倍增管史玖德编著67光电光电惯性技术杨培根等编著68光电光电化学太阳能转换(俄)波利斯科夫(Плесков,Ю69光电光电技术孙培懋,刘正飞编70光电光电技术刘振玉编71光电光电技术缪家鼎等编著72光电光电技术实验刘振玉主编73光电光电技术实用电路精选杨家德主编74光电光电技术与实验江月松75光电光电检测技术雷玉堂等编著76光电光电检测技术高稚允,高 岳编著77光电光电检测技术罗先和编著78光电光电检测技术钱浚霞79光电光电检测控制电路手册赵负图主编80光电光电检测原理及应用 上册秦积荣81光电光电检测原理及应用 下册秦积荣82光电光电检测原理及应用 中册秦积荣83光电光电接口器件手册庞振泰等译84光电光电接收器件及其应用张彤85光电光电精密仪器设计殷纯永86光电光电控制模型敏光编著曲维本,刘铁墉编87光电光电耦合器的原理及其在电子线路中的应用88光电光电器件方如章,刘玉凤编89光电光电器件沈塘和编90光电光电器件概论汤定元等编91光电光电器件和光学成像技术[英]D.A.罗斯92光电光电器件手册刘仁昌93光电光电世界刘建宇, 魏巍主编94光电光电探测技术 [修订版]王清正等编著95光电光电探测技术及应用卢春生编著96光电光电统计理论与技术周仁忠,阎吉祥编著97光电光电图像处理刘文耀等编著98光电光电图像处理竺子民[著]99光电光电微光摄影技术H.V.索尔著 王顺德译100光电光电位移精密测量技术叶盛祥编著101光电光电物理基础姜节俭编102光电光电系统与信号处理叶嘉雄等编著103光电光电显示器件手册(日)奥下博昭等著 庞振泰104光电光电线缆检测技术方建成等主编105光电光电线缆制造技术王家祥主编106光电光电信号检测吴 杰编107光电光电信号检测原理与技术赵远,张宇主编108光电光电信息处理系统 李志能,叶旭?妆嘀?109光电光电信息技术杨永才等编著110光电光电信息转换器苏)普列斯努欣111光电光电仪器质量问题文集中国科学院长春光机所情报112光电光电元器件速查代换大全庄跃辉113光电光电整纬装置何绍东,陈 梁编114光电光电直读光谱分析 (试用本)上海第五钢铁厂研究所115光电光电装置(理论与计算基础) A.B.巴甫洛夫国家科委高技术计划信息领116光电光电子器件与微电子光电子系统集成技术论117光电光电自动器及其应用(苏)克利敏契耶夫著 滕砥118光电光电自准直仪及其应用蔡淑璋, 景芳盛编著119光电国内外半导体光电器件实用手册中国光学、光电子行业协会120光电国内外半导体光电器件实用手册中国光学、光电子行业协会121光电汉英光电技术词汇杨培根122光电红外光电探测器及其材料万欣等编译123光电激光电源电路梁国忠,梁作亮编著124光电激光光电检测吕海宝等编著125光电激光光电仪器设计基础(苏)Ю.М.克利姆科夫著 王诚华译126光电集成光电器件和系统[英]D.A.罗斯127光电集成光电器件和系统(英)诺布尔(P.J.W.Noble)128光电金属陶瓷薄膜及其在光电技术中的应用孙大明,孙兆奇著129光电近代光电工程导论林宸生130光电军用光电系统高稚允等编著131光电实用光电技术李庆祥132光电实用光电控制电路精选陈尔绍等编(美)劳申巴赫(Rauschenba133光电太阳电池阵设计手册 光电能转换原理及其应闵乃本主编134光电探索新晶体 光电功能材料的结构、性能、分135光电微光电视蒋先进编136光电微机在光电技术中的应用辛德胜,申铉国编著137光电现代光电测试技术顾文郁138光电现代光电器件技术及应用宋丰华编著139光电现代空间光电系统及应用宋丰华编著140光电现代空间光电信息处理技术及应用宋丰华编著141光电象管与其它光电器件严增濯主编142光电真空光电器件(苏)别尔可夫斯基著 徐正143光电智能光电系统王永仲等编著144光电中国核科技报告 铀矿地勘测量中光电测距仪吴景勤陈朝晖145光电中国科学院博士学位研究生学位论文 新型无曹亚安146光电中国科学院感光化学研究所博士后研究工作147光谱x光光谱分析之原理与应用何文祥译148光谱X射线光谱分析谢忠信等编著149光谱X射线光谱分析的原理和应用(美)伯廷(E.P.Bertin)著150光谱X射线荧光光谱分析吉昂等编著151光谱玻璃的光学和光谱性质干福熹著辛仁轩编著152光谱等离子体发射光谱分析(原子光谱分析技术153光谱地球资源的多光谱摄影术(美)温德罗斯(S. Wendero154光谱分子光谱 [英文版][美]Jeanne L.McHale[著]155光谱分子光谱与激光钟立晨, 丁海曙著156光谱付里叶变换红外光谱的应用研究荆煦瑛主编157光谱傅里叶变换光谱(法)盖拉维利(Guelachvil尼高力FTIR中国用户协会编158光谱傅立叶变换红外光谱技术及应用研讨会论文159光谱高光谱遥感及其应用浦瑞良,宫鹏著160光谱光电直读光谱分析 (试用本)上海第五钢铁厂研究所161光谱光电子统计学及光谱与光通讯应用(美)塞勒(Saleh,B.)著 韩162光谱光谱导论唐纳德 L. 帕维亚 加里 M163光谱光谱分析(苏)罗蒙诺索娃,Л.С.,(苏)法尔科164光谱光谱分析常识高铮德 刘湘生等编著165光谱光谱分析法实验与习题郭德济主编166光谱光谱分析讲义冶金工业部钢铁研究院分析167光谱光谱光度测量与标准李在清著168光谱光谱仪器(苏)塔拉索夫(К.И.Тарасов169光谱光谱仪器 第二辑上海市仪表电讯工业局技术情报所,第170光谱光谱仪器 第一辑上海市仪表电讯工业局技术情报所,第171光谱光谱仪器设计吴国安著172光谱光谱仪器学林 中,范世福编173光谱光谱仪器原理李全臣,蒋月娟编著174光谱光声光谱法的原理和应用《光谱学与光谱分析》编辑175光谱光声光谱法及其应用(日)泽田嗣郎编 赵贵文等176光谱航天多光谱遥感韩心志编著177光谱红外光谱谢晶曦编著178光谱红外光谱法董庆年编179光谱红外光谱法入门钟海庆编180光谱红外光谱分析与新技术张叔良等编著181光谱红外光谱实用指南荆煦瑛等编著182光谱红外光谱在有机化学和药物化学中的应用谢晶曦, 常俊标, 王绪明编183光谱红外与拉曼光谱的计算原理与计算程序 (上胡皆汉 王国祯编著184光谱红外与拉曼光谱的计算原理与计算程序 (下胡皆汉 王国祯编著185光谱激光光谱分析法朱贵云,杨景和编著186光谱激光光谱分析法朱贵云,杨景和编著187光谱激光光谱技术概况北京光电技术研究所编辑188光谱近代傅里叶变换红外光谱技术及应用(上卷吴瑾光吴瑾光189光谱近代傅里叶变换红外光谱技术及应用(下卷190光谱近红外光谱分析基础与应用严衍禄主编191光谱近红外光谱及其在石油产品分析中的应用冯新泸,史永刚编著192光谱滤波差分法测量软X光谱江少恩,孙可煦[著]193光谱群论与光谱夏上达编著194光谱实用红外光谱解析卢?踩?,邓振华编195光谱无机和配位化合物的红外和拉曼光谱(日)中本一雄著 黄德如,汪196光谱稀土光谱理论张思远, 毕宪章著197光谱现代光谱分析手册万家亮编著198光谱现代近红外光谱分析技术陆婉珍等编著199光谱旋光谱和圆二色光谱(英)勒格朗(Legrand,M.),地质部情报研究所200光谱遥感专辑(第一辑) 矿物岩石的可见――中201光谱有机光谱分析张正行主编202光谱有色金属光谱分析方法《有色金属光谱分析方法》203光谱原子结构与原子光谱郑乐民,徐庚武编著204光谱中国污染水体光谱特征赵冬至,刘玉机主编205光谱紫外光谱在有机化学中的应用 上册黄 量,于德泉编著206光谱紫外光谱在有机化学中的应用 下册黄 量,于德泉编著207光纤存储区域网络设计:实现光纤通道和IP SAN[美]TOM CLARD208光纤单模光纤原理设计及应用[法]L.B.津霍姆著209光纤非线性光纤光学原理及应用(美)Govind P.Agrawal210光纤高速光纤计算机网络 FDDI窦文华211光纤光电子学与光纤传感器技术王玉田212光纤光纤测量与传感技术孙圣和213光纤光纤测量原理(美)马库塞214光纤光纤测试白崇思215光纤光纤传感技术张国顺216光纤光纤传感技术与应用王惠文217光纤光纤传感技术与应用郭凤珍218光纤光纤传感技术在大坝工程中的应用蔡德所219光纤光纤传感器(英)[B.卡尔肖]Brian220光纤光纤传感器及其应用刘瑞复221光纤光纤传感器技术手册徐予生222光纤光纤传感器入门(日)概本俊雄编223光纤光纤传感器译文集中国科学院安徽光机所224光纤光纤传感器译文集光纤传感技术情报协作网南225光纤光纤传感器原理张志鹏226光纤光纤传感与信号处理(英)卡尔肖227光纤光纤传感原理与应用技术崔三烈228光纤光纤传输系统杨祥林229光纤光纤传输系统(美)珀松尼克230光纤光纤传输系统设计张 煦231光纤光纤电视传输技术林如俭232光纤光纤干涉测量技术孟克生233光纤光纤孤子理论基础黄念宁234光纤光纤孤子通信理论基础杨祥林235光纤光纤光导分光光度计庄维新等236光纤光纤光缆的设计和制造陈炳炎237光纤光纤光缆工程测试胡先志238光纤光纤光学刘德明239光纤光纤光学廖延彪240光纤光纤和光器件的测量(意)坎切列里241光纤光纤激光器和放大器技术聂秋华242光纤光纤技术及其应用刘德明243光纤光纤技术及应用彭吉虎244光纤光纤技术在电工领域中的应用管喜康245光纤光纤接入网技术李勇246光纤光纤理论与测量周树同247光纤光纤理论与技术曾甫泉248光纤光纤区域网原理与设计屠世桢249光纤光纤视频传输技术白玉琨250光纤光纤数字通信技术解金山251光纤光纤数字通信技术解金山252光纤光纤数字通信接收机杨恩泽253光纤光纤数字通信实用基础纪越峰254光纤光纤数字通信系统及测试李学林255光纤光纤通信:通信用光纤、器件和系统(美)巴斯256光纤光纤通信用光电子器件和组件黄章勇257光纤光纤通信用光电子器件制作工艺基础黄章勇258光纤光纤通信用无源器件译丛 (3)四机部1423研究所情报室编259光纤光纤通信用无源器件译丛 (4) 四机部1423研究所情报室编260光纤光纤通信用新型光无源器件黄章勇261光纤光纤通信与光纤传感赵仲刚262光纤光纤通讯系统:原理与应用吴曜东263光纤光纤陀螺仪(法)Herve C. Lefevre 264光纤光纤系统―工艺、设计与应用(美)高锟著265光纤光纤用户传输网解金山266光纤光纤有线电视技术 (基础教材)韩伟267光纤光纤有线电视系统吕海涵268光纤光纤与光缆技术吴平269光纤光纤原理与技术姚建永270光纤光纤智能结构涂亚庆271光纤光纤智能结构涂亚庆272光纤激光与光纤李福利273光纤聚合物光纤江源274光纤宽带城域光纤网络技术周承刚275光纤摩托罗拉光电光纤器件手册美国摩托罗拉公司[美]摩托罗拉公司276光纤摩托罗拉光电光纤器件手册 第八章 槽型光[美]摩托罗拉公司277光纤摩托罗拉光电光纤器件手册 第二章 质理与[美]摩托罗拉公司278光纤摩托罗拉光电光纤器件手册 第九章 纤维光[美]摩托罗拉公司279光纤摩托罗拉光电光纤器件手册 第六章 功率光[美]摩托罗拉公司280光纤摩托罗拉光电光纤器件手册 第七章 分立发[美]摩托罗拉公司281光纤摩托罗拉光电光纤器件手册 第十二章 附录[美]摩托罗拉公司282光纤摩托罗拉光电光纤器件手册 第十一章 应用[美]摩托罗拉公司283光纤摩托罗拉光电光纤器件手册 第十章 发射器[美]摩托罗拉公司284光纤摩托罗拉光电光纤器件手册 第四章 光电隔[美]摩托罗拉公司285光纤摩托罗拉光电光纤器件手册 第五章 SOIC-8286光纤摩托罗拉光电光纤器件手册 第一章 概述[美]摩托罗拉公司(美) Chris Beauchamp287光纤使用Brocade光纤交换机建立SAN存储区域网288光纤通信光纤(日)大越孝敬等289光纤网络架设DIY 光纤、无线网络加强版谢志锋290光纤信息、通信、光纤方华飞291光纤英汉光通信光纤技术辞典龙赞易292光纤有线电视模拟―数字光纤与微波传输技术范寿嗣293光信息光信息存储的原理、工艺及系统设计戎霭伦等著294光信息光信息通信技术实用手册[日]光信息通信技术手册295光信息光信息网络日本映像信息媒体学会组编296光信息光信息综合实验郑光昭编著297光学《光学教程》学习指导宣桂鑫,王 尉298光学2000年的光学帕辛诺林诗彬299光学2000年青年光学学术讨论会暨院士报告会论300光学X光学手册苏达立 徐行敏301光学X射线光学在固体领域中的应用奎瑟302光学半导体导波光学器件理论及技术赵策洲303光学半导体导波光学器件理论及技术赵策洲304光学半导体光学性质沈学础305光学半导体光学性质莫斯,T.S.著 鲍友恭等译306光学半导体集成光学刘式墉307光学半导体纳米材料的非线性光学性质余保龙308光学半导体纳米材料的非线性光学性质余保龙309光学半导体纳米晶体的光学性质S. V. Gaponenko310光学变焦距光学系统设计陶纯堪311光学兵器工业科学技术辞典?光学工程《兵器工业科学技术辞典》312光学波动光学久保田广313光学波动光学赵达尊,张怀玉314光学波动过程、光学、核物理学(苏)齐楚林,А.А.著 万山,苏耀中315光学波动过程、光学、原子物理与核物理基础苏)齐楚林,А.А.著316光学波动过程光学核物理学[苏联]A?A?齐楚林著 万山 苏耀中译317光学波运过程、光学、原子物理与核物理基础[苏联]A.A.齐楚林318光学玻璃的光学和光谱性质干福熹319光学玻璃工艺学 光学零件之特殊加工А.Н.БАРДИН闫珂柱320光学玻色-爱因斯坦凝聚体形成的动力学和光学性闫珂柱321光学玻色-爱因斯坦凝聚体形成的动力学和光学性322光学薄膜光学 理论与实践尹树百323光学薄膜光学与技术唐晋发,顾培夫324光学不透明矿物晶体光学王曙325光学蔡司光学经纬仪的检修张凤利326光学蔡司型光学经纬仪的检修上海市城市建设局测量总队327光学测角光学仪器的调整与修理(苏)埃尔瓦伊斯(А.В.Эрвайс328光学测量仪器的光学设计与制造(苏)沃洛诺夫(Р.В.Воронов329光学常用的光学仪器薛桢330光学常用光学量仪顾励生331光学常用光学量仪顾励生332光学超快光学文集阮双琛333光学超快光学文集阮双琛334光学成像光学王之江335光学成像光学王之江兰茨别尔格,Г.С336光学初等物理学 第三卷 振动和波、光学和原子337光学传输光学(美)马库塞338光学传输光学(美)马库塞339光学磁光学刘公强340光学磁光学刘公强341光学大学物理 第三册 光学与量子物理周勇志342光学大学物理教程 光学蔡峰怡343光学大学物理教程 光学蔡峰怡344光学大学物理实验 光学部分亚沃尔斯基345光学大学物理手册 第四分册 声学、光学和电磁346光学大学物理学 第四册 波动与光学张三慧347光学大学物理学 第四册 光学、近代物理张三慧,史田兰348光学大学物理学 振动、波动与光学杨仲耆349光学大学用书 应用光学彭?淇?350光学带电粒子束光学吕建钦351光学单模纤维光学原理与应用热纳奥姆352光学导波光学范崇澄,彭吉虎353光学导波光学传感器:原理与技术靳伟 廖延彪 张志鹏354光学导波光学物理基础佘守宪355光学德英中光学和光学仪器词典356光学地球自转参数的重新归算 根据1962.0~1982.0光学天文学观测357光学第二届全国高速摄影与光学学会议论文集《第二届全国高速摄影与光358光学电磁场及电离子光学系统数值分析储璇雯359光学电磁场及电离子光学系统数值分析储璇雯360光学电光学手册美国无线电公司编 史斯,伍361光学电化学中的光学方法林仲华362光学电化学中的光学方法林仲华363光学电视中的电子光学楚喀尔曼364光学电学光学原子物理学问题介绍物理通报编委会365光学电影放映光学(苏)拉帕乌里(А.А.Лапаури366光学电影光学包学诚367光学电影摄影物镜光学设计电影镜头设计组368光学电子光学杜秉初369光学电子光学赵国骏370光学电子光学华中一,顾昌鑫371光学电子光学应根裕372光学电子光学卢斯特霍兹,A.A373光学电子光学成都电讯工程学院374光学电子光学(苏)喀尔曼(В.М.Кельман) 375光学电子光学苏联)范利白(Вайнриб,Е.А376光学电子光学基础陈文雄,西门纪业377光学电子光学计算机辅助设计童林夙378光学电子光学计算机辅助设计童林夙379光学电子光学教程任晴科380光学电子光学理论基础谢曼(О.И.Семан) 381光学电子光学应用肖士璋,冉启钧382光学电子光学正则理论与束流计算西门纪业383光学电子和离子光学原理及象差导论西门纪业384光学电子离子光学 《电子光学》第3版赵国骏385光学电子离子光学计算机辅助设计孙伯尧,汪健如386光学电子离子光学仪器原理邵健中387光学电子显微镜与电子光学黄兰友,刘绪平388光学动手动脑学物理 光学沈华,高立民389光学对称光学系统的象差W.T.韦尔福特390光学二元光学金国藩391光学二元光学金国藩392光学反射棱镜共轭理论 光学仪器的调整与稳象连铜淑393光学反射棱镜共轭理论 光学仪器的调整与稳象连铜淑394光学非成象聚光器光学 光和太阳能威尔福德395光学非成象聚光器光学光和太阳能W.T.威尔福德 R.维恩斯顿396光学非线性光纤光学原理及应用(美)Govind P.Agrawal397光学非线性光纤光学原理及应用(美)Govind P.Agrawal398光学非线性光学范琦康399光学非线性光学布洛姆伯根400光学非线性光学过巳吉401光学非线性光学王奎雄402光学非线性光学李荫远,杨顺华403光学非线性光学费浩生404光学非线性光学 原理与进展钱士雄405光学非线性光学 原理与进展钱士雄406光学非线性光学和材料阿雷克(Arecchi,F.T.)407光学非线性光学晶体材料科学张克从,王希敏408光学非线性光学频率变换及激光调谐技术姚建铨409光学非线性光学原理 上册沈元壤著 顾世杰译410光学非线性光学原理 下册沈元壤著 顾世杰411光学非线性与量子光学谭维翰412光学非线性与量子光学谭维翰413光学非线性与量子光学谭维翰杭州大学化学系分析化学教414光学分析化学手册 第三分册 电化学分析与光学杭州大学化学系分析化学教415光学分析化学手册 第三分册 电化学分析与光学416光学分子非线性光学的理论与实践叶 成417光学分子非线性光学的理论与实践叶 成418光学傅里叶光学卞松玲419光学傅里叶光学游明俊420光学傅里叶光学吕乃光421光学傅里叶光学 基本概念和习题422光学傅里叶光学导论J.W.顾德门。
光谱学_文献翻译
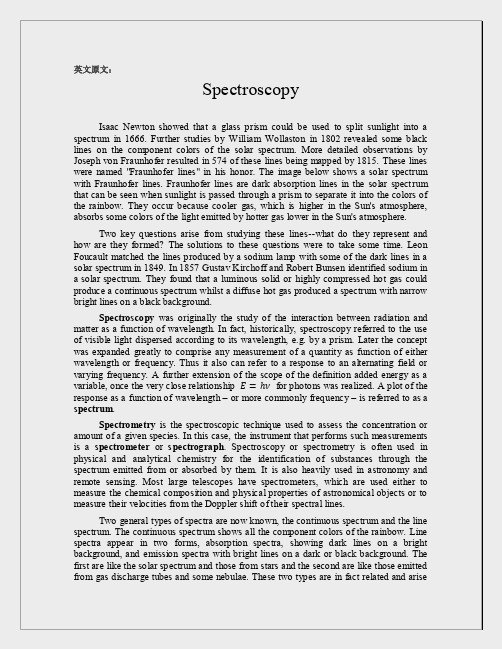
英文原文:SpectroscopyIsaac Newton showed that a glass prism could be used to split sunlight into a spectrum in 1666. Further studies by William Wollaston in 1802 revealed some black lines on the component colors of the solar spectrum. More detailed observations by Joseph von Fraunhofer resulted in 574 of these lines being mapped by 1815. These lines were named "Fraunhofer lines" in his honor. The image below shows a solar spectrum with Fraunhofer lines. Fraunhofer lines are dark absorption lines in the solar spectrum that can be seen when sunlight is passed through a prism to separate it into the colors of the rainbow. They occur because cooler gas, which is higher in the Sun's atmosphere, absorbs some colors of the light emitted by hotter gas lower in the Sun's atmosphere.Two key questions arise from studying these lines--what do they represent and how are they formed? The solutions to these questions were to take some time. Leon Foucault matched the lines produced by a sodium lamp with some of the dark lines in a solar spectrum in 1849. In 1857 Gustav Kirchoff and Robert Bunsen identified sodium in a solar spectrum. They found that a luminous solid or highly compressed hot gas could produce a continuous spectrum whilst a diffuse hot gas produced a spectrum with narrow bright lines on a black background.Spectroscopy was originally the study of the interaction between radiation and matter as a function of wavelength. In fact, historically, spectroscopy referred to the use of visible light dispersed according to its wavelength, e.g. by a prism. Later the concept was expanded greatly to comprise any measurement of a quantity as function of either wavelength or frequency. Thus it also can refer to a response to an alternating field or varying frequency. A further extension of the scope of the definition added energy as a variable, once the very close relationship E=ℎνfor photons was realized. A plot of the response as a function of wavelength – or more commonly frequency – is referred to as a spectrum.Spectrometry is the spectroscopic technique used to assess the concentration or amount of a given species. In this case, the instrument that performs such measurements is a spectrometer or spectrograph. Spectroscopy or spectrometry is often used in physical and analytical chemistry for the identification of substances through the spectrum emitted from or absorbed by them. It is also heavily used in astronomy and remote sensing. Most large telescopes have spectrometers, which are used either to measure the chemical composition and physical properties of astronomical objects or to measure their velocities from the Doppler shift of their spectral lines.Two general types of spectra are now known, the continuous spectrum and the line spectrum. The continuous spectrum shows all the component colors of the rainbow. Line spectra appear in two forms, absorption spectra, showing dark lines on a bright background, and emission spectra with bright lines on a dark or black background. The first are like the solar spectrum and those from stars and the second are like those emitted from gas discharge tubes and some nebulae. These two types are in fact related and arisedue to quantum mechanical interactions between electrons orbiting atoms and photons of light. Photons of light each have a specific frequency. The energy of a photons is a function of its frequency and is determined by E=ℎν, where νis the frequency of the photon, E is the energy and ℎis Planck's constant which is equal to 6.626×10⁻³⁴J∙s.An electron orbits a nucleus in a stable energy level. If a photon of a specific frequency interacts with the electron, it can gain sufficient energy to "jump up" one or more levels. The photon is absorbed by the electron so cannot continue on to be detected by an observer. The electron then "de-excites" and jumps back down to a lower energy orbit, emitting a photon of specific frequency. This photon, however, could be emitted in any direction, not just in the same direction as the original incident photon. This is sown schematically in the diagram Fig.30-2.The Swiss school teacher, Johann Balmer in 1885 developed an empirical formula that determined the wavelengths of the four visible lines in hydrogen's spectrum. Five years later the Swedish physicist, Johannes Rydberg expanded Balmer's formula to apply to some other elements. The Danish physicist, Niels Bohr, finally provided an explanation as to how spectral lines formed in the 1920s.His work relied on quantum physics and the concept of energy shells or orbits for electrons.The Balmer Series of visible lines for atomic hydrogen are caused by transitions from the n=2orbit to and from higher orbits. The Lyman Series involves transitions down to the n=1orbit and involve higher frequency photons in the UV region whilst the Paschen Series (to n=3) produces IR spectral lines. The number of spectral lines that can be produced is vast given the permutations of atoms, molecules and orbital transitions possible.中文译文:光谱学1666年,艾萨克·牛顿发现可以用玻璃棱镜把太阳光转换成一个光谱。
光学传感器毕业论文中英文文献及翻译

英文文献及中文翻译一种精确测量倾斜角度的光学传感器摘要本文主要介绍了一种新型光学传感器,它可以同时准确地测量倾斜角或两轴倾斜角度。
这种传感器是基于激光干涉原理,因此具有很高的精度。
设计制作了一个传感器的模型来论证这个新的方法,这是一个光电传感器,传感器中没有移动的部分。
由正交于铅垂面的流动水平面提供参考面。
传感器和绝对水平面之间的角度随着被测量的物体倾斜而改变,这些变化反映在条纹图案的中心位置的转移方式。
不同的干涉条纹的中心位置随倾斜角的变化而改变。
干涉条纹图案进行记录和处理,转化为两轴、水平和垂直倾斜角度。
当使用1024*1024像素的传感器时,测量范围为700弧秒,其精度可高达+/ - 1弧秒。
关键词:倾斜角度传感器,倾斜仪,激光干涉I 介绍市场上目前有几种类型的商业倾斜角度测量传感器。
有些是角度传感器,有些是倾斜仪,它们的工作原理不同。
电解液体、电容和钟摆是现在大多数倾斜角度传感器和倾斜仪的三个主要工作原理。
在这里,我们提出了一种新的光学方法,建立了一个用激光、光学元件和图像传感器的光电传感器,它可以同时做精确的倾斜角度测量,不需要进行机械的移动,其工作原理是基于光学干涉,相干激光作为光源。
光线通过一个装满液态油的玻璃油盒。
由正交于铅垂面的流动水平面提供参考面。
当激光束穿过油箱有两束光线反射回来,一束是液体的表面产生的,另一束是容器玻璃产生的,干涉条纹就是由这两条光线形成的,条纹图案将随着倾斜角度的变化产生相应的变化,条纹图案采集和处理后将反映倾斜角度信息,光学工作原理使它不受磁场的影响。
该传感器可以同时测量两轴倾角。
流动的水平面确保了参考面是一个绝对的水平面。
高灵敏度光学干涉测量原理,保证了较高的精度。
II 原理图1说明了工作原理示意图,O点是光线扩大镜头的焦点,O点可以看作是点光源,它发出球面波。
由于地球重力的影响,液体油面始终保持水平,因此用油面作为参考平面。
该容器是玻璃材料的。
当传感器被放在目标表面时,其底部表面将连同目标对象一起倾斜。
(完整word版)光学外文文献及翻译

学号2013211033 昆明理工大学专业英语专业光学姓名辜苏导师李重光教授分数导师签字日期2015年5月6日研究生部专业英语考核In digital holography, the recording CCD is placed on the ξ-ηplane in order to register the hologramx ',y 'when the object lies inthe x-y plane. Forthe reconstruction ofthe information ofthe object wave,phase-shifting digital holography includes two steps:(1) getting objectwave on hologram plane, and (2) reconstructing original object wave.2.1 Getting information of object wave on hologram plateDoing phase shifting N-1 times and capturing N holograms. Supposing the interferogram after k- 1 times phase-shifting is]),(cos[),(),(),,(k k b a I δηξφηξηξδηξ-⋅+= (1) Phase detection can apply two kinds of algorithms:synchronous phase detection algorithms [9]and the least squares iterative algorithm [10]. The four-step algorithm in synchronous phase detection algorithm is in common use. The calculation equation is)2/3,,(),,()]2/,,()0,,([2/1),(πηξπηξπηξηξηξiI I iI I E --+=2.2 Reconstructing original object wave by reverse-transform algorithmObject wave from the original object spreads front.The processing has exact and clear description and expression in physics and mathematics. By phase-shifting technique, we have obtained information of the object wave spreading to a certain distance from the original object. Therefore, in order to get the information of the object wave at its initial spreading position, what we need to do is a reverse work.Fig.1 Geometric coordinate of digital holographyexact registering distance.The focusing functions normally applied can be divided into four types: gray and gradient function, frequency-domain function, informatics function and statistics function. Gray evaluation function is easy to calculate and also robust. It can satisfy the demand of common focusing precision. We apply the intensity sum of reconstruction image as the evaluation function:min ),(11==∑∑==M k Nl l k SThe calculation is described in Fig.2. The position occurring the turning point correspondes to the best registration distanced, also equals to the reconstructing distance d '.It should be indicated that if we only need to reconstruct the phase map of the object wave, the registration distance substituted into the calculation equation is permitted having a departure from its true value.4 Spatial resolution of digital holography4.1 Affecting factors of the spatial resolution of digital holographyIt should be considered in three respects: (1) sizes of the object and the registering material, and the direction of the reference beam, (2) resolution of the registering material, and (3) diffraction limitation.For pointx2on the object shown in Fig.3, the limits of spatial frequency are λξθλθθ⎥⎦⎤⎢⎣⎡⎪⎪⎭⎫ ⎝⎛-'-=-=-0211maxmax tan sin sin sin sin z x f R R Fig.2 Determining reconstructing distanceλξθλθθ⎥⎦⎤⎢⎣⎡⎪⎪⎭⎫⎝⎛-'-=-=-211minmintansinsinsinsin zxfRRFrequency range isλξξ⎥⎦⎤⎢⎣⎡⎪⎪⎭⎫⎝⎛-'-⎥⎦⎤⎢⎣⎡⎪⎪⎭⎫⎝⎛-=∆--211211tansintansinzxzxfso the range is unrelated to the reference beam.Considering the resolution of registering material in order to satisfy the sampling theory, phase difference between adjacent points on the recording plate should be less than π, namely resolution of the registration material.cfff=∆η21)(minmaxπ4.2 Expanding the spatial resolution of reconstruction imageExpanding the spatial resolution can be realized at least in three ways: (1) Reducing the registration distance z0 can improve the reconstruction resolution, but it goes with reduction of the reconstruction area at the same ratio.Therefore, this method has its limitation. (2) Increasing the resolution and the imaging size of CCD with expensive price. (3) Applying image-synthesizing technique[11]CCD captures a few of images between which there is small displacement (usually a fraction of the pixel size) vertical to the CCD plane, shown in Fig.4(Schematic of vertical moving is the same).This method has two disadvantages. First, it is unsuitable for dynamic testing and can only be applied in the static image reconstruction. Second, because the pixel size is small (usually 5μm to 10μm) and the displacement should a fraction of this size (for example 2μm), it needs a moving table with high resolution and precision. Also it needs high stability in whole testing.In general, improvement of the spatial resolution of digital reconstruction is Fig.3 Relationship between object and CCDstill a big problem for the application of digital holography.5 Testing resultsFig.5 is the photo of the testing system. The paper does testing on two coins. The pixel size of the CCD is 4.65μm and there are 1 392×1 040 pixels. The firstis one Yuan coin of RMB (525 mm) used for image reconstruction by phase-shifting digital holography. The second is one Jiao coin of RMB (520 mm) for the testing of deformation measurement also by phase-shifting digital holography.5.1 Result of image reconstructionThe dimension of the one Yuancoin is 25 mm. The registrationdistance measured by ruler isabout 385mm. We capture ourphase-shifting holograms andreconstruct the image byphase-shifting digital holography.Fig.6 is the reconstructed image.Fig.7 is the curve of the auto-focusFig.4 Image capturing by moving CCD along horizontal directionFig.5 Photo of the testing systemfunction, from which we determine the real registration distance 370 mm. We can also change the controlling precision, for example 5mm, 0.1 mm,etc., to get more course or precision reconstruction position.5.2 Deformation measurementIn digital holography, the method of measuring deformation measurement differs from the traditional holography. It gets object wave before and after deformation and then subtract their phases to obtain the deformation. The study tested effect of heating deformation on the coin of one Jiao. The results are shown in Fig.8, Where (a) is the interferential signal of the object waves before and after deformation, and (b) is the wrapped phase difference.5.3 Improving the spatial resolutionFor the tested coin, we applied four sub-low-resolution holograms to reconstruct the high-resolution by the image-synthesizing technique. Fig.9 (a) is the reconstructed image by one low-resolution hologram, and (b) is the high-resolution image reconstructed from four low-resolution holograms.Fig.6 Reconstructed image Fig.7 Auto-focus functionFig.8 Heating deformation resultsFig.9 Comparing between the low and high resolution reconstructed image6 SummaryDigital holography can obtain phase and amplitude of the object wave at the same time. Compared to other techniques is a big advantage. Phase-shifting digital holography can realize image reconstruction and deformation with less noise. But it is unsuitable for dynamic testing. Applying the intensity sum of the reconstruction image as the auto-focusing function to evaluate the registering distance is easy, and computation is fast. Its precision is also sufficient. The image-synthesizing technique can improve spatial resolution of digital holography, but its static characteristic reduces its practicability. The limited dimension and too big pixel size are still the main obstacles for widely application of digital holography.外文文献译文:标题:图像重建中的相移数字全息摘要:相移数字全息术被用来研究研究艺术品的内部缺陷。
关于LED的外文文献和中文译文

多个LED发光装置的新型采集系统作为光源的一种,发光二极管(LED)有很多优点。
LED集成度更高,颜色种类多,使用寿命更长,而且工作电压较低。
但是,它仍有一个非常大的缺陷:一只LED的光照强度还是比较低。
这个缺点导致显示屏上的光通量不会很高。
但是无论如何,LED还是以其出色的性能在低电压装置中普遍应用。
因此,利用此系统采集多个LED的光,集成为更高强度的照明装置。
本设计提出三种采集系统,来实现增强光强的功能。
效率最好的一种采集系统可以达到96%。
同时,还分析了本系统的制造误差以及预算。
1 简介利用传统的光源来设计一个便携式探照灯,尺寸和能耗会很大。
而利用LED 来设计将会避免这些问题。
LED有很多优点:节能、体积较小、使用寿命长(约100,103小时)等,尤其是LED的光很适合环境工作。
Carel Zeiss和Philips打算用LED光源设计两种便携式探照灯。
尽管LED有诸多优点,可以让他们设计出的探照灯更加便携和小巧,但是由于光学元件的转换效率问题,导致系统有很多困难。
解决这个困难将是本文研究的重点。
通常,用一种合成非线性集中器(CPC)来减小分散度。
但是,这种传统的CPC采集效率仅为72%,必须要改善采集效率来提高光的利用率。
本文中将解决分散度和采集效率两个问题。
为实现这个目标,设计了三种不同的采集系统,以提高效率,下面逐一介绍。
2 仿真部分利用光学仿真软件和标签查找模块(BRO),来设计并分析采集系统的性能。
LED光源部分来自Osram-Opical半导体。
远程LED光源是一种Lambertian模式,LED的规格见表1。
在采集系统的底部有四个LED。
系统各个LED之间的位置关系如图1。
通光部分为2.1×2.1mm2,孔径3.26mm。
LED阵列对称的分布于系统的底部。
采集系统的第一个光学元件为均质器。
这个均质器的受光角度是12.5°。
因此,这个系统就是要把LED的受光角度的范围控制在±60°到±12.5°之间。
带原文的文献翻译

NaCaPO4-SiO2系统硅酸盐-磷酸盐玻璃的直接结晶摘要这项研究的主题是硅酸盐-磷酸盐玻璃NaCaPO4-SiO2系统,它们是玻璃的前身-结晶材料。
玻璃-通过NaCaPO4-SiO2系统结晶获得结晶材料玻璃属于一类叫做生物活性的材料。
为了获得玻璃-结晶材料和预先建立的参数,让玻璃结晶在特殊条件在实验是必须的。
为了设计直接结晶过程正常,有必要知道玻璃状前体的结构和微结构。
微观观查显示,熔析发生在所有的玻璃研究中。
基于DSC检查,它已经发现的该结晶NaCaPO4-SiO2系统的玻璃是一个多步骤的过程。
测试玻璃中,在DSC曲线存在几个明显分开放热的峰值,使它可能结晶只与分离的相矩阵剩余非晶反之亦然。
开展材料的详细X射线和光谱研究通过加热的梯度炉(DSC中的基础上指定的温度)得到的结果表明分离相与基体分别结晶。
因此,生物活性玻璃-结晶材料可由于得到的相分离现象和结晶相的预先建立的大小的存在。
关键词:玻璃-结晶材料,直接结晶,硅酸盐-磷酸盐玻璃第1章绪论玻璃和NaCaPO4-SiO2系统的玻璃结晶材料属于一组生理活性的材料,能够形成与组织结合[1-10]。
使用玻璃作为生物材料使得有可能采取的优点的玻璃态的特定属性,即易于获得的几乎任何形状,缓和通过控制属性化学组合物的适当的选择,以应用可能性各种加工方法,以及各向同性性能。
然而,在硅酸盐 - 磷酸盐玻璃的主要特征也是它的脆弱性,这显著限制了它们的用途如生物材料。
一种最好的方法就是提高眼镜的机械性能的最佳方式是执行部分结晶(失透),以获得玻璃 - 结晶材料。
这种材料的特点是非常的存在的结晶相的细晶体,随机分布在在玻璃状基质的其余部分[11,12]。
这使得组合两个玻璃和晶体材料的优点(高机械强度)。
其结果,玻璃的结晶材料的特点是高得多的机械强度相比玻前体。
然而,一个问题结晶相生长的出现会对玻璃的生物活性产生不利影响[13,14] 。
在极端的情况下,不受控制的结晶可导致转换生物活性玻璃成完全惰性材料[14]。
光学外文文献及翻译
学号2013211033 昆明理工大学专业英语专业光学姓名辜苏导师李重光教授分数导师签字日期2015年5月6日研究生部专业英语考核In digital holography, the recording CCD is placed on the ξ-ηplane in order to register the hologramx ',y 'when the object lies inthe x-y plane. Forthe reconstruction ofthe information ofthe object wave,phase-shifting digital holography includes two steps:(1) getting objectwave on hologram plane, and (2) reconstructing original object wave.2.1 Getting information of object wave on hologram plateDoing phase shifting N-1 times and capturing N holograms. Supposing the interferogram after k- 1 times phase-shifting is]),(cos[),(),(),,(k k b a I δηξφηξηξδηξ-⋅+= (1) Phase detection can apply two kinds of algorithms:synchronous phase detection algorithms [9]and the least squares iterative algorithm [10]. The four-step algorithm in synchronous phase detection algorithm is in common use. The calculation equation is)2/3,,(),,()]2/,,()0,,([2/1),(πηξπηξπηξηξηξiI I iI I E --+=2.2 Reconstructing original object wave by reverse-transform algorithmObject wave from the original object spreads front.The processing has exact and clear description and expression in physics and mathematics. By phase-shifting technique, we have obtained information of the object wave spreading to a certain distance from the original object. Therefore, in order to get the information of the object wave at its initial spreading position, what we need to do is a reverse work.Fig.1 Geometric coordinate of digital holographyexact registering distance.The focusing functions normally applied can be divided into four types: gray and gradient function, frequency-domain function, informatics function and statistics function. Gray evaluation function is easy to calculate and also robust. It can satisfy the demand of common focusing precision. We apply the intensity sum of reconstruction image as the evaluation function:min ),(11==∑∑==M k Nl l k SThe calculation is described in Fig.2. The position occurring the turning point correspondes to the best registration distanced, also equals to the reconstructing distance d '.It should be indicated that if we only need to reconstruct the phase map of the object wave, the registration distance substituted into the calculation equation is permitted having a departure from its true value.4 Spatial resolution of digital holography4.1 Affecting factors of the spatial resolution of digital holographyIt should be considered in three respects: (1) sizes of the object and the registering material, and the direction of the reference beam, (2) resolution of the registering material, and (3) diffraction limitation.For pointx2on the object shown in Fig.3, the limits of spatial frequency are λξθλθθ⎥⎦⎤⎢⎣⎡⎪⎪⎭⎫ ⎝⎛-'-=-=-0211maxmax tan sin sin sin sin z x f R R Fig.2 Determining reconstructing distanceλξθλθθ⎥⎦⎤⎢⎣⎡⎪⎪⎭⎫⎝⎛-'-=-=-211minmintansinsinsinsin zxfRRFrequency range isλξξ⎥⎦⎤⎢⎣⎡⎪⎪⎭⎫⎝⎛-'-⎥⎦⎤⎢⎣⎡⎪⎪⎭⎫⎝⎛-=∆--211211tansintansinzxzxfso the range is unrelated to the reference beam.Considering the resolution of registering material in order to satisfy the sampling theory, phase difference between adjacent points on the recording plate should be less than π, namely resolution of the registration material.cfff=∆η21)(minmax4.2 Expanding the spatial resolution of reconstruction imageExpanding the spatial resolution can be realized at least in three ways: (1) Reducing the registration distance z0 can improve the reconstruction resolution, but it goes with reduction of the reconstruction area at the same ratio.Therefore, this method has its limitation. (2) Increasing the resolution and the imaging size of CCD with expensive price. (3) Applying image-synthesizing technique[11]CCD captures a few of images between which there is small displacement (usually a fraction of the pixel size) vertical to the CCD plane, shown in Fig.4(Schematic of vertical moving is the same).This method has two disadvantages. First, it is unsuitable for dynamic testing and can only be applied in the static image reconstruction. Second, because the pixel size is small (usually 5μm to 10μm) and the displacement should a fraction of this size (for example 2μm), it needs a moving table with high resolution and precision. Also it needs high stability in whole testing.In general, improvement of the spatial resolution of digital reconstruction is Fig.3 Relationship between object and CCDstill a big problem for the application of digital holography.5 Testing resultsFig.5 is the photo of the testing system. The paper does testing on two coins. The pixel size of the CCD is 4.65μm and there are 1 392×1 040 pixels. The firstis one Yuan coin of RMB (525 mm) used for image reconstruction by phase-shifting digital holography. The second is one Jiao coin of RMB (520 mm) for the testing of deformation measurement also by phase-shifting digital holography.5.1 Result of image reconstructionThe dimension of the one Yuancoin is 25 mm. The registrationdistance measured by ruler isabout 385mm. We capture ourphase-shifting holograms andreconstruct the image byphase-shifting digital holography.Fig.6 is the reconstructed image.Fig.7 is the curve of the auto-focusFig.4 Image capturing by moving CCD along horizontal directionFig.5 Photo of the testing systemfunction, from which we determine the real registration distance 370 mm. We can also change the controlling precision, for example 5mm, 0.1 mm,etc., to get more course or precision reconstruction position.5.2 Deformation measurementIn digital holography, the method of measuring deformation measurement differs from the traditional holography. It gets object wave before and after deformation and then subtract their phases to obtain the deformation. The study tested effect of heating deformation on the coin of one Jiao. The results are shown in Fig.8, Where (a) is the interferential signal of the object waves before and after deformation, and (b) is the wrapped phase difference.5.3 Improving the spatial resolutionFor the tested coin, we applied four sub-low-resolution holograms to reconstruct the high-resolution by the image-synthesizing technique. Fig.9 (a) is the reconstructed image by one low-resolution hologram, and (b) is the high-resolution image reconstructed from four low-resolution holograms.Fig.6 Reconstructed image Fig.7 Auto-focus functionFig.8 Heating deformation resultsFig.9 Comparing between the low and high resolution reconstructed image6 SummaryDigital holography can obtain phase and amplitude of the object wave at the same time. Compared to other techniques is a big advantage. Phase-shifting digital holography can realize image reconstruction and deformation with less noise. But it is unsuitable for dynamic testing. Applying the intensity sum of the reconstruction image as the auto-focusing function to evaluate the registering distance is easy, and computation is fast. Its precision is also sufficient. The image-synthesizing technique can improve spatial resolution of digital holography, but its static characteristic reduces its practicability. The limited dimension and too big pixel size are still the main obstacles for widely application of digital holography.外文文献译文:标题:图像重建中的相移数字全息摘要:相移数字全息术被用来研究研究艺术品的内部缺陷。
光纤光学英文文献5

Amplification and ASE suppression in a polarization-maintaining ytterbium-doped all-solid photonic bandgap fibreC. B. Olausson1,2*, C. I. Falk3, J. K. Lyngsø1,2, B. B. Jensen3, K. T. Therkildsen3, J. W.Thomsen3, K. P. Hansen1, A. Bjarklev2 and J. Broeng11Crystal Fibre A/S, Blokken 84, DK-3460 Birkerød, Denmark2DTU Fotonik, Ørsteds Plads, building 343, 2800 Kgs. Lyngby, Denmark3Niels Bohr Institute, Universitetsparken 5, 2100 København, Denmark*Corresponding author: cbo@Abstract: We demonstrate suppression of amplified spontaneous emissionat the conventional ytterbium gain wavelengths around 1030 nm in acladding-pumped polarization-maintaining ytterbium-doped all-solidphotonic crystal fibre. The fibre works through combined index andbandgap guiding. Furthermore, we show that the peak of the amplifiedspontaneous emission can be shifted towards longer wavelengths byrescaling the fibre dimensions. Thereby one can obtain lasing oramplification at longer wavelengths (1100 nm – 1200 nm) as the amount ofamplification in the fibre is shown to scale with the power of the amplifiedspontaneous emission.©2008 Optical Society of AmericaOCIS codes: (060.2280) Fiber design and fabrication; (060.2270) Fiber characterization;(060.2400) Fiber properties; (060.2420) Fibers, polarization-maintaining; (060.5295) Photoniccrystal fibers; (060.3510) Lasers, Fiber.References and links1.G. Bouwmans, L. Bigot, Y. Quiquempois, F. Lopez, L. Provino, and M. Douay, "Fabrication andcharacterization of an all-solid 2D photonic bandgap fiber with a low-loss region (< 20 dB/km) around1550 nm," Opt. Express 13, 8452-8459 (2005).2.G. Canat, J. C. Mollier, J. P. Bouzinac, G. L. M. Williams, B. Cole, L. Goldberg, G. Kulcsar, Y. Jaouen,“Power limitations of fiber lasers at 1.5 µm by parasitic lasing effects,” in Conference on Lasers andElectro-Optics/Quantum Electronics and Laser Science and Photonic Applications Systems Technologies,Technical Digest (CD) (Optical Society of America, 2004), paper CMK6.3. A. Shirakawa, J. Ota, H. Maruyama, and K. -I. Ueda, "Linearly-Polarized Yb-Doped Fiber Laser DirectlyOperating at 1178 nm for 589-nm Generation," in Advanced Solid-State Photonics, OSA Technical Digest Series (CD) (Optical Society of America, 2007), paper MD1.4.S. Sinha, C. Langrock, M. Digonnet, M. Fejer, and R. Byer, "Efficient yellow-light generation by frequencydoubling a narrow-linewidth 1150 nm ytterbium fiber oscillator," Opt. Lett. 31, 347-349 (2006).5.N. Malossi, S. Damkjaer, P. L. Hansen, L. B. Jacobsen, L. Kindt, S. Sauge, J. W. Thomsen, F. C. Cruz, M.Allegrini, and E. Arimondo, "Two-photon cooling of magnesium atoms," Phys. Rev. A 72, 051403 (2005).6. A. Wang, A. K. George, and J. C. Knight, "Three-level neodymium fiber laser incorporating photonicbandgap fiber," Opt. Lett. 31, 1388-1390 (2006).7.V. Pureur, L. Bigot, G. Bouwmans, Y. Quiquempois, M. Douay, and Y. Jaouen, "Ytterbium-doped solidcore photonic bandgap fiber for laser operation around 980 nm," Appl. Phys. Lett. 92, 061113 (2008).8.R. Goto, K. Takenaga, K. Okada, M. Kashiwagi, T. Kitabayashi, S. Tanigawa, K. Shima, S. Matsuo, and K.Himeno, "Cladding-Pumped Yb-Doped Solid Photonic Bandgap Fiber for ASE Suppression in ShorterWavelength Region," in Optical Fiber Communication Conference and Exposition and The National Fiber Optic Engineers Conference, OSA Technical Digest (CD) (Optical Society of America, 2008), paperOTuJ5.9.T. Birks, F. Luan, G. Pearce, A. Wang, J. Knight, and D. Bird, "Bend loss in all-solid bandgap fibres," Opt.Express 14, 5688-5698 (2006).10.K. P. Hansen, C. B. Olausson, J. Broeng, K. Mattsson, M. D. Nielsen, T. Nikolajsen, P. M. W. Skovgaard,M. H. Sørensen, M. Denniger, C. Jakobsen, and H. R. Simonsen, “Airclad fiber laser technology,” Proc.SPIE 6873, 687307 (2008).#98542 - $15.00 USD Received 8 Jul 2008; revised 15 Aug 2008; accepted 17 Aug 2008; published 20 Aug 2008 (C) 2008 OSA 1 September 2008 / Vol. 16, No. 18 / OPTICS EXPRESS 1365711.W. J. Wadsworth, R. M. Percival, G. Bouwmans, J. C. Knight, T. A. Birks, T. D. Hedley, and P. S. J.Russell, "Very High Numerical Aperture Fibers," IEEE Photonics Tech. Lett. 16, 843-845 (2004).12. A. Cerqueira S. Jr., F. Luan, C. Cordeiro, A. George, and J. Knight, "Hybrid photonic crystal fiber," Opt.Express 14, 926-931 (2006).13.J. K. Lyngsø, B. J. Mangan, and P. J. Roberts, "Polarization Maintaining Hybrid TIR/Bandgap All-SolidPhotonic Crystal Fiber," in Conference on Lasers and Electro-Optics/Quantum Electronics and LaserScience Conference and Photonic Applications Systems Technologies, OSA Technical Digest (CD) (Optical Society of America, 2008), paper CThV1.14.N. M. Litchinitser, S. C. Dunn, B. Usner, B. J. Eggleton, T. P. White, R. C. McPhedran, and C. Martijn deSterke, "Resonances in microstructured optical waveguides," Opt. Express 11, 1243-1251 (2006).1. IntroductionIn photonic bandgap (PBG) fibres light is confined within a low-index core by a microstructured cladding typically formed by silica and air. In this work an all-solid PBG fibre is used in which the PBG cladding is made by a triangular lattice of germanium-doped high-index micro-rods in a silica background, which raise the overall cladding index as in [1], while the core consists of a single ytterbium-doped micro-rod as gain medium. Combining the wavelength filtering effect of PBG confinement with an ytterbium-doped core results in efficient suppression of amplified spontaneous emission (ASE) at the conventional ytterbium gain wavelengths around 1030 nm and thus a reduction in parasitic lasing outside the bandgap, which typicially limits the operation of long wavelength fibre lasers and amplifiers [2]. Frequency doubled fibre lasers and amplifiers around 1180 nm [3,4] are of interest for yellow light generation in medical and astronomical application, while frequency quadrupling of fibre lasers can generate narrow linewidth UV light in the range 255 nm – 295 nm for applications in atomic physics [5]. Previous work on the use of the photonic bandgap filtering effect for shorter wavelength laser operation at 907 nm and 980 nm is reported in [6,7].In this paper, we demonstrate suppression of ASE for two different all-solid PBG fibres with different bandgap positions. We show that the ASE peak can be shifted towards longer wavelengths by rescaling the dimensions of the fibre and thereby moving the bandgap. It has been shown that the ASE peak of an all-solid PBG fibre can be shifted towards longer wavelengths by reducing the coiling diameter [8], however, this method works by and suffers from significant bend losses [9]. With the present approach, we show that tight coiling of the fibre is not necessary in order to shift towards longer wavelengths. Furthermore, we demonstrate that the amplification in the fibres scales with the ASE power for a given wavelength.a b cFig. 1. (a) Microscope image of the fibre structure. The lighter regions are the germanium-doped rods constituting the pump-cladding, while the two darker regions are the boron rods. (b)Microscope image of the core region. (c) Microscope image of the airclad surrounding thepump-cladding structure.2. Fibre propertiesTwo all-solid photonic PBG fibres were fabricated with a cladding pitch of 9.45 μm and 9.80 μm, respectively. The signal core consists of an ytterbium-doped rod, which is index matched to the silica background. The core is surrounded by the PBG pump-cladding structure made#98542 - $15.00 USD Received 8 Jul 2008; revised 15 Aug 2008; accepted 17 Aug 2008; published 20 Aug 2008 (C) 2008 OSA 1 September 2008 / Vol. 16, No. 18 / OPTICS EXPRESS 13658by an eight period triangular lattice structure of high-index germanium-doped rods. For the two fibres we measured the diameter of the cladding to 214 μm and 220 μm, respectively. Both fibres have pump absorption of 1.1 dB/m at 976 nm. Furthermore, the PBG pump cladding is surrounded by an airclad structure providing the pump guide with a large numerical aperture of 0.57, allowing for efficient high-power cladding-pumping [10,11].The polarization-maintaining properties of the fibre are obtained by incorporating two low index boron-doped rods on either side of the core. The boron-doped rods act as stress applying parts, inducing high birefringence in the fibre while the lower index results in confinement by total internal reflection (TIR) in one direction and bandgap guiding in other directions [12]. The birefringence is on the order of 10-4.Microscope images of the fibre structure, the core and the airclad structure surrounding the pump cladding are shown in Fig. 1. The lighter regions are the germanium-doped rods, while the two darker regions near the core are the boron rods.Core properties of the fibre have been determined by performing measurements on a fibre which is identical to the fibre in question in terms of pump cladding and core properties, but without the surrounding airclad. Near-field measurements at 1150 nm yield a 1/e2 mode field diameter of 10.0 µm in the axis parallel to the stress rods, a mode field diameter of 10.8 µm in the axis perpendicular to the stress rods and an average numerical aperture of 0.1. A near field image taken in the third order bandgap using 1150nm light is shown in Fig. 2. The lack of an anti-resonant tail of light in the boron-doped stress rods on either side of the core is evidence of index guiding in the direction of the stress rods and bandgap guiding in the other direction.A passive version of this type of hybrid TIR / bandgap fibre has been reported in [13].Fig. 2. Near field CCD image taken in the third order bandgap using 1150 nm light, where thestress rods are in the horizontal direction. An anti-resonant tail of light is visible in thesurrounding high-index germanium-doped rods, but not in the boron-doped stress rods.Recently, ASE suppression in an ytterbium-doped all-solid photonic PBG fibre for long wavelength applications has been demonstrated [8]. The present fibre design is polarization-maintaining and holds potential for higher power due to the airclad surrounding the pump cladding.3. Suppression of amplified spontaneous emissionThe transmission spectrum of the fibres is measured using the setup in Fig. 3(a). In order to only transmit light in the core, light from a white light source is launched into 1 m of single-mode large mode area (LMA) fibre with a core size of 10 um, which is then butt-coupled to the 10 µm core of 30 m of the ytterbium-doped all-solid PBG fibre. The light from the core of the PBG fibre is subsequently collected by a high NA 10 µm core fibre in order to limit light collected by the optical spectrum analyzer (OSA) to the core region.#98542 - $15.00 USD Received 8 Jul 2008; revised 15 Aug 2008; accepted 17 Aug 2008; published 20 Aug 2008 (C) 2008 OSA 1 September 2008 / Vol. 16, No. 18 / OPTICS EXPRESS 13659Fig. 3. (a) Experimental setup for measuring the bandgap transmission spectrum and (b) setupfor measuring the ASE spectrum.The ASE spectrum in the core is measured using the setup shown in Fig. 3(b). The 976 nm pump light is launched into the pump cladding of the PBG fibre using a multi-mode fibre with a core size of 100 µm and the output core light is collected by the same high NA fibreFigure 5 shows the ASE spectra of the two different ytterbium-doped all-solid PBG fibres, one designed with a bandgap centered at 1140 nm (red) and another designed with a bandgap centered at 1180 nm (black). Results show that the peak of the ASE spectrum can be shifted towards longer wavelengths by moving the bandgap position in the fibre. This is done by rescaling the fibre dimensions in the drawing process.#98542 - $15.00 USD Received 8 Jul 2008; revised 15 Aug 2008; accepted 17 Aug 2008; published 20 Aug 2008 (C) 2008 OSA 1 September 2008 / Vol. 16, No. 18 / OPTICS EXPRESS 136604. Amplification and laser propertiesThe amplification properties of the fibres are measured using the forward seeded amplification setup depicted in Fig. 6. The PBG fibre is pumped with up to 3 W of 980 nm light and seeded with 2 mW of 1080 nm – 1145 nm light from a laser cavity created from 30 m of the same PBG fibre and a laser dispersing prism. The seed laser cavity is tuned using a mirror. Furthermore, the pump light is launched at an angle in order to reduce guidance in the high-index rods and obtain maximum pump absorption.Fig. 6. Amplification setup using forward seeding with a seed setup tunable in the range 1080nm – 1145 nm.The amplification results for the two PBG fibres are presented in Fig. 7. For both fibres results show that the amplification for a given wavelength scales with the ASE power. For the specified pump power an amplification of up to 15dB is obtained in both fibres. Peak amplification occurs at the wavelengths that experience the least loss due to the bandgap combined with the highest gain due to their emission cross section. Increasing the pump power will shift the ASE peak, and hence also the peak amplification, towards the left bandgap edge.#98542 - $15.00 USD Received 8 Jul 2008; revised 15 Aug 2008; accepted 17 Aug 2008; published 20 Aug 2008 (C) 2008 OSA 1 September 2008 / Vol. 16, No. 18 / OPTICS EXPRESS 136618(b) the ASE suppression is apparent in the output power spectrum outside the bandgap, when the fibre with a bandgap centered at 1180 nm is lasing at exactly the edge of the bandgap.can open new possibilities for high-power ytterbium-doped fibre lasers and amplifiers lasing at longer wavelengths above the conventional ytterbium gain wavelengths.#98542 - $15.00 USD Received 8 Jul 2008; revised 15 Aug 2008; accepted 17 Aug 2008; published 20 Aug 2008 (C) 2008 OSA 1 September 2008 / Vol. 16, No. 18 / OPTICS EXPRESS 13662。
- 1、下载文档前请自行甄别文档内容的完整性,平台不提供额外的编辑、内容补充、找答案等附加服务。
- 2、"仅部分预览"的文档,不可在线预览部分如存在完整性等问题,可反馈申请退款(可完整预览的文档不适用该条件!)。
- 3、如文档侵犯您的权益,请联系客服反馈,我们会尽快为您处理(人工客服工作时间:9:00-18:30)。
学号********** 昆明理工大学专业英语专业光学姓名辜苏导师李重光教授分数导师签字日期2015年5月6日研究生部专业英语考核In digital holography, the recording CCD is placed on the ξ-ηplane in order to register the hologramx ',y 'when the object lies inthe x-y plane. Forthe reconstruction ofthe information ofthe object wave,phase-shifting digital holography includes two steps:(1) getting objectwave on hologram plane, and (2) reconstructing original object wave.2.1 Getting information of object wave on hologram plateDoing phase shifting N-1 times and capturing N holograms. Supposing the interferogram after k- 1 times phase-shifting is]),(cos[),(),(),,(k k b a I δηξφηξηξδηξ-⋅+= (1) Phase detection can apply two kinds of algorithms:synchronous phase detection algorithms [9]and the least squares iterative algorithm [10]. The four-step algorithm in synchronous phase detection algorithm is in common use. The calculation equation is)2/3,,(),,()]2/,,()0,,([2/1),(πηξπηξπηξηξηξiI I iI I E --+=2.2 Reconstructing original object wave by reverse-transform algorithmObject wave from the original object spreads front.The processing has exact and clear description and expression in physics and mathematics. By phase-shifting technique, we have obtained information of the object wave spreading to a certain distance from the original object. Therefore, in order to get the information of the object wave at its initial spreading position, what we need to do is a reverse work.Fig.1 Geometric coordinate of digital holographyexact registering distance.The focusing functions normally applied can be divided into four types: gray and gradient function, frequency-domain function, informatics function and statistics function. Gray evaluation function is easy to calculate and also robust. It can satisfy the demand of common focusing precision. We apply the intensity sum of reconstruction image as the evaluation function:min ),(11==∑∑==M k Nl l k SThe calculation is described in Fig.2. The position occurring the turning point correspondes to the best registration distanced, also equals to the reconstructing distance d '.It should be indicated that if we only need to reconstruct the phase map of the object wave, the registration distance substituted into the calculation equation is permitted having a departure from its true value.4 Spatial resolution of digital holography4.1 Affecting factors of the spatial resolution of digital holographyIt should be considered in three respects: (1) sizes of the object and the registering material, and the direction of the reference beam, (2) resolution of the registering material, and (3) diffraction limitation.For pointx2on the object shown in Fig.3, the limits of spatial frequency are λξθλθθ⎥⎦⎤⎢⎣⎡⎪⎪⎭⎫ ⎝⎛-'-=-=-0211maxmax tan sin sin sin sin z x f R R Fig.2 Determining reconstructing distanceλξθλθθ⎥⎦⎤⎢⎣⎡⎪⎪⎭⎫ ⎝⎛-'-=-=-0211minmin tan sin sin sin sin z x f R R Frequency range isλξξ⎥⎦⎤⎢⎣⎡⎪⎪⎭⎫ ⎝⎛-'-⎥⎦⎤⎢⎣⎡⎪⎪⎭⎫ ⎝⎛-=∆--02110211tan sin tan sin z x z x f so the range is unrelated to the reference beam.Considering the resolution of registering material in order to satisfy the sampling theory, phase difference between adjacent points on the recording plate should be less than π, namely resolution of the registration material.c f f f =∆η21)(min max 4.2 Expanding the spatial resolution of reconstruction imageExpanding the spatial resolution can be realized at least in three ways: (1) Reducing the registration distance z 0 can improve the reconstruction resolution, but it goes with reduction of the reconstruction area at the same ratio.Therefore, this method has its limitation. (2) Increasing the resolution and the imaging size of CCD with expensive price. (3) Applying image-synthesizing technique [11]CCD captures a few of images between which there is small displacement (usually a fraction of the pixel size) vertical to the CCD plane, shown in Fig.4(Schematic of vertical moving is the same).This method has two disadvantages. First, it is unsuitable for dynamic testing and can only be applied in the static image reconstruction. Second, because the pixel size is small (usually 5μm to 10μm) and the displacement should a fraction of this size (for example 2μm), it needs a moving table with high resolution and precision. Also it needs high stability in whole testing.In general, improvement of the spatial resolution of digital reconstruction isFig.3 Relationship between object and CCDstill a big problem for the application of digital holography.Fig.4 Image capturing by moving CCD along horizontal direction5 Testing resultsFig.5 is the photo of the testing system. The paper does testing on two coins. The pixel size of the CCD is 4.65μm and there are 1 392×1 040 pixels. The firstis one Yuan coin of RMB (525 mm) used for image reconstruction by phase-shifting digital holography. The second is one Jiao coin of RMB (520 mm) for the testing of deformation measurement also by phase-shifting digital holography.Fig.5 Photo of the testing system5.1 Result of image reconstructionThe dimension of the one Yuancoin is 25 mm. The registrationdistance measured by ruler isabout 385mm. We capture ourphase-shifting holograms andreconstruct the image byphase-shifting digital holography.Fig.6 is the reconstructed image.Fig.7 is the curve of the auto-focusfunction, from which we determine the real registration distance 370 mm. We can also change the controlling precision, for example 5mm, 0.1 mm,etc., to get more course or precision reconstruction position.Fig.6 Reconstructed image Fig.7 Auto-focus function5.2 Deformation measurementIn digital holography, the method of measuring deformation measurement differs from the traditional holography. It gets object wave before and after deformation and then subtract their phases to obtain the deformation. The study tested effect of heating deformation on the coin of one Jiao. The results are shown in Fig.8, Where (a) is the interferential signal of the object waves before and after deformation, and (b) is the wrapped phase difference.Fig.8 Heating deformation results5.3 Improving the spatial resolutionFor the tested coin, we applied four sub-low-resolution holograms to reconstruct the high-resolution by the image-synthesizing technique. Fig.9 (a) is the reconstructed image by one low-resolution hologram, and (b) is the high-resolution image reconstructed from four low-resolution holograms.Fig.9 Comparing between the low and high resolution reconstructed image6 SummaryDigital holography can obtain phase and amplitude of the object wave at the same time. Compared to other techniques is a big advantage. Phase-shifting digital holography can realize image reconstruction and deformation with less noise. But it is unsuitable for dynamic testing. Applying the intensity sum of the reconstruction image as the auto-focusing function to evaluate the registering distance is easy, and computation is fast. Its precision is also sufficient. The image-synthesizing technique can improve spatial resolution of digital holography, but its static characteristic reduces its practicability. The limited dimension and too big pixel size are still the main obstacles for widely application of digital holography.外文文献译文:标题:图像重建中的相移数字全息摘要:相移数字全息术被用来研究研究艺术品的内部缺陷。