经济学原理第七章课后题答案
曼昆微观经济学课后练习英文答案(第七章)
✍ how to define and measure consumer surplus.✍ the link between sellers’ costs of producing a good and the supply curve.✍ how to define and measure producer surplus.✍ that the equilibrium of supply and demand maximizes total surplus in a market. CONTEXT AND PURPOSE:Chapter 7 is the first chapter in a three-chapter sequence on welfare economics and market efficiency. Chapter 7 employs the supply and demand model to develop consumer surplus and producer surplus as a measure of welfare and market efficiency. These concepts are then utilized in Chapters 8 and 9 to determine the winners and losers from taxation and restrictions on international trade.The purpose of Chapter 7 is to develop welfare economics—the study of how the allocation of resources affects economic well-being. Chapters 4 through 6 employed supply and demand in a positive framework, which focused on the question, “What is the equilibrium price and quantity in a market?” This chapter now addresses the normative question, “Is the equilibrium price and quantity in a market the best possible solution to the resource allocation problem, or is it simply the price and quantity that balance supply and demand?” Students will discover that under most circumstances the equilibrium price and quantity is also the one that maximizes welfare.KEY POINTS:? Consumer surplus equals buyers’ willingness to pay for a good minus the amount they actually pay for it, and it measures the benefit buyers get from participating in a market.Consumer surplus can be computed by finding the area below the demand curve and above the price.? Producer surplus equals the amount sellers receive for their goods minus their costs of production, and it measures the benefit sellers get from participating in a market. Producer surplus can be computed by finding the area below the price and above the supply curve.? An allocation of resources that maximizes the sum of consumer and producer surplus is said to be efficient. Policymakers are often concerned with the efficiency, as well as the equality, of economic outcomes.? The equilibrium of supply and demand maximizes the sum of consumer and producer surplus.That is, the invisible hand of the marketplace leads buyers and sellers to allocate resources efficiently.? Markets do not allocate resources efficiently in the presence of market failures such as market power or externalities.CHAPTER OUTLINE:I. Definition of welfare economics: the study of how the allocation of resources affects economic well-being.A. Willingness to Pay1. Definition of willingness to pay: the maximum amount that a buyer will pay for a good.2. Example: You are auctioning a mint-condition recording of Elvis Presley’s first album. Four buyers show up. Their willingness to pay is as follows:for John. Because John is willing to pay more than he has to for the album,he derives some benefit from participating in the market.3. Definition of consumer surplus: the amount a buyer is willing to pay for a good minus the amount the buyer actually pays for it.4. Note that if you had more than one copy of the album, the price in the auction would end up being lower (a little over $70 in the case of two albums) and both John and Paul would gain consumer surplus.B. Using the Demand Curve to Measure Consumer Surplus1. We can use the information on willingness to pay to derive a demand curve for the rare2. . Because the demand curve shows the buyers’ willingness to pay, we can use the demand curve to measure consumer surplus.C. How a Lower Price Raises Consumer Surplusare paying less for the product than before (area A on the graph).b. Because the price is now lower, some new buyers will enter the market and receive consumer surplus on these additional units of output purchased (area B on the graph).D. What Does Consumer Surplus Measure?1. Remember that consumer surplus is the difference between the amount that buyers are willing to pay for a good and the price that they actually pay.2. Thus, it measures the benefit that consumers receive from the good as the buyers themselves perceive it.III. Producer SurplusA. Cost and the Willingness to Sell1. Definition of cost: the value of everything a seller must give up to produce a good .2. Example: You want to hire someone to paint your house. You accept bids for the work from four sellers. Each painter is willing to work if the price you will pay exceeds her opportunity cost. (Note that this opportunity cost thus represents willingness to sell.) The costs are: ALTERNATIVE CLASSROOM EXAMPLE:Review the material on price ceilings from Chapter 6. Redraw the market for two-bedroom apartments in your town. Draw in a price ceiling below the equilibriumprice.Then go through:✍ consumer surplus before the price ceiling is put into place.✍ consumer surplus after the price ceiling is put into place.You will need to take some time to explain the relationship between the producers’ willingness to sell and the cost of producing the good. The relationship between cost and the supply curve is not as apparent as the relationship between the demand curve and willingness to pay. It is important to stress that consumer surplus is measured in monetary terms. Consumer surplus gives us a way to place a monetary cost on inefficient market outcomes (due to government involvement or market failure).except for Grandma. Because Grandma receives more than she would require to paint the house, she derives some benefit from producing in the market.4.Definition of producer surplus: the amount a seller is paid for a good minus the seller’s cost of providing it.5. Note that if you had more than one house to paint, the price in the auction would end up being higher (a little under $800 in the case of two houses) and both Grandma and Georgia would gain producer surplus.B. Using the Supply Curve to Measure Producer Surplus1. We can use the information on cost (willingness to sell) to derive a supply curve for2. marginal seller . Because the supply curve shows the sellers’ cost (willingness to sell), we can use the supply curve to measure producer surplus.are receiving more for the product than before (area C on the graph).b. Because the price is now higher, some new sellers will enter the market and receive producer surplus on these additional units of output sold (area D on the graph).D. Producer surplus is used to measure the economic well-being of producers, much like consumer surplus is used to measure the economic well-being of consumers.ALTERNATIVE CLASSROOM EXAMPLE:Review the material on price floors from Chapter 6. Redraw the market for anagricultural product such as corn. Draw in a price support above the equilibriumprice.Then go through:✍ producer surplus before the price support is put in place.✍ producer surplus after the price support is put in place.Make sure that you discuss the cost of the price support to taxpayers.IV.Market EfficiencyA. The Benevolent Social Planner1. The economic well-being of everyone in society can be measured by total surplus, which is the sum of consumer surplus and producer surplus:Total Surplus = Consumer Surplus + Producer SurplusTotal Surplus = (Value to Buyers – Amount Paid by Buyers) +(Amount Received by Sellers – Cost to Sellers)Because the Amount Paid by Buyers = Amount Received bySellers:2. Definition of efficiency: the property of a resource allocation of maximizing the total surplus received by all members of society .3. Definition of equality: the property of distributing economic prosperity uniformly the members of society .a. Buyers who value the product more than the equilibrium price will purchase the product; those who do not, will not purchase the product. In other words, the free market allocates the supply of a good to the buyers who value it most highly, as measured by their willingness to pay.b. Sellers whose costs are lower than the equilibrium price will produce the product; those whose costs are higher, will not produce the product. In other words, the free market allocates the demand for goods to the sellers who can produce it at the lowest cost.to the marginal buyer is greater than the cost to the marginal seller so total surplus would rise if output increases.b. At any quantity of output greater than the equilibrium quantity, the value of the product to the marginal buyer is less than the cost to the marginal seller so total surplus would rise if output decreases.3. Note that this is one of the reasons that economists believe Principle #6: Markets are usually a good way to organize economic activity.It would be a good idea to remind students that there are circumstances whenthe market process does not lead to the most efficient outcome. Examplesinclude situations such as when a firm (or buyer) has market power over priceor when there are externalities present. These situations will be discussed inlater chapters.Pretty Woman, Chapter 6. Vivien (Julia Roberts) and Edward (Richard Gere)negotiate a price. Afterward, Vivien reveals she would have accepted a lowerprice, while Edward admits he would have paid more. If you have done a goodjob of introducing consumer and producer surplus, you will see the light bulbsgo off above your students’ heads as they watch this clip.C. In the News: Ticket Scalping1. Ticket scalping is an example of how markets work to achieve an efficient outcome.2. This article from The Boston Globe describes economist Chip Case’s experience with ticket scalping.D. Case Study: Should There Be a Market in Organs?1. As a matter of public policy, people are not allowed to sell their organs.a. In essence, this means that there is a price ceiling on organs of $0.b. This has led to a shortage of organs.2. The creation of a market for organs would lead to a more efficient allocation of resources, but critics worry about the equity of a market system for organs.V. Market Efficiency and Market FailureA. To conclude that markets are efficient, we made several assumptions about how markets worked.1. Perfectly competitive markets.2. No externalities.B. When these assumptions do not hold, the market equilibrium may not be efficient.C. When markets fail, public policy can potentially remedy the situation. SOLUTIONS TO TEXT PROBLEMS:Quick Quizzes1. Figure 1 shows the demand curve for turkey. The price of turkey is P1 and the consumer surplus that results from that price is denoted CS. Consumer surplus is the amount a buyer is willing to pay for a good minus the amount the buyer actually pays for it. It measures the benefit to buyers of participating in a market.Figure 1 Figure 22. Figure 2 shows the supply curve for turkey. The price of turkey is P1 and the producer surplus that results from that price is denoted PS. Producer surplus is the amount sellers are paid for a good minus the sellers’ cost of providing it (measured by the supply curve). It measures the benefit to sellers of participating in a market.Figure 33. Figure 3 shows the supply and demand for turkey. The price of turkey is P1, consumer surplus is CS, and producer surplus is PS. Producing more turkeys than the equilibrium quantity would lower total surplus because the value to the marginal buyer would be lower than the cost to the marginal seller on those additional units.Questions for Review1. The price a buyer is willing to pay, consumer surplus, and the demand curve are all closely related. The height of the demand curve represents the willingness to pay of the buyers. Consumer surplus is the area below the demand curve and above the price, which equals the price that each buyer is willing to pay minus the price actually paid.2. Sellers' costs, producer surplus, and the supply curve are all closely related. The height of the supply curve represents the costs of the sellers. Producer surplus is the area below the price and above the supply curve, which equals the price received minus each seller's costs of producing the good.Figure 43. Figure 4 shows producer and consumer surplus in a supply-and-demand diagram.4. An allocation of resources is efficient if it maximizes total surplus, the sum of consumer surplus and producer surplus. But efficiency may not be the only goal of economic policymakers; they may also be concerned about equity the fairness of the distribution of well-being.5. The invisible hand of the marketplace guides the self-interest of buyers and sellers into promoting general economic well-being. Despite decentralized decision making and self-interested decision makers, free markets often lead to an efficient outcome.6. Two types of market failure are market power and externalities. Market power may cause market outcomes to be inefficient because firms may cause price and quantity to differ from the levels they would be under perfect competition, which keeps total surplus from being maximized. Externalities are side effects that are not taken into account by buyers and sellers. As a result, the free market does not maximize total surplus.Problems and Applications1. a. Consumer surplus is equal to willingness to pay minus the price paid. Therefore, Melissa’s willingness to pay must be $200 ($120 + $80).b. Her consumer surplus at a price of $90 would be $200 ? $90 = $110.c. If the price of an iPod was $250, Melissa would not have purchased one because the price is greater than her willingness to pay. Therefore, she would receive no consumer surplus.2. If an early freeze in California sours the lemon crop, the supply curve for lemons shifts to the left, as shown in Figure 5. The result is a rise in the price of lemons and a decline in consumer surplus from A + B + C to just A. So consumer surplus declines by the amount B + C.Figure 5 Figure 6In the market for lemonade, the higher cost of lemons reduces the supply of lemonade, as shown in Figure 6. The result is a rise in the price of lemonade and a decline in consumer surplus from D + E + F to just D, a loss of E + F. Note that an event that affects consumer surplus in one market often has effects on consumer surplus in other markets.3. A rise in the demand for French bread leads to an increase in producer surplus in the market for French bread, as shown in Figure 7. The shift of the demand curve leads to an increased price, which increases producer surplus from area A to area A + B + C.Figure 7The increased quantity of French bread being sold increases the demand for flour, as shown in Figure 8. As a result, the price of flour rises, increasing producer surplus from area Dto D + E + F. Note that an event that affects producer surplus in one market leads to effects on producer surplus in related markets.Figure 84. a.Figure 9b. When the price of a bottle of water is $4, Bert buys two bottles of water. His consumer surplus is shown as area A in the figure. He values his first bottle of water at $7, but pays only $4 for it, so has consumer surplus of $3. He values his second bottle of water at $5, but pays only $4for it, so has consumer surplus of $1. Thus Bert’s total consumer surplus is $3 + $1 = $4, which is the area of A in the figure.c. When the price of a bottle of water falls from $4 to $2, Bert buys three bottles of water, an increase of one. His consumer surplus consists of both areas A and B in the figure, an increase in the amount of area B. He gets consumer surplus of $5 from the first bottle ($7 value minus $2 price), $3 from the second bottle ($5 value minus $2 price), and $1 from the third bottle ($3 value minus $2 price), for a total consumer surplus of $9. Thus consumer surplus rises by $5 (which is the size of area B) when the price of a bottle of water falls from $4 to $2.5. a.Figure 10b. When the price of a bottle of water is $4, Ernie sells two bottles of water. His producer surplus is shown as area A in the figure. He receives $4 for his first bottle of water, but it costs only $1 to produce, so Ernie has producer surplus of $3. He also receives $4 for his second bottle of water, which costs $3 to produce, so he has producer surplus of $1. Thus Ernie’s total producer surplus is $3 + $1 = $4, which is the area of A in the figure.c. When the price of a bottle of water rises from $4 to $6, Ernie sells three bottles of water, an increase of one. His producer surplus consists of both areas A and B in the figure, an increase by the amount of area B. He gets producer surplus of $5 from the first bottle ($6 price minus $1 cost), $3 from the second bottle ($6 price minus $3 cost), and $1 from the third bottle ($6 price minus $5 price), for a total producer surplus of $9. Thus producer surplus rises by $5 (which is the size of area B) when the price of a bottle of water rises from $4 to $6.6. a. From Ernie’s supply schedule and Bert’s demand schedule, the quantityequilibrium quantity of two.b. At a price of $4, consumer surplus is $4 and producer surplus is $4, as shown in Problems 3 and 4 above. Total surplus is $4 + $4 = $8.c. If Ernie produced one less bottle, his producer surplus would decline to $3, as shown in Problem 4 above. If Bert consumed one less bottle, his consumer surplus would decline to $3, as shown in Problem 3 above. So total surplus would decline to $3 + $3 = $6.d. If Ernie produced one additional bottle of water, his cost would be $5, but the price is only $4, so his producer surplus would decline by $1. If Bert consumed one additional bottle of water, his value would be $3, but the price is $4, so his consumer surplus would decline by $1. So total surplus declines by $1 + $1 = $2.7. a. The effect of falling production costs in the market for stereos results in a shift to the right in the supply curve, as shown in Figure 11. As a result, the equilibrium price of stereos declines and the equilibrium quantity increases.Figure 11b. The decline in the price of stereos increases consumer surplus from area A to A + B + C + D, an increase in the amount B + C + D. Prior to the shift in supply, producer surplus was areas B + E (the area above the supply curve and below the price). After the shift in supply, producer surplus is areas E + F + G. So producer surplus changes by the amount F + G – B, which may be positive or negative. The increase in quantity increases producer surplus, while the decline in the price reduces producer surplus. Because consumer surplus rises by B + C + D and producer surplus rises by F + G – B, total surplus rises by C + D + F + G.c. If the supply of stereos is very elastic, then the shift of the supply curve benefits consumers most. To take the most dramatic case, suppose the supply curve were horizontal, as shown in Figure 12. Then there is no producer surplus at all. Consumers capture all the benefits of falling production costs, with consumer surplus rising from area A to area A + B.Figure 128. Figure 13 shows supply and demand curves for haircuts. Supply equals demand at a quantity of three haircuts and a price between $4 and $5. Firms A, C, and D should cut the hair of Ellen, Jerry, and Phil. Oprah’s willingness to pay is too low and firm B’s costs are too high, so they do not participate. The maximum total surplus is the area between the demand and supply curves, which totals $11 ($8 value minus $2 cost for the first haircut, plus $7 value minus $3 cost for the second, plus $5 value minus $4 cost for the third).Figure 139. a. The effect of falling production costs in the market for computers results in a shift to the right in the supply curve, as shown in Figure 14. As a result, the equilibrium price of computers declines and the equilibrium quantity increases. The decline in the price of computers increases consumer surplus from area A to A + B + C + D, an increase in the amount B + C + D.Figure 14 Figure 15Prior to the shift in supply, producer surplus was areas B + E (the area above thesupply curve and below the price). After the shift in supply, producer surplus isareas E + F + G. So producer surplus changes by the amount F + G – B, whichmay be positive or negative. The increase in quantity increases producer surplus,while the decline in the price reduces producer surplus. Because consumer surplusrises by B + C + D and producer surplus rises by F + G – B, total surplus rises byC +D + F + G.b. Because typewriters are substitutes for computers, the decline in the price of computers means that people substitute computers for typewriters, shifting the demand for typewriters to the left, as shown in Figure 15. The result is a decline in both the equilibrium price and equilibrium quantity of typewriters. Consumer surplus in the typewriter market changes from area A + B to A + C, a net change of C – B. Producer surplus changes from area C + D + E to area E, a net loss of C + D. Typewriter producers are sad about technological advances in computers because their producer surplus declines.c. Because software and computers are complements, the decline in the price and increase in the quantity of computers means that the demand for software increases, shifting the demand for software to the right, as shown in Figure 16. The result is an increase in both the price and quantity of software. Consumer surplus in the software market changes from B + C to A + B, anet change of A – C. Producer surplus changes from E to C + D + E, an increase of C + D, so software producers should be happy about the technological progress in computers.Figure 16d. Yes, this analysis helps explain why Bill Gates is one the world’s richest people, because his company produces a lot of software that is a complement with computers and there has been tremendous technological advance in computers.10. a. With Provider A, the cost of an extra minute is $0. With Provider B, the cost of anextra minute is $1.b. With Provider A, my friend will purchase 150 minutes [= 150 – (50)(0)]. WithProvider B, my friend would purchase 100 minutes [= 150 – (50)(1)].c. With Provider A, he would pay $120. The cost would be $100 with Provider B.Figure 17d. Figure 17 shows the friend’s demand. With Provider A, he buys 150 minutes andhis consumer surplus is equal to (1/2)(3)(150) – 120 = 105. With Provider B, hisconsumer surplus is equal to (1/2)(2)(100) = 100.e. I would recommend Provider A because he receives greater consumer surplus.11. a. Figure 18 illustrates the demand for medical care. If each procedure has a price of $100, quantity demanded will be Q1 procedures.Figure 18b. If consumers pay only $20 per procedure, the quantity demanded will be Q2 procedures. Because the cost to society is $100, the number of procedures performed is too large to maximize total surplus. The quantity that maximizes total surplus is Q1 procedures, which is less than Q2.c. The use of medical care is excessive in the sense that consumers get procedures whose value is less than the cost of producing them. As a result, the economy’s total surplus is reduced.d. To prevent this excessive use, the consumer must bear the marginal cost of the procedure. But this would require eliminating insurance. Another possibility would be that the insurance company, which pays most of the marginal cost of the procedure ($80, in this case) could decide whether the procedure should be performed. But the insurance company does not get the benefits of the procedure, so its decisions may not reflect the value to the consumer.。
经济学原理习题七

1.以下哪一种是正外部性的例子?A.Dev 为Hillary 修剪草坪,并因这项工作得到100 美元的报酬。
B.在修剪草坪时,Dev的修剪草机喷出烟雾,而Hillary 的邻居Kristen不得不吸入。
C.Hillary的新修剪的草坪使她所在的社区更有吸引力。
D.如果Hillary答应定期修剪草坪,她的邻居会向她付费。
正确答案:C2.如一种物品的生产引起了负外部性,那么,社会成本曲线就在供给曲线( )而且社会均衡数量( )的最优数量A.上方,大于B.上方,小千C.下方,大于D.下方,小于正确答案:B3.当政府对一种物品征收的税等于与生产这种物品相关的外部成本时,它就( )消费者支付的价格,并使市场结果()效率。
A.提高了,更有B.提高了,更无C.降低了,更有D.降低了,更无正确答案:A4.在以下哪一种情况下,科斯定理并不适用?()A.双方之间存在严重的外部性。
B.法院系统可以有效地执行所有合约。
C.双方都完全了解外部性。
D.交易成本使谈判变得困难。
正确答案:D5.以下哪一类物品具有排他性?A.私人物品与俱乐部物品。
B.私人物品与公共资源。
C.公共物品与俱乐部物品。
D.公共物品与公共资源。
正确答案:A6.以下哪一类物品具有消费中的竞争性?()A.私人物品与俱乐部物品。
B.私人物品与公共资源C.公共物品与俱乐部物品。
D.公共物品与公共资源。
正确答案:B7.以下哪一种是公共物品的例子?A.住房。
B.国防。
C.餐馆的饮食。
D.海洋中的鱼。
正确答案:B8.公共资源( )A.可以由市场力量有效率地提供B.如果没有政府就会提供不足C.如果没有政府就会使用过多D.是一种自然垄断正确答案:C7.教育是()A.私人物品B.公共物品C.共有资源D.俱乐部物品正确答案:A1.与公共物品相关的外部性通常是正的。
()A.正确B.错误正确答案:A2.自由市场上的公共物品数量通常大于效率的数量。
()A.正确B.错误正确答案:B12. 与公共资源相关的外部性通常是正的。
宏观经济学第七章习题及答案
第七单元经济周期理论本单元所涉及到的主要知识点:1.经济周期的含义、阶段与种类; 2.经济周期的原因;3.卡尔多经济周期模型; 4.乘数-加速数模型一、单项选择1.经济周期中的两个主要阶段是()。
a.繁荣和萧条; b.繁荣和衰退; c.萧条和复苏; d.繁荣和复苏。
2.下列对经济周期阶段排序正确的是()。
a.复苏,繁荣,衰退,萧条; b.复苏,繁荣,萧条,衰退;c.复苏,萧条,衰退,繁荣; d.复苏,衰退,萧条,繁荣。
3.由于经济衰退而形成的失业属于:()。
a.摩擦性失业; b.结构性失业;c.周期性失业; d.自然失业。
4.下列哪种说法表达了加速原理()。
a.消费支出随着投资支出增长率的变化而变化;b.投资支出随着国民收入增量的变化而变化;c.国民收入随着投资支出的变化而变化;d.投资支出的减少会造成消费支出一轮一轮地减少。
5.下列哪种说法没有表达加速原理()。
a.国民收入增长率的变化将导致投资支出的变化;b.消费支出的变化会引起投资支出更大的变化;c.投资支出的减少会造成消费支出一轮一轮地减少;d.投资支出随着国民收入增量的变化而变化。
6.加速原理发生作用的条件是()。
a.投资的增加会导致国民收入增加;b.消费品的生产需要有一定数量的资本品,因而消费支出的增加会导致投资支出的增加;c.投资的增加会导致消费支出的持续增加;d.投资支出的减少会造成消费支出地减少。
7.经验统计资料表明,在经济周期里,波动最大的一般是()。
a.资本品的生产; b.农产品的生产; c.日用消费品的生产; d.a和c。
8.所谓资本形成是指()。
a.净投资; b.总投资; c.更新投资; d.存货的投资。
9.假定某经济连续两年的国民收入都是1200亿美元,在资本-产量比率等于2的条件下,净投资等于()。
a.1200亿美元; b.2400亿美元; c.2000亿美元; d.0。
10.已知某经济某一年的国民收入是1000亿美元,净投资为零;第二年国民收入增至1200亿美元。
微观经济学第第七章课后答案资料

微观经济学第第七章课后答案第7章 课后练习答案一、基本概念 1、一般均衡:经济中所有经济单位及其市场同时处于均衡的一种状态。
2、帕累托最优条件:1)交换的帕累托最化条件:A B XY XY MRS MRS = ;2)生产的帕累托最优条件:C D LK LK MRTS MRTS = ;3)交换和生产的帕累托最优条件:XY XY MRS MRT = 3、帕累托改进:在资源既定的情况下,如果经济社会通过资源重新配置可以在不使得他人境况受到损害的条件下使得某些人的境况得到改善,则社会福利得到增进。
二、分析简答1、什么是局部均衡和一般均衡,两者的区别和联系是什么?答:局部均衡是指:仅仅是某一种产品实现了均衡或某一种市场(例如,产品市场或要素市场)实现了均衡。
一般均衡是指经济中所有经济单位及其市场同时处于均衡的一种状态。
局部均衡把市场上其他商品和生产要素的数量与价格对这种商品或生产要素价格的影响忽略不计或视为不变,即假定这一商品或生产要素的价格只取决于它本身的供求状况,而不受其他商品的价格和供求状况的影响。
而在一般均衡分析中,不仅要分析影响该商品价格变动的供求关系,还要分析影响该商品生产的生产要素市场、消费者收入等多种因素的影响,即把经济中的所有经济单位和所有市场联系起来加以考虑和分析。
2、为什么完全竞争可以实现帕累托最优所需具备的三个条件?完全竞争经济在一定的假设条件下存在着一般均衡,即存在一组价格,在该组价格下市场中的供求平衡。
假设该组价格为Px ,P Y ,…,P L ,P K ,…。
其中P X ,P Y ,…表示商品X ,Y ,…的均衡价格;P L ,P K ,…表示要素L ,K ,…的均衡价格。
在完全竞争条件下,每个消费者和生产者都是价格的接受者,消费者在既定价格下追求自身效用的最大化,生产者在既定价格下追求自身利润的最大化。
对于消费者而言,任意一个消费者在完全竞争经济中效用最大化的条件是任意两种商品的边际替代率等于两种商品的价格比率,对于消费者C ,有:/A XY X Y MRS P P = ;对于消费者B ,有: /B XY X Y MRS P P =;将以上两式整理可得:A B XY XY MRS MRS =;此公式就是交换的帕累托最优条件。
曼昆《经济学原理》第6版 微观经济学分册 第7章 课后习题答案p157p159
第三篇市场和福利第七章消费者、生产者与市场效率问题与应用1.Melissa用120美元购买了一个iPod,并得到了80美元的消费者剩余。
A.她的支付意愿是多少?答:消费者剩余等于支付意愿减去付出的价格。
因此,梅莉莎须支付200 美元($120 + $80)。
B.如果她在降价销售时买了售价为90美元的iPod,她的消费者剩余会是多少?答:此时,她的消费者剩余为:200-90 =110 美元。
C.如果iPod的价格是250美元,她的消费者剩余会是多少?答:如果iPod 的价格是250 美元,其价格大于梅莉莎的支付愿意,因此她不会再买,这时的消费者剩余就为零。
2.加利福尼亚早来的寒流使柠檬变酸。
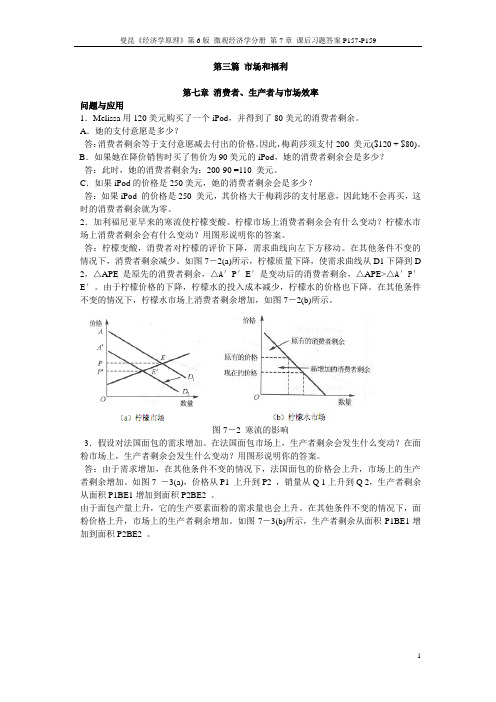
柠檬市场上消费者剩余会有什么变动?柠檬水市场上消费者剩余会有什么变动?用图形说明你的答案。
答:柠檬变酸,消费者对柠檬的评价下降,需求曲线向左下方移动。
在其他条件不变的情况下,消费者剩余减少。
如图7-2(a)所示,柠檬质量下降,使需求曲线从D1下降到D 2,△APE是原先的消费者剩余,△A′P′E′是变动后的消费者剩余,△APE>△A′P′E′。
由于柠檬价格的下降,柠檬水的投入成本减少,柠檬水的价格也下降。
在其他条件不变的情况下,柠檬水市场上消费者剩余增加,如图7-2(b)所示。
图7-2 寒流的影响3.假设对法国面包的需求增加。
在法国面包市场上,生产者剩余会发生什么变动?在面粉市场上,生产者剩余会发生什么变动?用图形说明你的答案。
答:由于需求增加,在其他条件不变的情况下,法国面包的价格会上升,市场上的生产者剩余增加。
如图7 -3(a),价格从P1 上升到P2 ,销量从Q 1上升到Q 2,生产者剩余从面积P1BE1增加到面积P2BE2 。
由于面包产量上升,它的生产要素面粉的需求量也会上升。
在其他条件不变的情况下,面粉价格上升,市场上的生产者剩余增加。
如图7-3(b)所示,生产者剩余从面积P1BE1增加到面积P2BE2 。
经济学原理第七章课后题答案
第七章 消费者、生产者与市场效率复习题:1、解释买者的支付意愿、消费者剩余和需求曲线如何相关。
答:需求曲线反映了买者的支付意愿。
在任何一种数量时,需求曲线给出的价格表示边际买者的支付意愿。
需求曲线以下和价格以上的总面积是一种物品或劳务市场上所有买者消费者剩余的总和。
2、解释卖者的成本、生产者剩余和供给曲线如何相关。
答:供给曲线的高度与卖者的成本相关。
在任何一种数量时,供给曲线给出的价格表示边际卖者的成本。
供给曲线以上和价格以下的总面积衡量市场的生产者剩余。
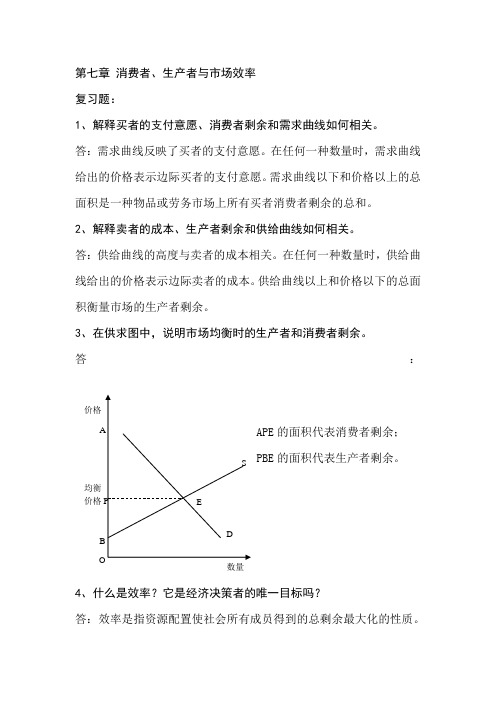
3、在供求图中,说明市场均衡时的生产者和消费者剩余。
答:4、什么是效率?它是经济决策者的唯一目标吗?答:效率是指资源配置使社会所有成员得到的总剩余最大化的性质。
价格均衡价格数量 APE 的面积代表消费者剩余;PBE 的面积代表生产者剩余。
除了效率外,经济决策者还应该关心平等。
实际上,市场交易的好处很像在市场参与者之间分割一块蛋糕,经济决策者不仅要关心如何奖经济蛋糕做大,即效率;还要考虑如何在市场参与者之间分割这块蛋糕,这就涉及公平问题。
5、看不见的手有什么作用?答:每一个市场参与者都会尽力追求自己的利益,看不见的手指引他们在相互竞争中达到一个并非他们本意想要达到的目的,这就是市场均衡点。
在均衡点上,消费者剩余和生产者剩余总和最大化,整个社会福利达到最大。
6、说出两种市场失灵的名字。
解释为什么每一种都可能使市场结果无效率。
答:市场失灵包括市场势力和外部性。
如果某一市场上存在市场势力,即只有极少部分(可能是一个)买者或卖者可以控制的市场价格,他们就会使价格倾向于对他们这一小部分人有益的水平。
于是,市场价格和数量背离供求平衡,社会福利达不到最大,市场失去效率。
外部性是某些市场参与者的行为对旁观者福利的影响。
它使市场福利还要取决于买者评价和卖者成本之外的其他因素。
由于买者和卖者在决定消费和生产时并没有考虑这种负作用。
所有,从整个社会角度来看,市场均衡可能是无效率的。
经济学原理曼昆课后答案chapter7.doc
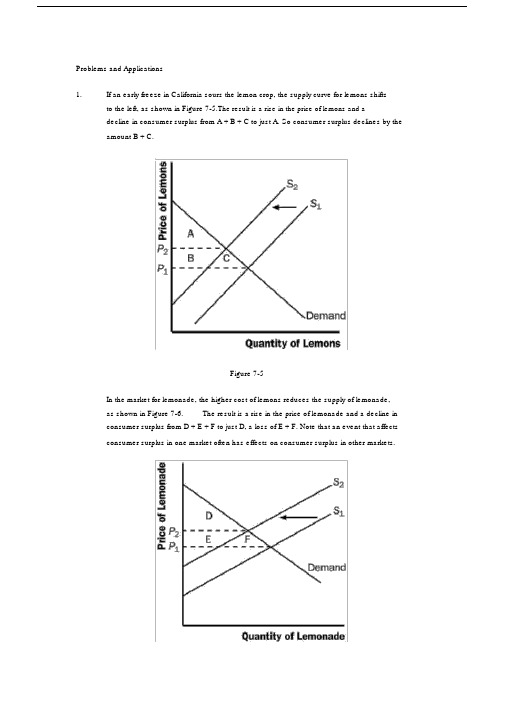
Problems and Applications1.If an early freeze in California sours the lemon crop, the supply curve for lemons shiftsto the left, as shown in Figure 7-5.The result is a rise in the price of lemons and adecline in consumer surplus from A + B + C to just A. So consumer surplus declines by the amount B + C.Figure 7-5In the market for lemonade, the higher cost of lemons reduces the supply of lemonade,as shown in Figure 7-6.The result is a rise in the price of lemonade and a decline inconsumer surplus from D + E + F to just D, a loss of E + F. Note that an event that affectsconsumer surplus in one market often has effects on consumer surplus in other markets.Figure 7-62. A rise in the demand for French bread leads to an increase in producer surplus in themarket for French bread, as shown in Figure 7-7.The shift of the demand curve leads to an increased price, which increases producer surplus from area A to area A + B + C.Figure 7-7The increased quantity of French bread being sold increases the demand for flour, asshown in Figure 7-8.As a result, the price of flour rises, increasing producer surplusfrom area D to D + E + F. Note that an event that affects producer surplus in onemarket leads to effects on producer surplus in related markets.Figure 7-83. a.Bert’ s demand schedule is:Price Quantity DemandedMore than $7 0$5 to $7 1$3 to $5 2$1 to $3 3$1 or less 4Bert’ s demand curve is shown in Figure 7 -9.Figure 7-9b.When the price of a bottle of water is $4, Bert buys two bottles of water.Hisconsumer surplus is shown as area A in the figure.He values his first bottle ofwater at $7, but pays only $4 for it, so has consumer surplus of $3.He valueshis second bottle of water at $5, but pays only $4 for it, so has consumersurplus of $1.Thus Bert’ s total consumer surplus is $3 + $1 = $4, which isthe area of A in the figure.c.When the price of a bottle of water falls from $4 to $2, Bert buys three bottlesof water, an increase of one. His consumer surplus consists of both areas Aand B in the figure, an increase in the amount of area B. He gets consumersurplus of $5 from the first bottle ($7 value minus $2 price), $3 from thesecond bottle ($5 value minus $2 price), and $1 from the third bottle ($3 valueminus $2 price), for a total consumer surplus of $9. Thus consumer surplusrises by $5 (which is the size of area B) when the price of a bottle of water fallsfrom $4 to $2.4. a. Ernie ’ s supply schedule for water is:Price Quantity SuppliedMore than $7 4$5 to $7 3$3 to $5 2$1 to $3 1Less than $1 0Ernie’ s supply curve is shown in Figure 7 -10.Figure 7-10b.When the price of a bottle of water is $4, Ernie sells two bottles of water.Hisproducer surplus is shown as area A in the figure.He receives $4 for his firstbottle of water, but it costs only $1 to produce, so Ernie has producer surplusof $3.He also receives $4 for his second bottle of water, which costs $3 toproduce, so he has producer surplus of$1. Thus Ernie’ s total producersurplus is $3 + $1 = $4, which is the area of A in the figure.c.When the price of a bottle of water rises from $4 to $6, Ernie sells three bottlesof water, an increase of one.His producer surplus consists of both areas Aand B in the figure, an increase by the amount of area B.He gets producersurplus of $5 from the first bottle ($6 price minus $1 cost), $3 from the secondbottle ($6 price minus $3 cost), and $1 from the third bottle ($6 price minus $5price), for a total producer surplus of $9.Thus producer surplus rises by $5(which is the size of area B) when the price of a bottle of water rises from $4to $6.5. a. From Ernie ’ s supply schedule and Bert ’ s demand schedule, the quantitydemanded and supplied are:Price Quantity Supplied Quantity Demanded$ 2 1 34 2 26 3 1Only a price of $4 brings supply and demand into equilibrium, withan equilibrium quantity of 2.b.At a price of $4, consumer surplus is $4 and producer surplus is $4, as shownin problems 3 and 4.Total surplus is $4 + $4 = $8.c.If Ernie produced one fewer bottle, his producer surplus would decline to $3,as shown in problem 4.If Bert consumed one fewer bottle, his consumersurplus would decline to $3, as shown in problem 3. So total surplus would declineto $3 + $3 = $6.d.If Ernie produced one additional bottle of water, his cost would be $5, but theprice is only $4, so his producer surplus would decline by $1.If Bertconsumed one additional bottle of water, his value would be $3, but the priceis $4, so his consumer surplus would decline by $1.So total surplus declinesby $1 + $1 = $2.6. a.The effect of falling production costs in the market for stereos results in a shiftto the right in the supply curve, as shown in Figure 7-11.As a result, theequilibrium price of stereos declines and the equilibrium quantity increases.b.The decline in the price of stereos increases consumer surplus from area A to A+ B + C + D, an increase in the amount B + C + D.Prior to the shift in supply,producer surplus was areas B + E (the area above the supply curve and belowthe price).After the shift in supply, producer surplus is areas E + F + G.Soproducer surplus changes by the amount F + G - B, which may be positive ornegative.The increase in quantity increases producer surplus, while thedecline in the price reduces producer surplus.Since consumer surplus risesby B + C + D and producer surplus rises by F + G - B, total surplus rises by C+ D+F+G.c.If the supply of stereos is very elastic, then the shift of the supply curvebenefits consumers most.To take the most dramatic case, suppose thesupply curve were horizontal, as shown in Figure 7-12.Then there is noproducer surplus at all.Consumers capture all the benefits of fallingproduction costs, with consumer surplus rising from area A to area A + B.Figure 7-11Figure 7-127. Figure 7-13 shows supply and demand curves for haircuts. Supply equals demand ata quantity of three haircuts and a price between $4 and $5. Firms A, C, and D shouldcut the hair of Sally Jessy, Jerry, and Montel. Oprah ’ s willingness to pay is too low and firm B ’ s costs are too high, so they do not participate. The maximum total surplus isthe area between the demand and supply curves, which totals $11 ($8 value minus$2 cost for the first haircut, plus $7 value minus $3 cost for the second, plus $5 valueminus $4 cost for the third).Figure 7-138. a.The effect of falling production costs in the market for computers results in ashift to the right in the supply curve, as shown in Figure 7-14.As a result, theequilibrium price of computers declines and the equilibrium quantity increases.The decline in the price of computers increases consumer surplus from area Ato A + B + C + D, an increase in the amount B + C + D.Figure 7-14Prior to the shift in supply, producer surplus was areas B + E (the area abovethe supply curve and below the price).After the shift in supply, producersurplus is areas E + F + G.So producer surplus changes by the amount F + G- B, which may be positive or negative.The increase in quantity increasesproducer surplus, while the decline in the price reduces producer surplus. Sinceconsumer surplus rises by B + C + D and producer surplus rises by F + G - B,total surplus rises by C + D + F + G.——Figure 7-15b.Since adding machines are substitutes for computers, the decline in the priceof computers means that people substitute computers for adding machines,shifting the demand for adding machines to the left, as shown in Figure 7-15.The result is a decline in both the equilibrium price and equilibrium quantity ofadding machines.Consumer surplus in the adding-machine market changesfrom area A + B to A + C, a net gain of C - B.Producer surplus changes fromarea C + D + E to area E, a net loss of C + D.Adding machine producers aresad about technological advance in computers because their producersurplus declines.c.Since software and computers are complements, the decline in the price andincrease in the quantity of computers means that people’ s demand forsoftware increases, shifting the demand for software to the right, as shown inFigure 7-16. The result is an increase in both the price and quantity of software.Consumer surplus in the software market changes from B + C to A+B, a net increase of A - C. Producer surplus changes from E to C + D + E, anincrease of C + D, so software producers should be happy about the technologicalprogress in computers.d.Yes, this analysis helps explain why Bill Gates is one the world’ s richest msince his company produces a lot of software that’ s a complement withcomputers and there has been tremendous technological advance incomputers.——Figure 7-169. a. Figure 7-17 illustrates the demand for medical care. If each procedure has aprice of $100, quantity demanded will be Q 1 procedures.Figure 7-17b.If consumers pay only $20 per procedure, the quantity demanded will be Q 2procedures.Since the cost to society is $100, the number of proceduresperformed is too large to maximize total surplus.The quantity thatmaximizes total surplus is Q 1 procedures, which is less than Q2.c.The use of medical care is excessive in the sense that consumers getprocedures whose value is less than the cost of producing them.As a result,——the economy’ s total surplus is reduced.d.To prevent this excessive use, the consumer must bear the marginal cost ofthe procedure.But this would require eliminating insurance.Anotherpossibility would be that the insurance company, which pays most of themarginal cost of the procedure ($80, in this case) could decide whether theprocedure should be performed.But the insurance company doesn’ t get thebenefits of the procedure, so its decisions may not reflect the value to theconsumer.10. a. Figure 7-18 illustrates the effect of the drought. The supply curve shifts tothe left, leading to a rise in the equilibrium price from P 1 to P 2 and a decline inthe equilibrium quantity from Q 1 to Q 2 .Figure 7-18b.If the price of water is not allowed to change, there will be an excess demandfor water, with the shortage shown on the figure as the difference between Q 1and Q 3 .c.The system for allocating water is inefficient because it no longer allocateswater to those who value it most highly.Some people who value water atmore than its cost of production will be unable to obtain it, so societysurplus isn’ t maximized.The allocation system seems unfair as well.Water is allocated simply on pastusage, rewarding past wastefulness.If a family’ s demand for water increases,——say because of an increase in family size, the policy doesn ’ t allow them to obtain more water. Poor families, who probably used water mostly fornecessary uses like drinking, would suffer more than wealthier families whowould have to cut back only on luxury uses of water like operating backyardfountains and pools. However, the policy also keeps the price of water lower,which benefits poor families, since otherwise more of their family budgetwould have to go for water.d. If the city allowed the price of water to rise to its equilibrium price P 2 , theallocation would be more efficient. Quantity supplied would equal quantitydemanded and there would be no shortage. Total surplus would bemaximized.Whether the market allocation would be more or less fair than theproportionate reduction in water under the old policy is difficult to say, but it islikely to be more fair. Notice that the quantity supplied would be higher (Q 2)in this case than under the water restrictions (Q 3 ), so there ’ s less reduction inwater usage. To make the market solution even more fair, the governmentcould provide increased tax relief or welfare payments for poor families whosuffer from paying the higher water prices.。
高鸿业课后答案第七章
第七章一、填空题1、完全垄断市场上短期均衡的条件是,长期均衡的条件是。
MR=MC,MR=LMC=SMC2、在完全竞争市场上,厂商短期均衡的条件是,长期均衡的条件是。
SMR=SMC,MR=MC=AR=AC3、引起垄断竞争的基本条件是,另一个条件是。
产品差别,存在较多的厂商4、在完全竟争市场上,平均收益边际收益;而在其他市场上,一般是平均收益边际收益。
等于,大于5、在完全竞争市场上,一家厂商所面临的需求曲线是,而在完全垄断市场上,一家厂商所面临的需求曲线是。
水平线,向右下方倾斜6、经济学家根据与的程度,把现实中的市场分为、、、和四种类型。
竞争,垄断,完全竞争,完全垄断,垄断竞争,寡头垄断7、完全垄断市场上的厂商数量是。
1二、判断题1、在完全垄断市场上,一家厂商就是一个行业2、垄断竞争市场上的产量高于完全垄断市场上,价格却低于完全垄断市场3、在完全竞争市场上,个别厂商销售量的变动会影响市场价格的变动4、垄断对社会有百害而无一利,所以,各国都反对垄断5、如果垄断者实行完全的价格歧视,他就可以获得所有消费者剩余6、在市场经济中,完全垄断是普遍存在的7、有差别存在就会有垄断8、在完全竞争市场上,当厂商实现了长期均衡时,可获得超额利润9、寡头垄断市场上的产量是由各寡头之间协商确定的10、只有在完全竞争市场上,平均收益才等于边际收益,其他市场上都不存在这种情况11、产品有差别就不会有完全竞争12、在完全竞争市场上,整个行业的需求曲线是一条与横轴平行的线13、在完全竞争市场上,任何一个厂商都可以成为价格的决定者14、引起垄断竞争的基本条件是产品无差别15、由于寡头之间可以进行勾结,所以,他们之间并不存在竞争 16、在完全垄断市场上,边际收益一定大于平均收益三、单选题1、如果以利润最大化为目标的企业的边际收益小于其边际成本,那么,该企业a. 必然处于经济亏损状态b. 必然获得经济利润c. 应该减少其产量d. 应该增加其产量 c2、在长期中,企业会发生的最大经济亏损是a. 零b. 其总成本c. 其可变成本d. 其平均可变成本 a3、如果一个竞争企业生产的产量使价格等于平均总成本,那么a. 将停止营业b. 收支相抵c. 仍然回获得经济利润d. 处于有经济亏损状态 b4、为了使垄断产生,就应该a. 某个行业的产品只有一个供给者b. 这种物品没有相近的替代品c. 限制其他企业进入d. 以上全对 d5、以下都是完全竞争的特征,其中哪一种不是垄断竞争的特征a. 有许多企业b. 企业生产无差别产品c. 企业一利润最大化为目标d. 自由进入 b6、在长期中要维持卡特尔是困难的。
- 1、下载文档前请自行甄别文档内容的完整性,平台不提供额外的编辑、内容补充、找答案等附加服务。
- 2、"仅部分预览"的文档,不可在线预览部分如存在完整性等问题,可反馈申请退款(可完整预览的文档不适用该条件!)。
- 3、如文档侵犯您的权益,请联系客服反馈,我们会尽快为您处理(人工客服工作时间:9:00-18:30)。
第七章 消费者、生产者与市场效率复习题:1、解释买者的支付意愿、消费者剩余和需求曲线如何相关。
答:需求曲线反映了买者的支付意愿。
在任何一种数量时,需求曲线给出的价格表示边际买者的支付意愿。
需求曲线以下和价格以上的总面积是一种物品或劳务市场上所有买者消费者剩余的总和。
2、解释卖者的成本、生产者剩余和供给曲线如何相关。
答:供给曲线的高度与卖者的成本相关。
在任何一种数量时,供给曲线给出的价格表示边际卖者的成本。
供给曲线以上和价格以下的总面积衡量市场的生产者剩余。
3、在供求图中,说明市场均衡时的生产者和消费者剩余。
答:4、什么是效率?它是经济决策者的唯一目标吗?答:效率是指资源配置使社会所有成员得到的总剩余最大化的性质。
价格均衡价格数量 APE 的面积代表消费者剩余;PBE 的面积代表生产者剩余。
除了效率外,经济决策者还应该关心平等。
实际上,市场交易的好处很像在市场参与者之间分割一块蛋糕,经济决策者不仅要关心如何奖经济蛋糕做大,即效率;还要考虑如何在市场参与者之间分割这块蛋糕,这就涉及公平问题。
5、看不见的手有什么作用?答:每一个市场参与者都会尽力追求自己的利益,看不见的手指引他们在相互竞争中达到一个并非他们本意想要达到的目的,这就是市场均衡点。
在均衡点上,消费者剩余和生产者剩余总和最大化,整个社会福利达到最大。
6、说出两种市场失灵的名字。
解释为什么每一种都可能使市场结果无效率。
答:市场失灵包括市场势力和外部性。
如果某一市场上存在市场势力,即只有极少部分(可能是一个)买者或卖者可以控制的市场价格,他们就会使价格倾向于对他们这一小部分人有益的水平。
于是,市场价格和数量背离供求平衡,社会福利达不到最大,市场失去效率。
外部性是某些市场参与者的行为对旁观者福利的影响。
它使市场福利还要取决于买者评价和卖者成本之外的其他因素。
由于买者和卖者在决定消费和生产时并没有考虑这种负作用。
所有,从整个社会角度来看,市场均衡可能是无效率的。
问题与应用:1、加利福尼亚早来的寒流使柠檬变酸。
在柠檬市场上消费者剩余会有什么变动?在柠檬市场上消费者剩余会有什么变动?用图形说明你的答案。
答:柠檬变酸,消费者对柠檬的评价下降,需求曲线向左下方移动。
在其他条件不变的情况下,消费者剩余减少。
如A 图所示,柠檬质量下降,使需求曲线从D1下降到D2,APE 是原先的消费者剩余,A ’P ’E ’是变动后的消费者剩余,APE>A ’P ’E ’。
由于柠檬价格的下降,柠檬水的投入成本减少,柠檬水的价格也下降。
在其他条件不变的情况下,柠檬水市场上消费者剩余增加,如图B 所示。
2、假设法国面包的需求增加。
在法国面包市场上生产者剩余会发生什么变动?面粉市场上生产者剩余会发生什么变动?用图形说明你的答案。
答:价格数量 数量 A .柠檬市场 B .柠檬水市场OO由于需求增加,在其他条件不变的情况下,法国面包的价格会上升,市场上生产者剩余增加。
如图A ,价格从P1上升到P2,销售量从Q1上升到Q2,生产者剩余从面积P1BE1增加到P2BE2。
由于面包产量上升,它的生产要素面粉的需求量也会上升。
在其他条件不变的情况下,面粉的价格会上升,市场上生产者剩余增加。
如图B 所示,生产者剩余从面积P1BE1增加到P2BE2。
10、20世纪80年代末和90年代初加利福尼亚许多地方经历了严重的干旱。
A .用水市场的图形说明干旱对水的均衡价格和数量的影响。
答:干旱使水的供给曲线S 向左上方移动到S ’。
水的均衡价格从P0上升到P1,均衡数量从Q0下降到Q1。
数量 数量A .面包市场的生产者剩余B .面粉市场的生产者剩余Q2 Q2 Q1 Q1B .但是,许多社区不允许水价变动。
这种政策对水市场有什么影响?用你的图说明会出现短缺还是过剩。
答:这种政策使水市场发生了短缺。
水的供给量Q2小于水的需求量Q3,如下图。
C .1991年《华尔街日报》上的读者来信指出,“要求所有洛杉矶居民在他们1986年用水水平的基础上从3月1日起减少10%的用水,价格数量限定的水价需求量 Q3 均衡量 Q1供给量Q2 价格数量干旱时的价格干旱前的价格干旱前的均衡量Q0 干旱时的均衡量Q1 干旱时的均衡价格从5月1日起再减少10%。
”作者根据效率和平等原则批评这种政策,他说:“这种政策不仅奖励那些在1986年‘浪费’水更多的家庭,很少能鼓励那些还能再减少用水的消费者,(而且)……惩罚了那些无法立即减少用水的消费者。
”洛杉矶这种制度在哪一方面使水的配置无效率?又在哪一方面看来不公平?答:这种制度没有把水卖给对它评价最高的人。
要求每个消费者都同比例减少自己的用水量,那些平时用水很浪费的人减少这个比例的用水对他的效用不会有多少影响。
但那些平时就很节水的人减少这个比例的用水,会使他们的消费者剩余大大减少,因为他们对水的评价比浪费水的人高,但市场又不能满足他们的交易要求。
另外,这种制度没有给人们一种主动节水的激励,人们只要将用水量减少规定的比例就没有理由再减少更多的用水量。
所以,这种制度使水的配置无效率。
这种制度对平时节水的消费者不公平。
因为他们每节约1单位水的成本要大于平时浪费水的消费者,但他们又和平时浪费水的消费者被规定了相同的节水比例。
D.假设洛杉矶改为允许水价一直上升到需求量等于供给量。
这会使水的配置较有效率吗?按你的观点,这种做法比报纸文章中提到的同比例减少用水公平呢,还是不公平?什么方法能使市场解决方法更公平?答:允许水价一直上升到需求量等于供给量,这会使水的配置较有效率。
市场是最有效率的资源配置手段。
这种做法与报纸文章中提到的同比例减少用水存在一样的问题,是不公平的。
水价上升,平时浪费水的消费者可以比平时节水的消费者更容易减少用水量,从而减少水费支出。
可以采取适当的补贴使市场解决方法更公平。
第八章应用:税收的代价复习题:1、当对一种物品征税时,消费者和生产者剩余会发生什么变动?如何把消费者和生产者剩余变动与税收收入进行比较?解释原因。
答:当对一种物品征税时,消费者和生产者剩余都会减少。
我们可以用税收前后的总福利来比较消费者剩余和生产者剩余变动与税收收入,看税收前的福利与税收后的福利谁大谁小。
税收前的福利=生产者剩余+消费者剩余,税收后的福利=生产者剩余+消费者剩余+税收收入。
税收前的福利大于税收后的福利,说明消费者剩余和生产者剩余的减少大于税收收入。
反之,则小于。
2、画出有物品销售税的供求图。
说明无谓损失。
说明税收收入。
答:如下图所示,对一种征税减少了消费者剩余(面积B+E表示减少量)和生产者剩余(面积C+F表示减少量)。
生产者和消费者剩余的减少大于税收收入(用面积B+C表示),税收引起了无谓损失(用面积E+F表示)。
3、供给与需求弹性如何影响税收的无谓损失?为什么有这种影响? 答:供给与需求曲线的弹性越大,税收的无谓损失越大;供给与需求曲线曲线的弹性越小,税收的无谓损失越小。
因为供给与需求弹性衡量买者和卖者对价格变动的反应程度,决定了税收扭曲会使市场结果有多大变动。
4、为什么专家对劳动税无谓损失大还是小的看法不一致?答:专家对劳动税无谓损失大还是小的看法不一致,部分是由于他们对供给和需求的价格弹性大小的看法不一致。
在任何一个市场上,供给和需求越富有弹性,该市场上的税收对行为的扭曲就越大,而劳动力市场的供给和需求的价格弹性大小是在改变的。
5、当税收增加时,无谓损失和税收收入有什么变动?答:当税收增加时,无谓损失增加,并且无谓损失的增加要快于税收规模的增加。
税收增加时,税收收入先增加,然后随着税收规模越来越大,市场收缩非常之大,以至于税收收入开始减少。
价格数量Q2 Q1 买者支付的价格没有税收时的价格卖者得到的的价格问题与应用:1、批萨饼市场的特征是向右下方倾斜的需求曲线和向右上方倾斜的供给曲线。
A .画出竞争市场均衡图。
标出价格、数量、消费者剩余和生产者剩余。
有无谓损失吗?解释原因。
答:B .假设政府强迫每个批萨饼店每卖出一个批萨饼缴纳1元税。
说明这种批萨饼税的影响,确定并标出消费者剩余、生产者剩余、政府收入以及无谓损失。
如何把每块面积与税前的情况相比较?答:这种披萨饼税使卖者得到的价格降低,买者支付的价格上升,销售量从Q1减少到Q2。
消费者剩余由税收前的面积A+B+E 减少到税收后的面积D 。
税收收入为面积B+C 。
无谓损失为面积E+F 。
税收前没有税收收入和无谓损失(见下图)。
数量O 价格均衡价格P没有无谓损失。
自由竞争市场使供给与需求达到均衡点,消费者对该物品的评价等于生产者的成本。
在均衡状态下,总剩余达到最大,如左图。
C .如果取消税收,批萨饼的消费者和卖者的状况在变好,但政府会失去税收收入。
假设消费者和生产者自愿把他们的部分收入给予政府。
各方的状况能比有税收时变好吗?用你的图上所标出的面积作出解释。
答:如果取消税收,消费者和生产者自愿把收入交给政府,他们对市场的需求和供给就不会改变,市场仍处于原有的均衡状态。
虽然买者实际支付的价格上升了,卖者实际得到的价格下降了,但销售了不变。
买者和卖者所得减少的部分都交给了政府,不存在无谓损失。
各方的状况必有税收的时好。
如上图所示,如果披萨饼的生产者交给政府的收入是C ,消费者交的是B ,此时消费量仍是Q1,生产者剩余是面积D+F ,消费者剩余是A+E ,没有无谓损失。
10、大多数州对购买新汽车征税。
假定现在新泽西州要求汽车中间商每卖一辆汽车向州政府叫100元税,并计划在下一年把每辆汽车的税增加到150元。
价格数量Q2 Q1 买者支付的价格没有税收时的价格卖者得到的的价格A.说明这种税收增加对新泽西汽车销售量、消费者支付的价格和生产者得到的价格的影响。
答:这种税收增加对新泽西汽车销售量下降,消费者支付的价格上升,生产者得到的价格下降。
B.做一个表,表示税收增加前后的消费者剩余、生产者剩余、政府收入和总剩余的水平。
答:C.政府收入有什么变动?是正的还是负的?答:政府收入变动,是正是负还需要考察这种税收规模使新泽西州的汽车市场处在拉伐曲线的哪一边。
如果150元/辆的税使市场处在拉伐曲线不利的一边,则政府收入变动为负;如果150元/辆的税收下,市场仍处在拉伐曲线有利的一边,则政府收入变动为正。
D.无谓损失有什么变动?是正的还是负的?答:无谓损失增加。
税收增加会使市场规模进一步减小,产生更大的无谓损失。
E.给出一个理由,说明为什么新泽西州的汽车需求是相当富有弹性的。
这种汽车需求富有弹性使额外的税收增加还是减少了政府收入?该州应该如何努力减少需求弹性?答:假设新泽西因为收入水平较低,使汽车需求相对富有弹性。
在这种情况下,价格上升就会有许多人退出市场,市场规模随税收的增加而收缩的很快,无谓损失太大,税收收入负增长。